. 2022 Apr 11;377(1848):20210020.
doi: 10.1098/rstb.2021.0020. Epub 2022 Feb 21.

Effects of species interactions on the potential for evolution at species' range limits

Affiliations

Effects of species interactions on the potential for evolution at species' range limits

Jake M Alexander et al. Philos Trans R Soc Lond B Biol Sci. .

Abstract

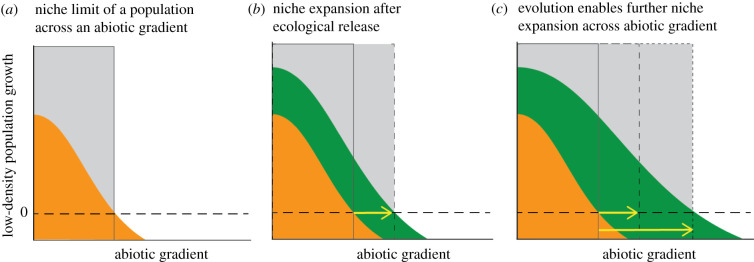
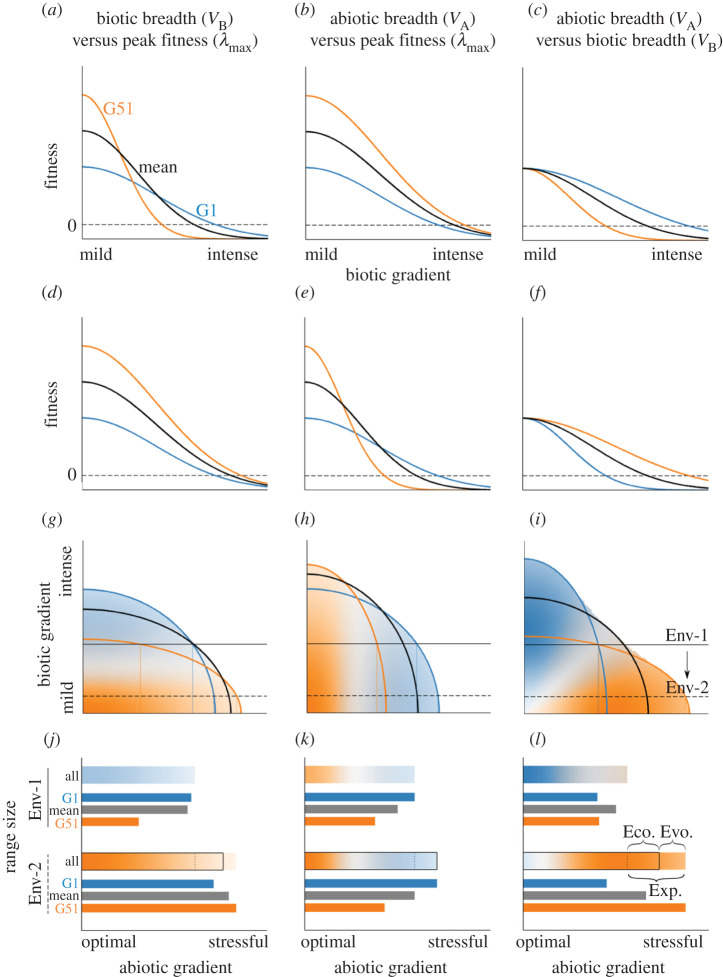
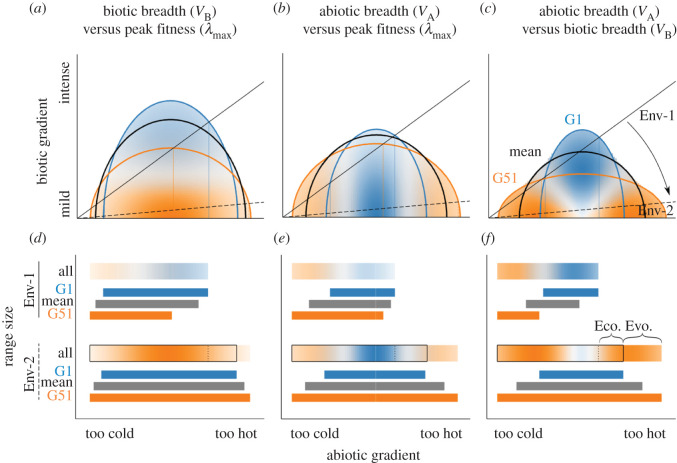
Species' ranges are limited by both ecological and evolutionary constraints. While there is a growing appreciation that ecological constraints include interactions among species, like competition, we know relatively little about how interactions contribute to evolutionary constraints at species' niche and range limits. Building on concepts from community ecology and evolutionary biology, we review how biotic interactions can influence adaptation at range limits by impeding the demographic conditions that facilitate evolution (which we term a 'demographic pathway to adaptation'), and/or by imposing evolutionary trade-offs with the abiotic environment (a 'trade-offs pathway'). While theory for the former is well-developed, theory for the trade-offs pathway is not, and empirical evidence is scarce for both. Therefore, we develop a model to illustrate how fitness trade-offs along biotic and abiotic gradients could affect the potential for range expansion and niche evolution following ecological release. The model shows that which genotypes are favoured at species' range edges can depend strongly on the biotic context and the nature of fitness trade-offs. Experiments that characterize trade-offs and properly account for biotic context are needed to predict which species will expand their niche or range in response to environmental change. This article is part of the theme issue 'Species' ranges in the face of changing environments (Part II)'.

Keywords: biotic interactions; ecological release; local adaptation; niche expansion; range limits; trade-offs.


Figures

Figure 1.
Figure 1.
Conceptual illustration of how species interactions can limit evolution at a range edge. (a) A species’ range (grey box) occurs along the portion of an environmental gradient where the species has a positive growth rate (i.e. above the dashed reference line) at low intra-specific density but in the presence of other species. The range edge (black vertical line) occurs where the growth rate of a (potentially locally adapted) range-edge population (orange) falls below 0. (b) Ecological release following the loss or reduction of an antagonist (e.g. a competing species) increases population growth (green), enabling the species to expand its niche/geographical range ecologically without evolution occurring (yellow arrow). (c) In the longer term, ecological release allows the population to maintain larger population sizes, experience new portions of the abiotic gradient and experience a weakening of any adaptive trade-offs between the antagonist and the abiotic environment, enabling evolution and further range expansion.
Figure 2.
Figure 2.
Fitness trade-offs affect responses to ecological release in a simple environment (species interactions are constant across an abiotic gradient). Each column corresponds to a trade-off between a pair of ‘traits’ (af) that determine the shape of the fitness function for 51 genotypes across biotic and abiotic gradients (gi). Top row: the fitness of extreme genotypes, G1 and G51, and the mean genotype, vary along the biotic gradient from mild to intensely negative effects of interactions. Second row: the fitness of the same genotypes varies along the abiotic gradient, ranging from optimal to stressful. Third row: the identity of the most-fit genotype at each combination of abiotic (x-axis) and biotic (y-axis) conditions. Colour hue indicates genotype identity (blue: genotype G1, grey: mean genotype, orange: genotype G51), colour intensity indicates the strength of selection favouring that genotype, fading to white as fitness variation among genotypes approaches zero. Curved lines indicate the boundaries of the area of positive population growth for each genotype (W = 1; equation S4 in electronic supplementary material, Methods). Two hypothetical environmental axes are shown: Env-1 (benchmark axis, solid, in which biotic pressure is strong and constant along the abiotic gradient) and Env-2 (release from antagonists, dashed, in which biotic pressure is weak and constant along the abiotic gradient). The intercept between a genotype isocline and the environmental axis indicates the edge of the potential range (i.e. position along the abiotic gradient) for the three example genotypes in that environment. Bottom row: the possible ranges of the indicated genotype in environments 1 (Env-1; top bars) and 2 (Env-2; bottom bars). In each environment, the thicker, top bar is colour-coded with the identity of the fittest genotype at that position along the gradient. In Env- 2, this bar is surrounded by a square that represents the portion of the range that would be occupied if evolution did not occur. For reference, a dotted line shows the maximum range in Env-1. Brackets depict the total range expansion (Exp.), the portion of that expansion attributable to ecological effects of release from antagonists (Eco: the differences in ranges if there is no change in genotype at range margins), and the portion of that expansion attributable to evolutionary release via the ‘trade-offs pathway’ (Evo: the difference in ranges between the genotype favoured at the original range edge and genotype favoured at the expanded range edge). The thinner, solid-coloured bars show the total range of the genotypes G1 (blue) and G51 (orange), as well as the mean range of all genotypes (grey). Note that these are not necessarily the range edge genotypes.
Figure 3.
Figure 3.
Trade-offs affect responses to ecological release in a complex environment (biotic and abiotic conditions covary). While fitness trade-offs are the same those as shown in figure 2, here the focal species' fitness along the abiotic gradient is maximized at intermediate values (the abiotic gradient is given as temperature but could be any abiotic variable). As in figure 2, two hypothetical environmental axes are shown, but here the environmental axes (Env-1, the benchmark axis, solid; Env-2, the ecological release axis, dashed) are sloped. This corresponds to a scenario in which biotic stress increases along the abiotic gradient, so that biotic release has the greatest effect where biotic stress is highest. The abiotic range limits are defined as the points where the isocline crosses the environmental axis. As a result, species distributions in Env-1 are skewed to the left, because moving right along the environmental axis means moving into increasingly intense biotic inhibition. Colour corresponds to genotype (see figure 2); in top panels and the all-genotype bar in bottom panels, colour hue indicates the most fit genotype and colour intensity indicates the intensity of selection; see figure 2 for full description of panels.

References

    1. Holt RD. 2009. Bringing the Hutchinsonian niche into the 21st century: ecological and evolutionary perspectives. Proc. Natl Acad. Sci. USA 106, 19 659-19 665. (10.1073/pnas.0905137106) - DOI - PMC - PubMed
    1. Martínez-Meyer E, Townsend Peterson A, Hargrove WW. 2004. Ecological niches as stable distributional constraints on mammal species, with implications for Pleistocene extinctions and climate change projections for biodiversity. Glob. Ecol. Biogeogr. 13, 305-314. (10.1111/j.1466-822X.2004.00107.x) - DOI
    1. Stigall AL. 2012. Using ecological niche modelling to evaluate niche stability in deep time. J. Biogeogr. 39, 772-781. (10.1111/j.1365-2699.2011.02651.x) - DOI
    1. Antonovics J. 1976. The nature of limits to natural selection. Ann. Mo. Bot. Gard. 63, 224-247. (10.2307/2395303) - DOI
    1. Polechová J, Barton NH. 2015. Limits to adaptation along environmental gradients. Proc. Natl Acad. Sci. USA 112, 6401. (10.1073/pnas.1421515112) - DOI - PMC - PubMed

Publication types

LinkOut - more resources