

Comparative assessment of methods for short-term forecasts of COVID-19 hospital admissions in England at the local level
- PMID: 35184736
- PMCID: PMC8858706
- DOI: 10.1186/s12916-022-02271-x
Comparative assessment of methods for short-term forecasts of COVID-19 hospital admissions in England at the local level
Abstract
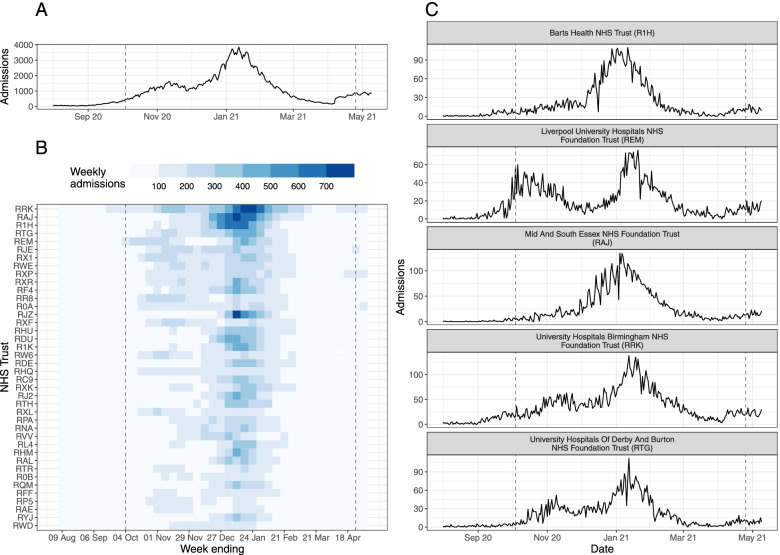
Background: Forecasting healthcare demand is essential in epidemic settings, both to inform situational awareness and facilitate resource planning. Ideally, forecasts should be robust across time and locations. During the COVID-19 pandemic in England, it is an ongoing concern that demand for hospital care for COVID-19 patients in England will exceed available resources.
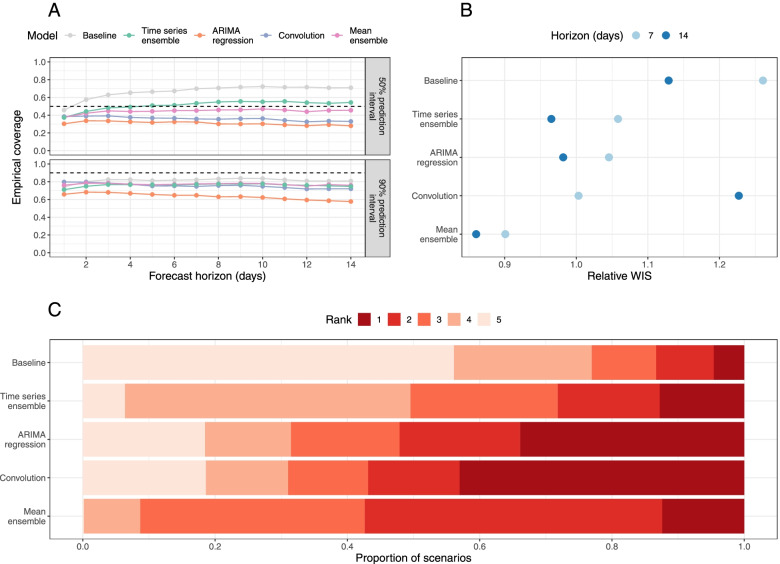
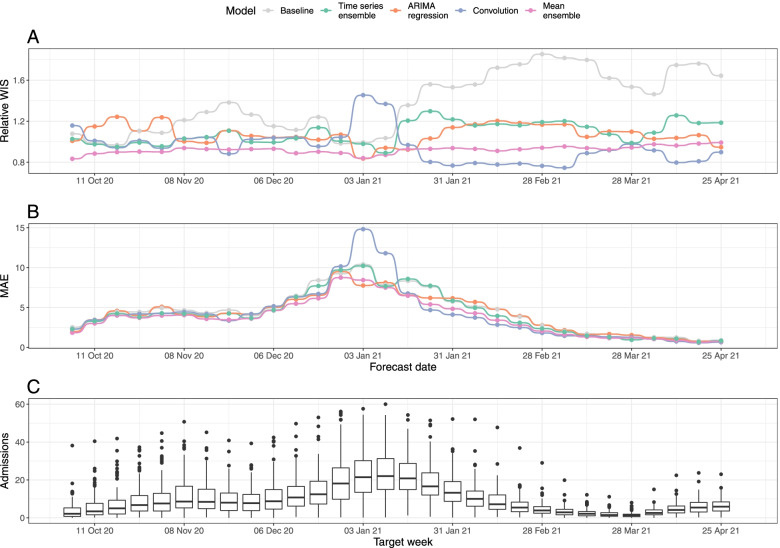
Methods: We made weekly forecasts of daily COVID-19 hospital admissions for National Health Service (NHS) Trusts in England between August 2020 and April 2021 using three disease-agnostic forecasting models: a mean ensemble of autoregressive time series models, a linear regression model with 7-day-lagged local cases as a predictor, and a scaled convolution of local cases and a delay distribution. We compared their point and probabilistic accuracy to a mean-ensemble of them all and to a simple baseline model of no change from the last day of admissions. We measured predictive performance using the weighted interval score (WIS) and considered how this changed in different scenarios (the length of the predictive horizon, the date on which the forecast was made, and by location), as well as how much admissions forecasts improved when future cases were known.
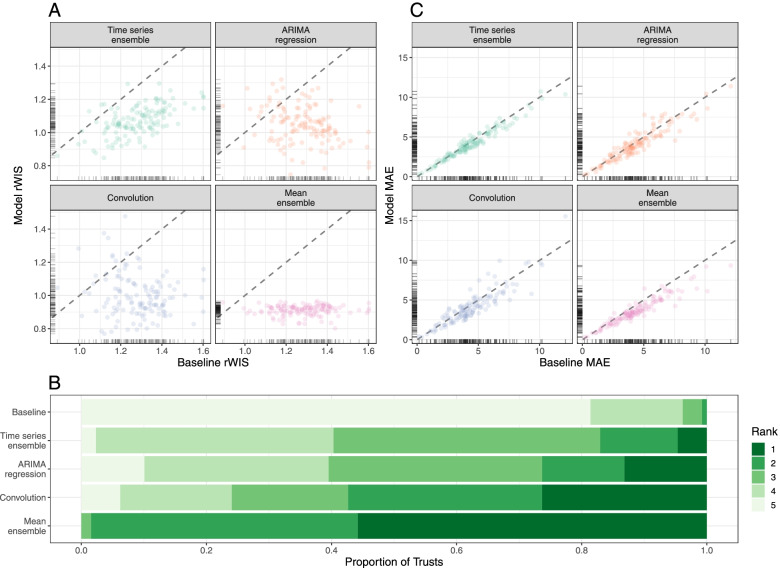
Results: All models outperformed the baseline in the majority of scenarios. Forecasting accuracy varied by forecast date and location, depending on the trajectory of the outbreak, and all individual models had instances where they were the top- or bottom-ranked model. Forecasts produced by the mean-ensemble were both the most accurate and most consistently accurate forecasts amongst all the models considered. Forecasting accuracy was improved when using future observed, rather than forecast, cases, especially at longer forecast horizons.
Conclusions: Assuming no change in current admissions is rarely better than including at least a trend. Using confirmed COVID-19 cases as a predictor can improve admissions forecasts in some scenarios, but this is variable and depends on the ability to make consistently good case forecasts. However, ensemble forecasts can make forecasts that make consistently more accurate forecasts across time and locations. Given minimal requirements on data and computation, our admissions forecasting ensemble could be used to anticipate healthcare needs in future epidemic or pandemic settings.
Keywords: COVID-19; Ensemble; Forecasting; Healthcare demand; Infectious disease; Outbreak; Real-time.
© 2022. The Author(s).
Conflict of interest statement
The authors declare they have no competing interests.
Figures
Update of
-
Comparative assessment of methods for short-term forecasts of COVID-19 hospital admissions in England at the local level.medRxiv [Preprint]. 2022 Jan 19:2021.10.18.21265046. doi: 10.1101/2021.10.18.21265046. medRxiv. 2022. Update in: BMC Med. 2022 Feb 21;20(1):86. doi: 10.1186/s12916-022-02271-x. PMID: 34704097 Free PMC article. Updated. Preprint.
References
-
- Wilde H, Mellan T, Hawryluk I, Dennis JM, Denaxas S, Pagel C, et al. The association between mechanical ventilator compatible bed occupancy and mortality risk in intensive care patients with COVID-19: a national retrospective cohort study. BMC Med. 2021;19:213. doi: 10.1186/s12916-021-02096-0. - DOI - PMC - PubMed
-
- Camacho A, Kucharski A, Aki-Sawyerr Y, White MA, Flasche S, Baguelin M, et al. Temporal Changes in Ebola Transmission in Sierra Leone and Implications for Control Requirements: a Real-time Modelling Study. PLoS Curr. 2015;7. 10.1371/currents.outbreaks.406ae55e83ec0b5193e30856b9235ed2. - PMC - PubMed
Publication types
MeSH terms
Grants and funding
LinkOut - more resources
Full Text Sources
Medical
Miscellaneous
