. 2022 Apr:157:111927.
doi: 10.1016/j.chaos.2022.111927. Epub 2022 Feb 16.

Modeling COVID-19 dynamic using a two-strain model with vaccination

Affiliations

Modeling COVID-19 dynamic using a two-strain model with vaccination

Ugo Avila-Ponce de León et al. Chaos Solitons Fractals. 2022 Apr.

Abstract

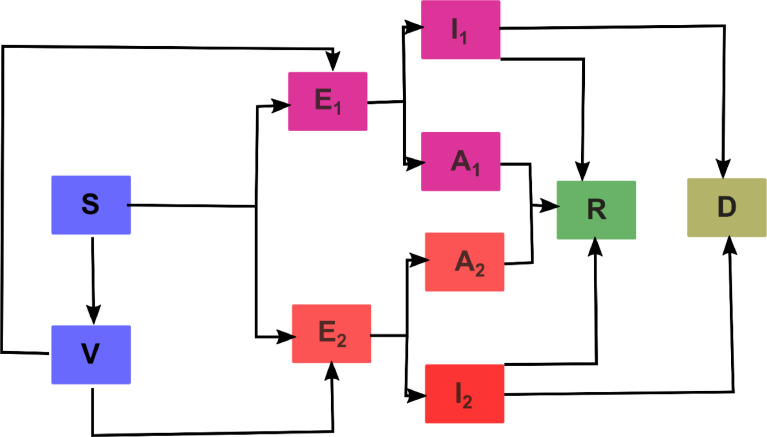
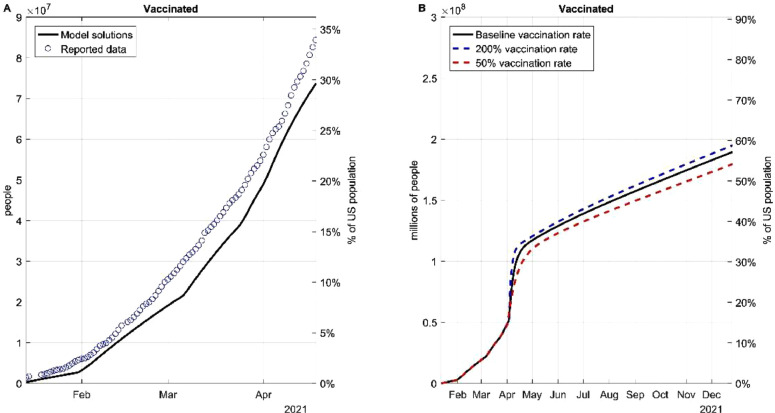
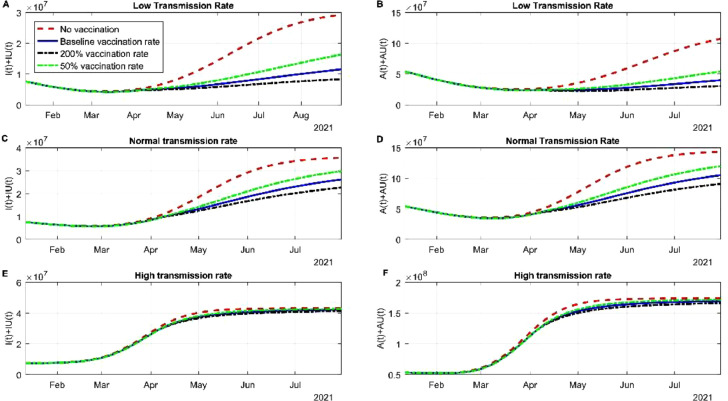
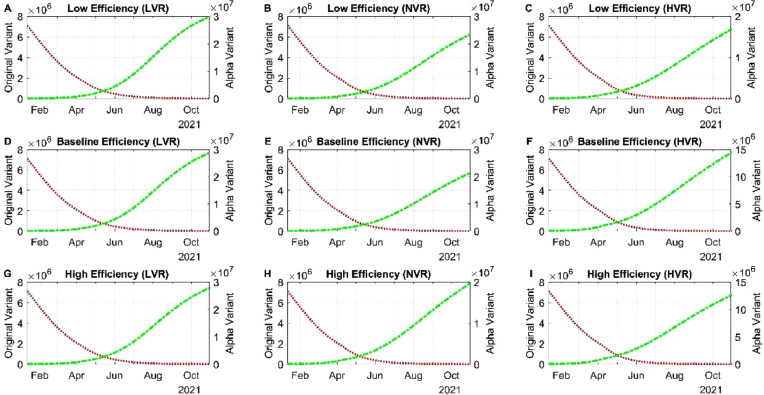
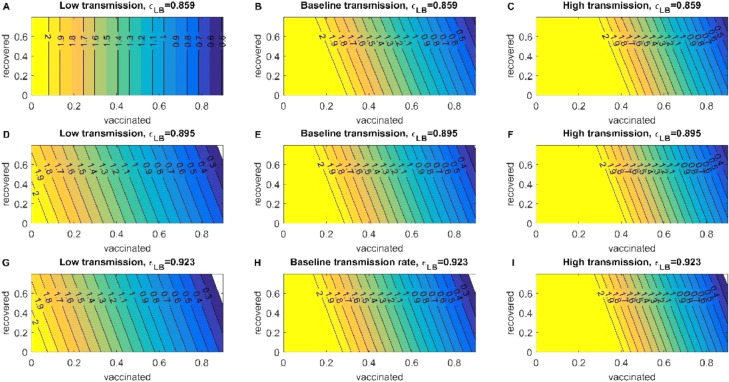
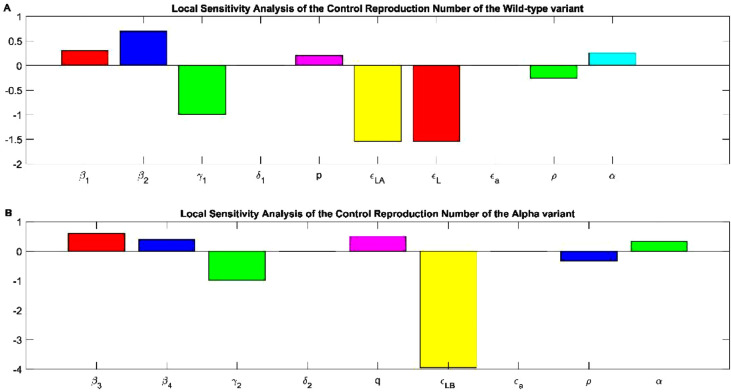
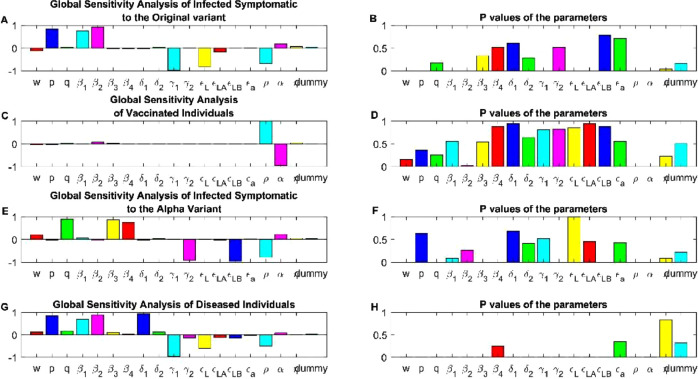
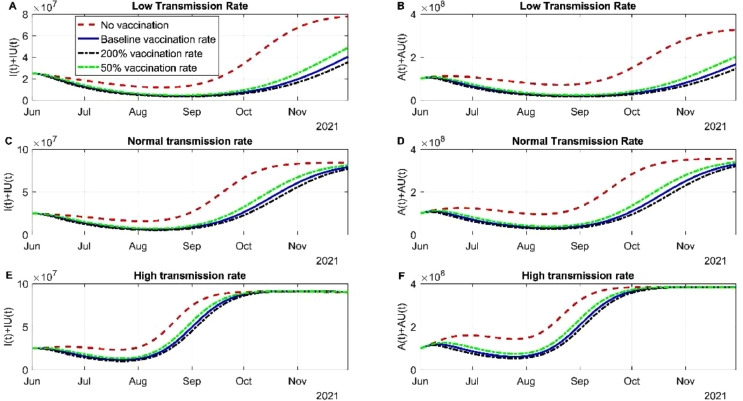
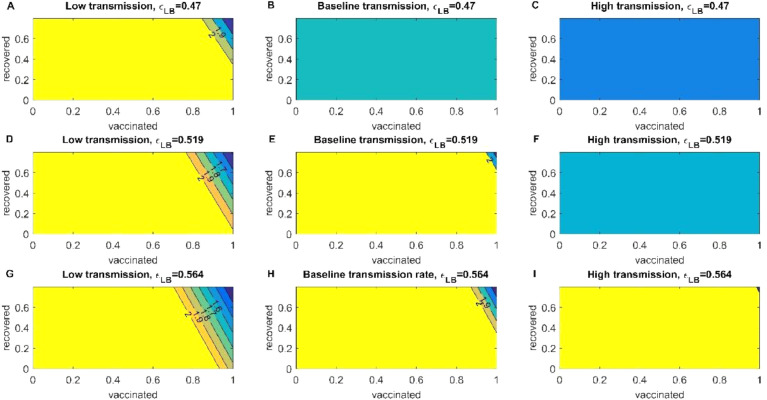
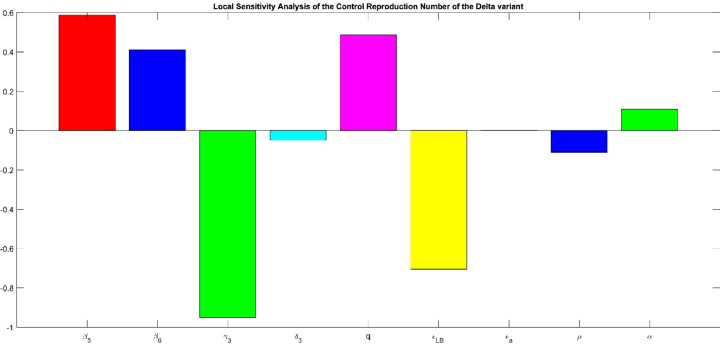
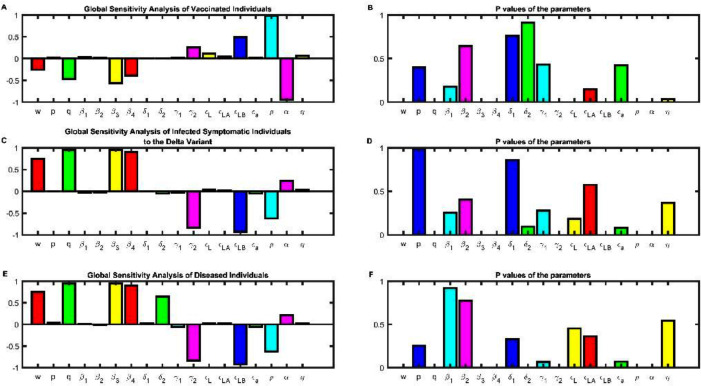
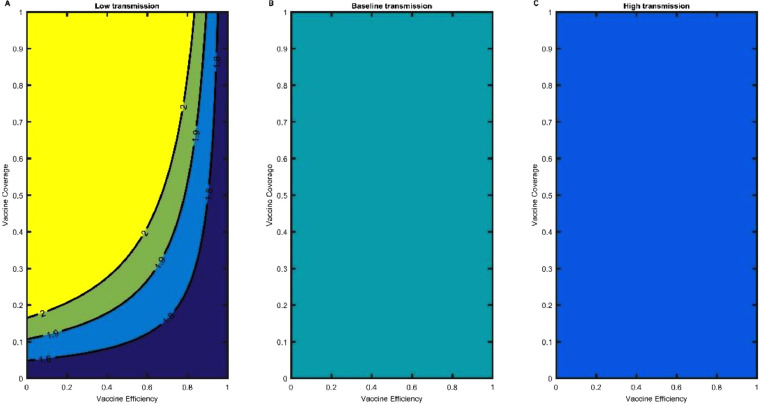
Multiple strains of the SARS-CoV-2 have arisen and jointly influence the trajectory of the coronavirus disease (COVID-19) pandemic. However, current models rarely account for this multi-strain dynamics and their different transmission rate and response to vaccines. We propose a new mathematical model that accounts for two virus variants and the deployment of a vaccination program. To demonstrate utility, we applied the model to determine the control reproduction number ( R c ) and the per day infection, death and recovery rates of each strain in the US pandemic. The model dynamics predicted the rise of the alpha variant and shed light on potential impact of the delta variant in 2021. We obtained the minimum percentage of fully vaccinated individuals to reduce the spread of the variants in combination with other intervention strategies to deaccelerate the rise of a multi-strain pandemic.


Conflict of interest statement

The authors declare that they have no known competing financial interests or personal relationships that could have appeared to influence the work reported in this paper.

Figures

Fig. 1
Fig. 1
Flow diagram of the multi-strain mathematical model with vaccination to evaluate the spread of the current COVID-19 pandemic. S: susceptible, V: vaccinated with Pfizer, E1: exposed to strain one, I1: infected with strain one, A1: infected asymptomatic with strain one, E2: exposed to strain two, I2: infected with strain two, A2: infected asymptomatic with strain two, R: Recuperated from strain one or two and D: death by either strain one or two.
Fig. 2
Fig. 2
Fitting and projecting the vaccination rate. (A) Deriving a function that describes the behavior of the daily doses applied in the US. (B) Dynamics if the vaccination rate is doubled or diminished 50% based on the baseline vaccination rates.
Fig. 3
Fig. 3
Simulation of different vaccine rates and different transmission rates. (A) Simulation of the dynamics of the infected subpopulation of the original variant and the alpha variant considering low transmission and different vaccination rates. (B) Simulation of the dynamics of the infected but asymptomatic subpopulation of the original variant and the alpha variant considering low transmission and different vaccination rates. (C) Simulation of the dynamics of symptomatic infected individuals for both variants considering normal transmission. (D) Simulation of the dynamics of asymptomatic infected individuals for both variants considering normal transmission. (E) Simulation of the dynamics of symptomatic infected individuals for both variants considering high transmission. (F) Simulation of the dynamics of asymptomatic infected individuals for both variants considering high transmission.
Fig. 4
Fig. 4
Simulation of different vaccine efficiencies with different vaccination rates. (A) Simulation the dynamics of symptomatic individuals with the lower bound of the 95% confidence intervals associated with the clinical trials on the Pfizer vaccine with low vaccination rate (B) Simulation the dynamics of symptomatic individuals with the lower bound of the 95% confidence intervals associated with the clinical trials on the Pfizer vaccine with normal transmission. (C) Simulation the dynamics of symptomatic individuals with the lower bound of the 95% confidence intervals associated with the clinical trials on the Pfizer vaccine with high vaccination rate. (D) Simulation the dynamics of symptomatic individuals with the baseline value of the 95% confidence intervals associated with the clinical trials on the Pfizer vaccine with low vaccination rate. (E) Simulation the dynamics of symptomatic individuals with the baseline value of the 95% confidence intervals associated with the clinical trials on the Pfizer vaccine with normal vaccination rate. (F) Simulation the dynamics of symptomatic individuals with the baseline value of the 95% confidence intervals associated with the clinical trials on the Pfizer vaccine with high vaccination rate. (G) Simulation the dynamics of symptomatic individuals with the upper bound of the 95% confidence intervals associated with the clinical trials on the Pfizer vaccine with low vaccination rate. (H) Simulation the dynamics of symptomatic individuals with the upper bound of the 95% confidence intervals associated with the clinical trials on the Pfizer vaccine with normal vaccination rate. (I) Simulation the dynamics of symptomatic individuals with the upper bound of the 95% confidence intervals associated with the clinical trials on the Pfizer vaccine with high vaccination rate.
Fig. 5
Fig. 5
Reproduction Control Number of the alpha variant. The heatmaps of the left represent the decrease of the control reproduction number when transmission is low and different vaccination efficiencies for the Pfizer vaccine. The heatmaps of the center represent the decrease of the control reproduction number when transmission is baseline and different vaccination efficiencies for the Pfizer vaccine. And the heatmaps of the left represent the decrease of the control reproduction number when transmission is high and different vaccination efficiencies for the Pfizer vaccine.
Fig. 6
Fig. 6
Sensitivity analysis of the control reproduction number for the original and the Alpha variant (A)β1and β2 represent the force of infection of the symptomatic and asymptomatic individuals. γ1 is the rate at which the individuals recuperate from the original variant. δ1 the rate at which individuals passed away from the original variant. p is the percentage of individuals that develop symptoms. ɛLA is the vaccine efficiency or leakiness to prevent asymptomatic infection by the original variant. ɛL is the vaccine efficiency or leakiness to prevent symptomatic infection by the original variant. ɛa is the all or nothing protection of the vaccine to get infected to the original variant. α is the waning rate or loss of protection provided by the vaccine to the original variant. ρ is the rate of vaccination. (B) β3and β4 represent the force of infection of the symptomatic and asymptomatic individuals. γ2 is the rate at which the individuals recuperate from the alpha variant. δ2 the rate at which individuals passed away from the alpha variant. q is the percentage of individuals that develop symptoms. ɛLB is the vaccine efficiency or leakiness to prevent being infected or not by the alpha variant. ɛa is the all or nothing protection of the vaccine to get infected to the alpha variant. α is the waning rate or loss of protection provided by the vaccine to the alpha variant. ρ is the rate of vaccination.
Fig. 7
Fig. 7
Global Sensitivity Analysis of the set of differential equations. Partial Rank Correlation Coefficient (PRCC), of the dynamic change of (A) infected symptomatic individuals, (B) Vaccinated individuals, (E) Infected symptomatic to the alpha variant and (G) Diseased individuals, -1 means negatively correlation with the response function, meanwhile value near 1 is associated with positive correlation with the response function. p- values of the PRCC values of the parameters evaluated of the response function, (B) for infected symptomatic to the wild type, (D) of vaccinated individuals, (F) infected symptomatic to the alpha variant and (H) deceased individuals.
Fig. 8
Fig. 8
Simulation of different vaccine rates and different transmission rates between the alpha and the delta variant. (A) Simulation of the dynamics of the infected subpopulation of the alpha variant and the delta variant considering low transmission and different vaccination rates. (B) Simulation of the dynamics of the infected but asymptomatic subpopulation of the alpha variant and the delta variant considering low transmission and different vaccination rates. (C) Simulation of the dynamics of symptomatic infected individuals for both variants considering normal transmission. (D) Simulation of the dynamics of asymptomatic infected individuals for both variants considering normal transmission. (E) Simulation of the dynamics of symptomatic infected individuals for both variants considering high transmission. (F) Simulation of the dynamics of asymptomatic infected individuals for both variants considering high transmission.
Fig. 9
Fig. 9
Reproduction Control Number of the delta variant. The heatmaps of the left represent the decrease of the control reproduction number when transmission is low and different vaccination efficiencies for the Pfizer vaccine. The heatmaps of the center represent the decrease of the control reproduction number when transmission is baseline and different vaccination efficiencies for the Pfizer vaccine. And the heatmaps of the left represent the decrease of the control reproduction number when transmission is high and different vaccination efficiencies for the Pfizer vaccine.
Fig. 10
Fig. 10
Sensitivity analysis of the control reproduction number for the original variant. β5and β6 represent the force of infection of the symptomatic and asymptomatic individuals. γ3 is the rate at which the individuals recuperate from the original variant. δ3 the rate at which individuals passed away from the original variant. p is the percentage of individuals that develop symptoms. ɛL is the vaccine efficiency or leakiness to prevent asymptomatic infection by the original variant. ɛL is the vaccine efficiency or leakiness to prevent symptomatic infection by the original variant. ɛa is the all or nothing protection of the vaccine to get infected to the original variant. α is the waning rate or loss of protection provided by the vaccine to the delta variant. ρ is the rate of vaccination.
Fig. 11
Fig. 11
Global Sensitivity Analysis of the set of differential equations for the delta variant. Partial Rank Correlation Coefficient (PRCC), of the dynamic change of (A) Vaccinated individuals, (C) infected symptomatic individuals, (E) Diseased individuals, -1 means negatively correlation with the response function, meanwhile value near 1 is associated with positive correlation with the response function. p- values of the PRCC values of the parameters evaluated of the response function, (B) Vaccinated individuals, (D) of infected symptomatic individuals, (F) Diseased individuals.
Fig. 12
Fig. 12
Control Reproduction Number of the delta variant. (A) Low transmission, (B) Baseline Transmission and (C) High Transmission of the control reproduction number as a function of the vaccine efficiency of the delta variant and the vaccine coverage of the US population.

Similar articles

Cited by

References

    1. Dong E, Du H, Gardner L. An interactive web-based dashboard to track COVID-19 in real time. Lancet Infect Dis. 2020;20:533–534. doi: 10.1016/S1473-3099(20)30120-1. - DOI - PMC - PubMed
    1. Perra N. Non-pharmaceutical interventions during the COVID-19 pandemic: a review. Phys Rep. 2021;913:1–52. doi: 10.1016/j.physrep.2021.02.001. - DOI - PMC - PubMed
    1. Perkins TA, España G. Optimal Control of the COVID-19 Pandemic with Non-pharmaceutical Interventions. Bull Math Biol. 2020;82:118. doi: 10.1007/s11538-020-00795-y. - DOI - PMC - PubMed
    1. Ngonghala CN, Iboi EA, Gumel AB. Could masks curtail the post-lockdown resurgence of COVID-19 in the US? Math Biosci. 2020;329 doi: 10.1016/j.mbs.2020.108452. - DOI - PMC - PubMed
    1. Lauring AS, Hodcroft EB. Genetic Variants of SARS-CoV-2—What Do They Mean? JAMA. 2021;325:529–531. doi: 10.1001/jama.2020.27124. - DOI - PubMed

LinkOut - more resources