. 2022 Jan 21:35:10214.
doi: 10.3389/ti.2021.10214. eCollection 2021.

Bio-Engineering of Pre-Vascularized Islet Organoids for the Treatment of Type 1 Diabetes

Collaborators, Affiliations

Bio-Engineering of Pre-Vascularized Islet Organoids for the Treatment of Type 1 Diabetes

Charles-Henri Wassmer et al. Transpl Int. .

Abstract

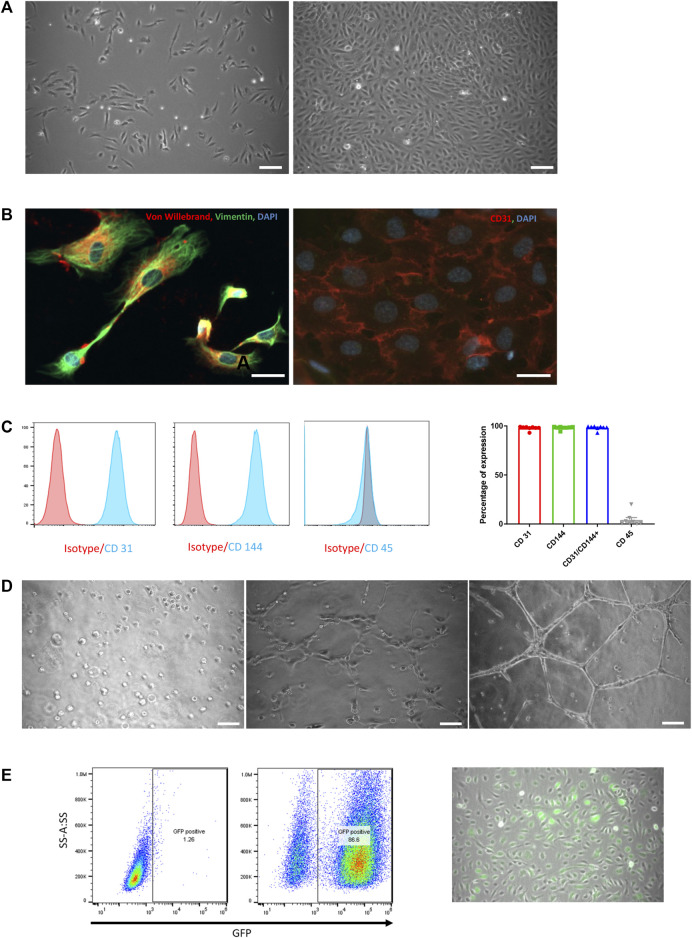
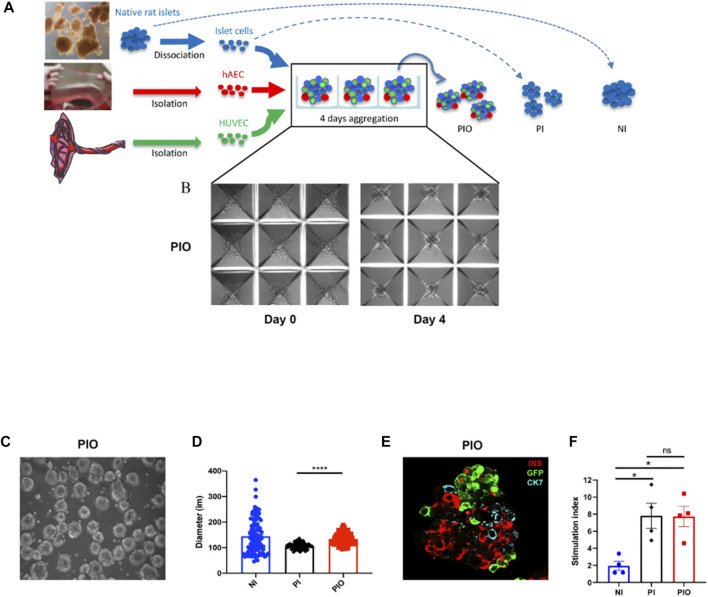
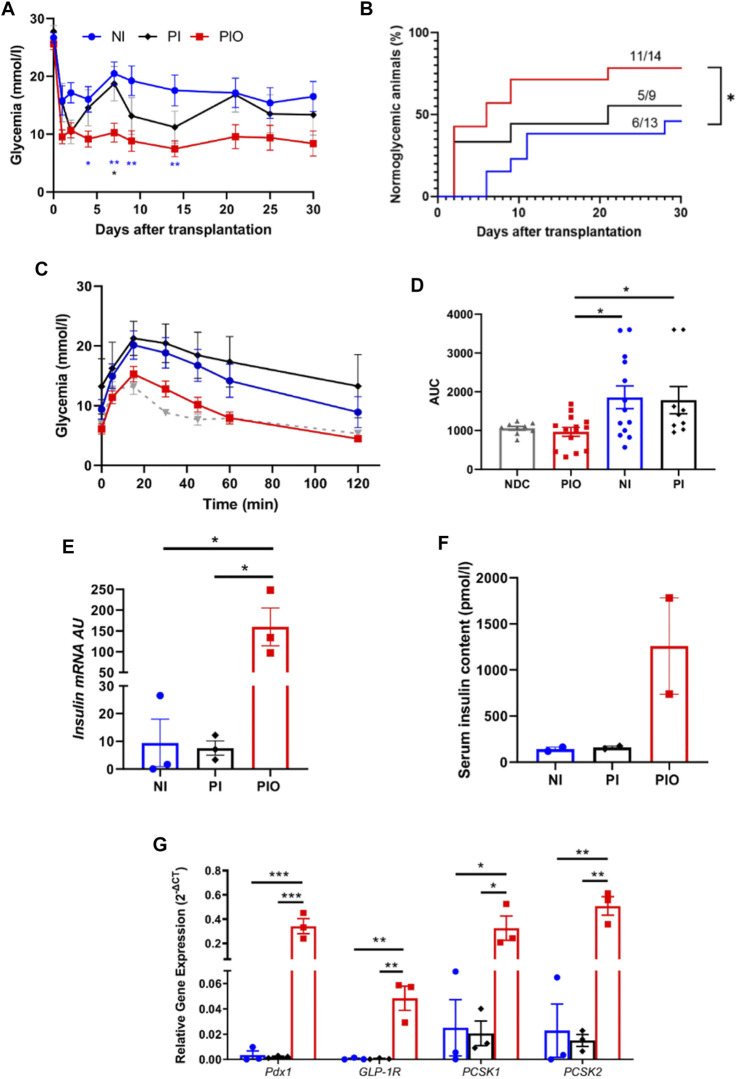
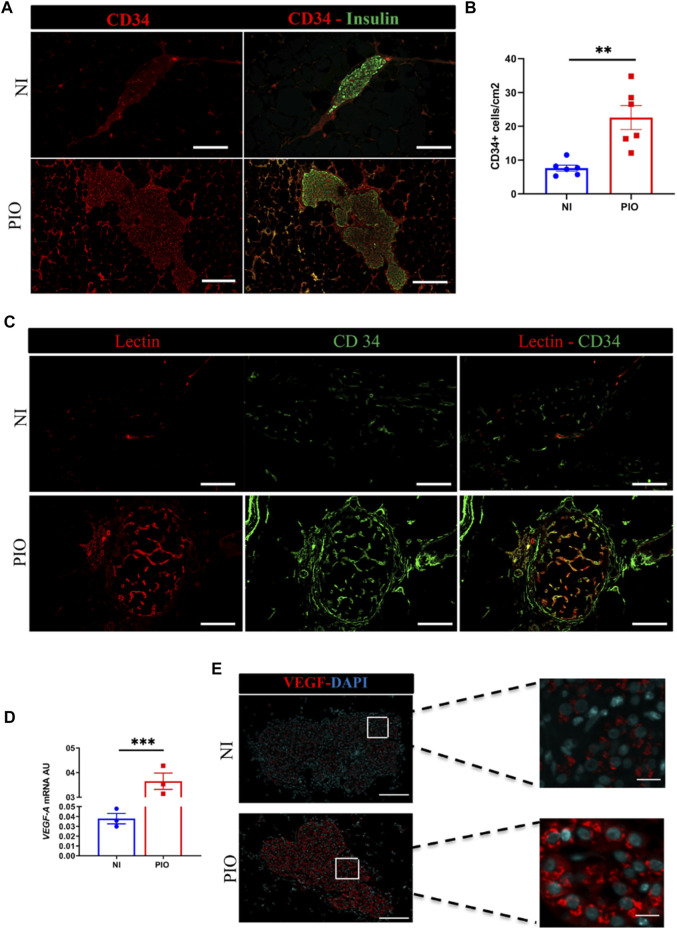
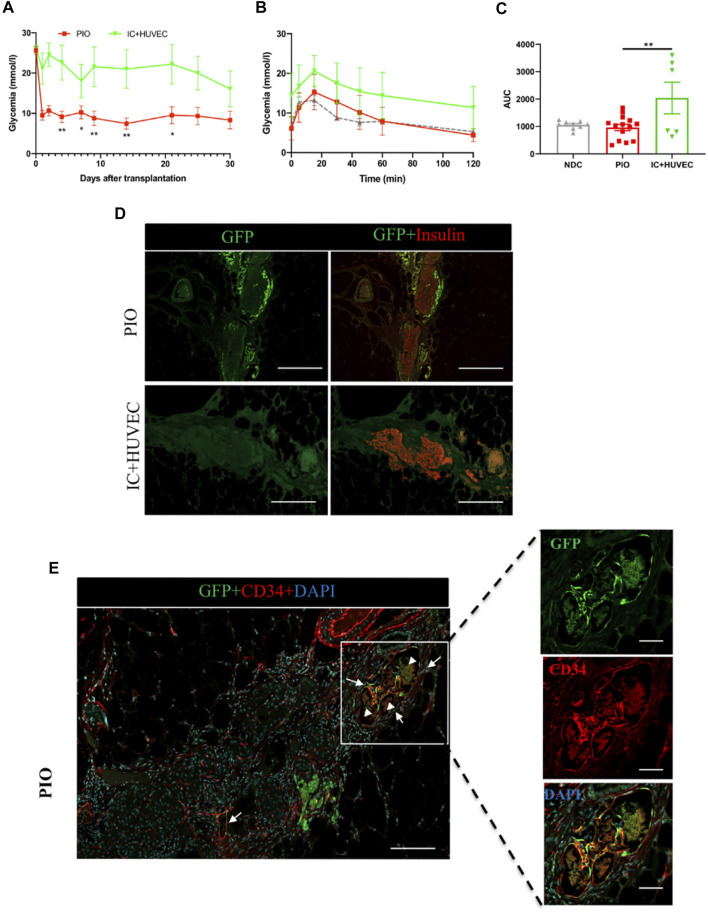
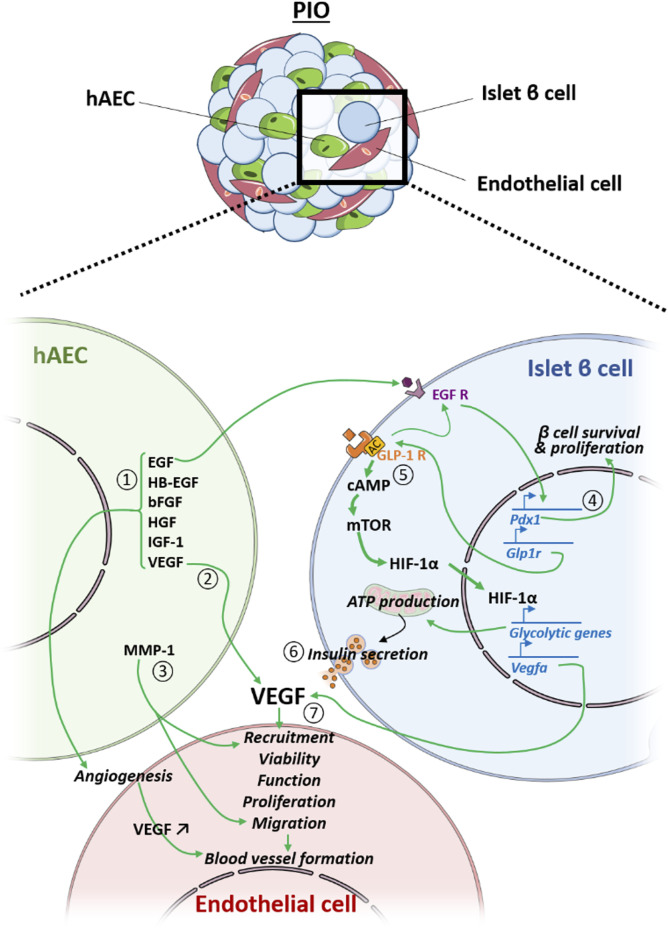
Lack of rapid revascularization and inflammatory attacks at the site of transplantation contribute to impaired islet engraftment and suboptimal metabolic control after clinical islet transplantation. In order to overcome these limitations and enhance engraftment and revascularization, we have generated and transplanted pre-vascularized insulin-secreting organoids composed of rat islet cells, human amniotic epithelial cells (hAECs), and human umbilical vein endothelial cells (HUVECs). Our study demonstrates that pre-vascularized islet organoids exhibit enhanced in vitro function compared to native islets, and, most importantly, better engraftment and improved vascularization in vivo in a murine model. This is mainly due to cross-talk between hAECs, HUVECs and islet cells, mediated by the upregulation of genes promoting angiogenesis (vegf-a) and β cell function (glp-1r, pdx1). The possibility of adding a selected source of endothelial cells for the neo-vascularization of insulin-scereting grafts may also allow implementation of β cell replacement therapies in more favourable transplantation sites than the liver.

Keywords: HUVECs; human amniotic epithelial cells; prevascularized iset organoids; regenerative medicine; tissue engineering; β cell replacement therapies.


Conflict of interest statement

The authors declare that the research was conducted in the absence of any commercial or financial relationships that could be construed as a potential conflict of interest.

Figures

FIGURE 1
FIGURE 1
HUVEC characterization and in vitro functional assessment. (A) Phase-contrast microscopic pictures of HUVEC in culture at day 1 and day 5. Scale bar = 50 µm. (B) Immunofluorescence staining of cultured HUVEC with von Willebrand (red) and Vimentin (green, left panel) and CD31 (red, right panel). Nuclei are labelled with DAPI (blue). Scale bar = 25 µm. (C) FACS analysis on HUVEC for CD31, CD144 and CD45 with their respective isotypes (left panels) and expressed as the percentage of positivity of expression on 8 consecutive preparations (mean ± SEM, right panel). (D) Phase-contrast microscopic pictures of tube formation assessment on Matrigel at 0 h, 2 and 6 h. Scale bar = 50 µm. (E) Assessment of GFP transduction success by flow cytometry analysis (left panel) and by phase-contrast microscopic images (right panel). GFP-positive cells are spontaneously green, scale bar = 50 µm.
FIGURE 2
FIGURE 2
Organoids generation. (A) Schematic representation of PI and PIO generation in culture. (B) Light microscope pictures of the PIO cultured in AggreWell™400 24-well plates at day 0 and day 4. Scale bar = 100 µm. (C) Light microscope pictures of the PIO after collection from the wells. (D) Average diameter of each condition calculated at 4 days of culture (n = 100/condition). (E) Representative immunofluorescence stainings of PIO. Islet cells are stained for insulin (red), HUVECs for GFP (green) and hAECs for CK7 (blue). Scale bar = 25 µm. (F) In vitro function assessed by GSIS and represented by the stimulation index (n = 4). All data are expressed as mean ± SEM. *p < 0.01, ***p < 0.001, one-way ANOVA with Dunnett’s multiple comparison test.
FIGURE 3
FIGURE 3
In vivo function of organoids in immunodeficient, diabetic mice. (A) Glycemia level measured over 30 days in NOD‐Rag1 null mice transplanted with 300 NI (n = 13, blue circle) and their equivalent number of PI (n = 9, black diamond) and PIO (n = 14, red square). Mean glucose level was compared at 4, 7, 9, 14, 21 and 30 days by a one-way ANOVA with Dunnett’s multiple comparison test. All data are expressed as mean ± SEM. *p < 0.05, **p < 0.01. (B) Cumulative number of mice reaching normoglycemia over 30 days. Comparison made using the log‐rank (Mantel‐Cox) test, *p < 0.05. (C–D) Glycemia level of each group during the intraperitoneal glucose tolerance test performed at 30 days post-transplantation (C) and their corresponding AUC values (D). Grey triangles represent the non-diabetic control (NDC) group (n = 9). (E) Insulin mRNA expressed by NI, PI and PIO at 30 days post-transplantation; insulin mRNA was analyzed by qPCR, arbitrary units (AU) after normalization to housekeeping genes. Data shown are mean ± SEM, *p < 0.05, one-way ANOVA with Dunnett’s multiple comparison test, n = 3. (F) Insulin concentration measured by ELISA in mice serum at 30 days post-transplantation. All data are expressed as mean ± SEM, one-way ANOVA with Dunnett’s multiple comparison test, n = 2. (G) pdx1, glp-1r, pcsk and pcsk2 expressed in PIO (red columns), PI (black columns) and NI (blue columns) at 30 days after transplantation, data presented as arbitrary units (AU) after normalization to housekeeping genes. Data shown are means ± SEM. *p < 0.05, **p < 0.01, ***p < 0.001 and comparisons were made by a one-way ANOVA with Dunnett’s multiple comparison test, n = 3.
FIGURE 4
FIGURE 4
In vivo revascularization assessment by immunohistological analysis. (A) The blood vessels of the graft detected at day 30 post-transplantation using CD34 (red) and insulin (green) immunostaining. Grafts Scale bar = 50 µm. (B) Quantitative analysis of revascularization was achieved by calculating the number of CD34 positive cells in the insulin positive area and the result was divided by the graft surface area. This was realized in two graft regions per mouse and in 3 mice per group. All data are expressed as mean ± SEM. *p < 0.05, **p < 0.01, comparisons were made by a 2-tail unpaired Student t test. (C) Assessment of vessel functional capacity by mice injection of 100 µl of lectin. Capillaries are labelled in red and endothelial CD34+ cells in green. Scale bar = 50 µm. (D) vegf-a mRNA expression analyzed by qPCR at 30-days post-transplantation in PIO and NI groups; data presented as arbitrary units (AU) after normalization to housekeeping genes. Data shown are expressed as mean ± SEM. ***p < 0.0006, 2-tail unpaired Student t test, n = 3. (E) Recovered grafts stained for VEGF-A at day 30 after transplantation. Scale bars = 100 μm.
FIGURE 5
FIGURE 5
In vivo function of IC + HUVEC spheroids, in immunodeficient, diabetic mice. (A) Mean glucose levels measured in NOD‐Rag1 null mice transplanted with PIO (n = 14, red squares) and IC + HUVEC (n = 6, green inverted triangles). Mean glucose level was compared at 4, 7, 9, 14, 21 and 30 days post-transplantation by a 2-tail unpaired Student t test. All data are expressed as mean ± SEM. *p < 0.05, **p < 0.01. (B,C) Intraperitoneal glucose tolerance test performed at 30 days post-transplantation and their corresponding AUC. Grey triangle represents the non-diabetic control (NDC) group (n = 9). Comparisons were made by a one-way ANOVA with Dunnett’s multiple comparison test. All data are expressed as mean ± SEM. *p < 0.05, **p < 0.01. (D) Graft-bearing EFP recovered at 30 days post-transplantation and stained for GFP (green) and insulin (red). Scale bar = 100 µm. (E) Immunohistological staining for GFP (green), CD34 (red) and DAPI (blue). The yellow color represents the GFP-HUVECs with positive staining of anti-CD34. Arrows indicate chimeric blood vessels. Arrowheads indicate red blood cells. Scale bar for top panel = 100 µm and for the 3 bottom panels, 20 µm.
FIGURE 6
FIGURE 6
Crosstalk between the hAEC, the endothelial cell (EC) and the islet β cell (IC) within the PIO. hAEC enhances revascularization of the PIO in a direct manner by secreting 1) angiogenic factors and 2) vegf that improve EC viability, function, proliferation and blood vessel formation, and 3) by producing ECM-degrading proteases (MMP-1) that facilitate EC migration and sprouting. Additionally, hAECs secrete EGF that 4) upregulates IC pdx1 expression, leading to higher IC survival and proliferation, as well as 5) glp1-r expression, leading to an up-regulation of glycolytic genes and vegf-a through the mTOR/HIF-1a pathway, resulting in 6) an improved insulin secretion and 7) a better revascularization of the PIO.

Similar articles

Cited by

References

    1. Piemonti L, de Koning EJP, Berney T, Odorico JS, Markmann JF, Stock PG, et al. Defining Outcomes for Beta Cell Replacement Therapy: a Work in Progress. Diabetologia (2018) 61(6):1273–6. 10.1007/s00125-018-4588-0 - DOI - PMC - PubMed
    1. Hering BJ, Clarke WR, Bridges ND, Eggerman TL, Alejandro R, Bellin MD, et al. Phase 3 Trial of Transplantation of Human Islets in Type 1 Diabetes Complicated by Severe Hypoglycemia. Dia Care (2016) 39(7):1230–40. 10.2337/dc15-1988 - DOI - PMC - PubMed
    1. Harlan DM, Kenyon NS, Korsgren O, Roep BO. Current Advances and Travails in Islet Transplantation. Diabetes (2009) 58(10):2175–84. 10.2337/db09-0476 - DOI - PMC - PubMed
    1. Aghazadeh Y, Nostro MC. Cell Therapy for Type 1 Diabetes: Current and Future Strategies. Curr Diab Rep (2017) 17(6):37. 10.1007/s11892-017-0863-6 - DOI - PubMed
    1. Khosravi-Maharlooei M, Hajizadeh-Saffar E, Tahamtani Y, Basiri M, Montazeri L, Khalooghi K, et al. THERAPY of ENDOCRINE DISEASE: Islet Transplantation for Type 1 Diabetes: So Close and yet So Far Away. Eur J Endocrinol (2015) 173(5):R165–R183. 10.1530/eje-15-0094 - DOI - PubMed