. 2022 Feb 3:15:801184.
doi: 10.3389/fnins.2021.801184. eCollection 2021.

The Contribution of Anterior Segment Abnormalities to Changes in Intraocular Pressure in the DBA/2J Mouse Model of Glaucoma: DBA/2J- Gpnmb +/SjJ Mice as Critical Controls

Affiliations

The Contribution of Anterior Segment Abnormalities to Changes in Intraocular Pressure in the DBA/2J Mouse Model of Glaucoma: DBA/2J- Gpnmb +/SjJ Mice as Critical Controls

Landon J Rohowetz et al. Front Neurosci. .

Abstract

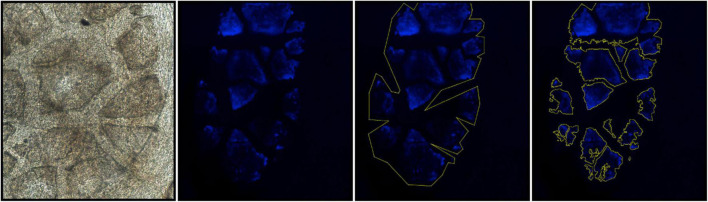
The contributions of anterior segment abnormalities to the development of ocular hypertension was determined in the DBA/2J mouse model of glaucoma. Intraocular pressure (IOP) was measured non-invasively. Iris pigment dispersion (IPD) and corneal calcification were measured weekly starting at 20 weeks of age in DBA/2J and DBA/2J-Gpnmb +/SjJ mice. Thickness, surface area, auto-fluorescence intensity, and perimeter length of calcified regions were measured in postmortem corneas using confocal microscopy. DBA/2J mice developed elevated IOP between 9 and 12 months of age, but DBA/2J-Gpnmb +/SjJ mice did not. Corneal calcification was found at all ages observed and at similar frequencies in both strains with 83.3% of DBA/2J eyes and 60.0% of DBA/2J-Gpnmb +/SjJ eyes affected at 12 months (P = 0.11). Calcification increased with age in both DBA/2J (P = 0.049) and DBA/2J-Gpnmb +/SjJ mice (P = 0.04) when assessed qualitatively and based on mixed-effects analysis. No differences in the four objective measures of calcification were observed between strains or ages. At 12 months of age, DBA/2J mice with corneal calcification had greater mean IOP than DBA/2J mice without corneal calcification. IOP was not correlated with the qualitatively assessed measures of calcification. For the subset of eyes with ocular hypertension, which were only found in DBA/2J mice, IOP was negatively correlated with the qualitative degree of calcification, but was not correlated with the four quantitative measures of calcification. Differences in IOP were not observed between DBA/2J-Gpnmb +/SjJ mice with and without calcification at any age. IPD increased with age and demonstrated a moderate correlation with IOP in DBA/2J mice, but was not observed in DBA/2J-Gpnmb +/SjJ mice. In the DBA/2J mouse model of glaucoma, increased IPD is positively correlated with an increase in IOP and corneal calcification is present in the majority of eyes at and after age 9 months. However, while IPD causes ocular hypertension, corneal calcification does not appear to contribute to the elevation of IOP, as the control strain DBA/2J-Gpnmb +/SjJ exhibits corneal calcification similar to DBA/2J mice, but does not develop ocular hypertension. Corneal calcification, therefore, does not appear to be a contributing factor to the development of elevated IOP in DBA/2J mice.

Keywords: anterior chamber; cornea; corneal calcification; glaucoma; intraocular pressure; iris pigment dispersion; iris stromal atrophy; retina.


Conflict of interest statement

The authors declare that the research was conducted in the absence of any commercial or financial relationships that could be construed as a potential conflict of interest.

Figures

FIGURE 1
FIGURE 1
Qualitative measures of corneal calcification in DBA/2J and DBA/2J-Gpnmb+/SjJ mice. Brightness and contrast have been adjusted to increase visibility of calcifications.
FIGURE 2
FIGURE 2
Quantitative measures of corneal calcification in DBA/2J and DBA/2J-Gpnmb+/SjJ mice. Image-J/FIJI was used to generate maximum intensity projections of corneal autofluorescence. Calcified regions of interest (ROIs) were isolated using Image-J/FIJI thresholding, binary, and outline tools. ROIs were subsequently used to measure thickness, signal intensity, surface area, and perimeter length.
FIGURE 3
FIGURE 3
(A) Line graph illustrating mean intraocular pressure of DBA/2J and DBA/2J-Gpnmb+/SjJ mice by age. Mean intraocular pressure became consistently greater in DBA/2J mice than DBA/2J-Gpnmb+/SjJ at 41 weeks. (B) Column graph demonstrating intraocular pressure between groups and age. Line at 21 mm Hg indicates demarcation between normal tension and ocular hypertension. Mean intraocular pressure of DBA/2J and DBA/2J-Gpnmb+/SjJ mice increased at 12 months from 6 months. Mean intraocular pressure also increased at 9 months from 6 months in the DBA/2J group. *P < 0.05, **P < 0.01, ***P < 0.001, ****P < 0.0001. Error bars represent 95% confidence intervals. Sample sizes for A varied at each time point due to the availability of mice to be measured and ranged from 17 to 60 eyes for each point. Sample sizes for B were, from left to right (60, 60, 38, 40, 20, 17).
FIGURE 4
FIGURE 4
Column graph illustrating IOP in DBA/2J mice and DBA/2J-Gpnmb+/SjJ mice stratified by age and presence of corneal calcification. Line at 21 mm Hg indicates demarcation between normal tension and ocular hypertension. Mean intraocular pressure at 12 months was greater in calcified DBA/2J eyes when compared to non-calcified DBA/2J eyes. No difference in mean IOP was observed between DBA/2J-Gpnmb+/SjJ mice with or without corneal calcification. *P < 0.05. Error bars represent 95% confidence intervals. Sample sizes were, from left to right [(13, 17, 17, 11) (18, 21, 20, 19) (8, 4, 12, 13)].
FIGURE 5
FIGURE 5
(A) Line graph, (B) column graph and (C) photographs illustrating the degree of qualitative corneal calcification in both DBA/2J and DBA/2J-Gpnmb+/SjJ mice euthanized at 12 months. The degree of qualitative calcification increased with age in both DBA/2J and DBA/2J-Gpnmb+/SjJ mice. No differences in qualitative calcification were observed between groups. *P < 0.05, **P < 0.01. Error bars represent 95% confidence intervals. Sample sizes for A varied at each time point due to the availability of mice to be measured and ranged from 18 to 40 eyes for each point. Sample sizes for B were, from left to right [(30, 28),(37, 40),(20, 18)].
FIGURE 6
FIGURE 6
No differences in calcification (A) perimeter length, (B) area, (C) autofluorescence intensity, or (D) thickness were observed between groups or ages in eyes with cornea calcification. Error bars represent 95% confidence intervals. Sample sizes varied at each time point due to the number of mice with calcification. Sample sizes were from left to right A[(4, 8),(8, 7),(12, 15)], B[(2, 6),(7, 5),(12, 12)], C[(4, 8),(8,7),(9, 14)], D[(4, 8),(8, 7),(12, 15)].
FIGURE 7
FIGURE 7
Scatterplot demonstrating (A) no correlation between qualitative calcification and intraocular pressure (r = 0.19) in all eyes of DBA/2J mice and (B) of DBA/2J-Gpnmb+/SjJ mice (r = 0.07). Qualitative calcification and intraocular pressure (r = –0.55, P = 0.03) were negatively correlated in eyes with ocular hypertension (highlighted in red). Sample sizes for each group in A were (6 mo = 28; 9 mo = 66, 12 mo = 18, Hypertensive = 15, All eyes = 86). Sample sizes for each group in B were (6 mo = 30; 9 mo = 38, 12 mo = 20, All eyes = 87).
FIGURE 8
FIGURE 8
Scatterplots for DBA/2J mice demonstrating weak to moderate correlations between (A) intraocular pressure (IOP) and calcification thickness among all eyes (r = 0.42, P = 0.004), (B) IOP and calcification perimeter length among all eyes (r = 0.36, P = 0.01), and (C) IOP and calcification intensity among all eyes (r = 0.39, P = 0.007), but not (D) IOP and calcification area among all eyes (r = 0.25, P = 0.09). Scatterplots for Gpnmb+/SjJ mice demonstrate no relationship between (E) IOP and calcification thickness among all eyes (r = 0.16, P = 0.29), (F) IOP and calcification perimeter length among all eyes (r = 0.01, P = 0.95), (G) IOP and calcification intensity among all eyes (r = 0.26, P = 0.08), and (H) IOP and calcification area among all eyes (r = –0.01, P = 0.93). There were no significant positive correlations when mice in either strain were examined at 6, 9, and 12 months of age and there were no relationships between IOP and quantitative measures of calcification in mice with ocular hypertension. Error bars represent 95% confidence intervals. Sample sizes varied at each time point due to the number of mice with calcification. Sample sizes as in Figure 6.
FIGURE 9
FIGURE 9
Scatterplots demonstrating a moderate correlation between (A) intraocular pressure (IOP) and qualitative iris pigment dispersion (IPD) in DBA/2J mice (r = 0.57, P < 0.001) which (B) increased when only mice with calcification were included in the analysis (r = 0.60, P < 0.001) and (C) was not detected when mice without calcification were excluded from analysis (r = 0.22). There were no significant correlations between IOP and qualitative IPD in mice with ocular hypertension. Error bars represent 95% confidence intervals. Sample sizes varied at each time point due to the number of mice with calcification. Sample sizes as in Figure 6.
FIGURE 10
FIGURE 10
Scatterplots demonstrating weak to moderate correlations between iris pigment dispersion and (A) calcification thickness (r = 0.48, P = 0.004), (B) calcification perimeter (r = 0.47, P = 0.008), (C) calcification intensity (r = 0.34, P = 0.048), and (D) calcification area (r = 0.38, P = 0.03). Error bars represent 95% confidence intervals. Sample sizes varied at each time point due to the number of mice with calcification. Sample sizes as in Figure 6.

Similar articles

Cited by

References

    1. Anderson M. G., Smith R. S., Hawes N. L., Zabaleta A., Chang B., Wiggs J. L., et al. (2002). Mutations in genes encoding melanosomal proteins cause pigmentary glaucoma in DBA/2J mice. Nat. Genet. 30 81–85. 10.1038/ng794 - DOI - PubMed
    1. Bosco A., Anderson S. R., Breen K. T., Romero C. O., Steele M. R., Chiodo V. A., et al. (2018). Complement C3-Targeted gene therapy restricts onset and progression of neurodegeneration in chronic mouse glaucoma. Mol. Ther. 26 2379–2396. 10.1016/j.ymthe.2018.08.017 - DOI - PMC - PubMed
    1. Brandt J. D. (2001). The influence of corneal thickness on the diagnosis and management of glaucoma. J. Glaucoma 10(5 Suppl. 1), S65–S67. 10.1097/00061198-200110001-200110023 - DOI - PubMed
    1. Bricker-Anthony C., Rex T. S. (2015). Neurodegeneration and vision loss after mild blunt trauma in the C57Bl/6 and DBA/2J mouse. PLoS One 10:e0131921. 10.1371/journal.pone.0131921 - DOI - PMC - PubMed
    1. Buchanan R. A., Foley K. E., Pepper K. W., Reagan A. M., Keezer K. J., Hewes A. A., et al. (2019). Meox2 haploinsufficiency accelerates axonal degeneration in DBA/2J glaucoma. Invest. Ophthalmol. Vis. Sci. 60 3283–3296. 10.1167/iovs.18-26126 - DOI - PMC - PubMed

LinkOut - more resources