. 2022 Feb 3:16:836378.
doi: 10.3389/fnins.2022.836378. eCollection 2022.

Cardiovascular Pulsatility Increases in Visual Cortex Before Blood Oxygen Level Dependent Response During Stimulus

Affiliations

Cardiovascular Pulsatility Increases in Visual Cortex Before Blood Oxygen Level Dependent Response During Stimulus

Niko Huotari et al. Front Neurosci. .

Abstract

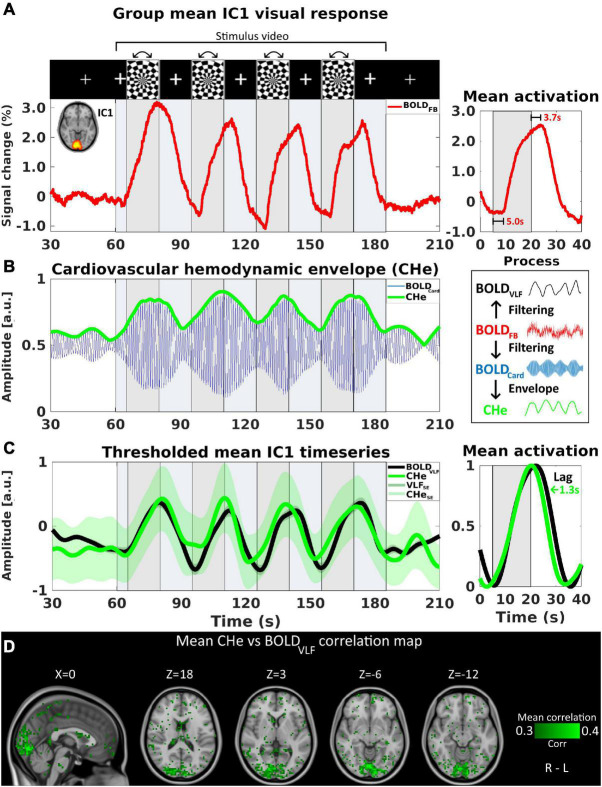
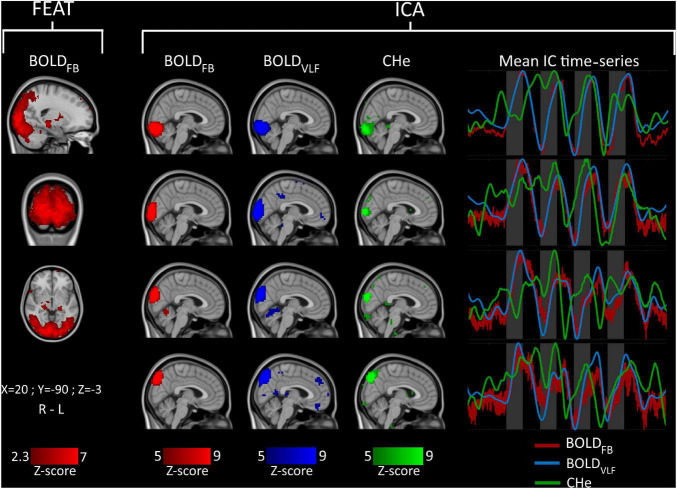
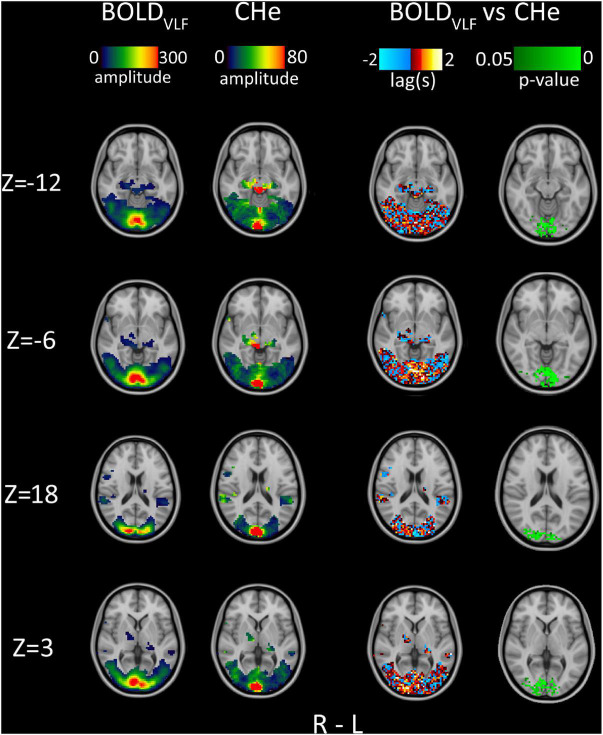
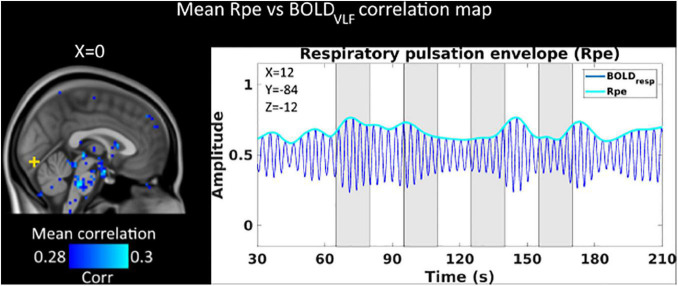
The physiological pulsations that drive tissue fluid homeostasis are not well characterized during brain activation. Therefore, we used fast magnetic resonance encephalography (MREG) fMRI to measure full band (0-5 Hz) blood oxygen level-dependent (BOLDFB) signals during a dynamic visual task in 23 subjects. This revealed brain activity in the very low frequency (BOLDVLF) as well as in cardiac and respiratory bands. The cardiovascular hemodynamic envelope (CHe) signal correlated significantly with the visual BOLDVLF response, considered as an independent signal source in the V1-V2 visual cortices. The CHe preceded the canonical BOLDVLF response by an average of 1.3 (± 2.2) s. Physiologically, the observed CHe signal could mark increased regional cardiovascular pulsatility following vasodilation.

Keywords: cardiovascular pulsations; fast fMRI; magnetic resonance encephalography; task activation; visual stimulation.


Conflict of interest statement

The authors declare that the research was conducted in the absence of any commercial or financial relationships that could be construed as a potential conflict of interest.

Figures

FIGURE 1
FIGURE 1
The cardiovascular hemodynamic envelope (CHe) reflects an increase in cardiovascular pulsation amplitude in V1 visual cortex during rotating checkerboard activation. Activation timing is marked with gray background, and stimulus video duration with light blue color. For (A–D), n = 23. (A) IC1, representing primary visual cortex (V1), group-level mean signal increase of the original full-band signal (BOLDFB). (B) Bandpass filtered cardiac frequency signal, BOLDCard in blue color signal reveals an oscillating cardiovascular pulsation and the envelope signal CHe in green color. (C) Normalized group mean time-series of BOLDVLF response (± SE, black) shown with CHe (± SE, green) representing cardiovascular amplitude with a cross-correlation threshold of at least 0.3. The mean CHe time signal matches with the BOLDVLF time domain signal and on average the CHe preceded the BOLDVLF by 1.3 s. (D) An intra-voxel correlation map between CHe and BOLDVLF voxel signals, with corresponding correlation coefficients color-coded in green.
FIGURE 2
FIGURE 2
Group-level (n = 23) FEAT (left) and independent component (IC) signal source analysis (right). Mean IC time-series of component regions are shown on the right side of the figure in matching colors. Visual stimuli are marked with gray bars.
FIGURE 3
FIGURE 3
Group average (n = 23) amplitude, 1st column: BOLDVLF amplitude map (relative percentage map), 2nd column: CHe amplitude map focusing near the posterior V1 area, in proximity to the draining sagittal sinus. 3rd column: Lag between BOLDVLF and CHe voxel time-series. 4th column: Statistical significance (p < 0.05) of correlation values between BOLDVLF and CHe voxel time-series within visual areas.
FIGURE 4
FIGURE 4
Mean (n = 23) within-voxel correlation map between BOLDVLF and respiratory pulsation envelope (Rpe). We see within-voxel correlations between Rpe and BOLDVLF in detecting respiratory modulations of the BOLD signal near the brainstem respiratory centers. There was no correlation between Rpe and BOLDVLF signal in the activated visual cortex (yellow cross). Visual stimuli are marked with gray.

References

    1. Agrawal U., Brown E. N., Lewis L. D. (2020). Model-based physiological noise removal in fast fMRI. Neuroimage 205:116231. 10.1016/j.neuroimage.2019.116231 - DOI - PMC - PubMed
    1. Akin B., Lee H.-L., Hennig J., LeVan P. (2017). Enhanced subject-specific resting-state network detection and extraction with fast fMRI. Hum. Brain Mapp. 38 817–830. 10.1002/hbm.23420 - DOI - PMC - PubMed
    1. Amemiya S., Takao H., Abe O. (2020). Origin of the Time Lag Phenomenon and the Global Signal in Resting-State fMRI. Front. Neurosci. 14:596084. 10.3389/fnins.2020.596084 - DOI - PMC - PubMed
    1. Assländer J., Zahneisen B., Hugger T., Reisert M., Lee H.-L., LeVan P., et al. (2013). Single shot whole brain imaging using spherical stack of spirals trajectories. Neuroimage 73 59–70. 01.065 10.1016/j.neuroimage.2013 - DOI - PubMed
    1. Bandettini P. A., Wong E. C., Hinks R. S., Tikofsky R. S., Hyde J. S. (1992). Time course EPI of human brain function during task activation. Magn. Reson. Med. 25 390–397. 10.1073/pnas.1608117113 - DOI - PubMed

LinkOut - more resources