. 2022 Feb 2:13:760663.
doi: 10.3389/fnagi.2021.760663. eCollection 2021.

Tract Specific White Matter Lesion Load Affects White Matter Microstructure and Their Relationships With Functional Connectivity and Cognitive Decline

Affiliations

Tract Specific White Matter Lesion Load Affects White Matter Microstructure and Their Relationships With Functional Connectivity and Cognitive Decline

Tae Kim et al. Front Aging Neurosci. .

Abstract

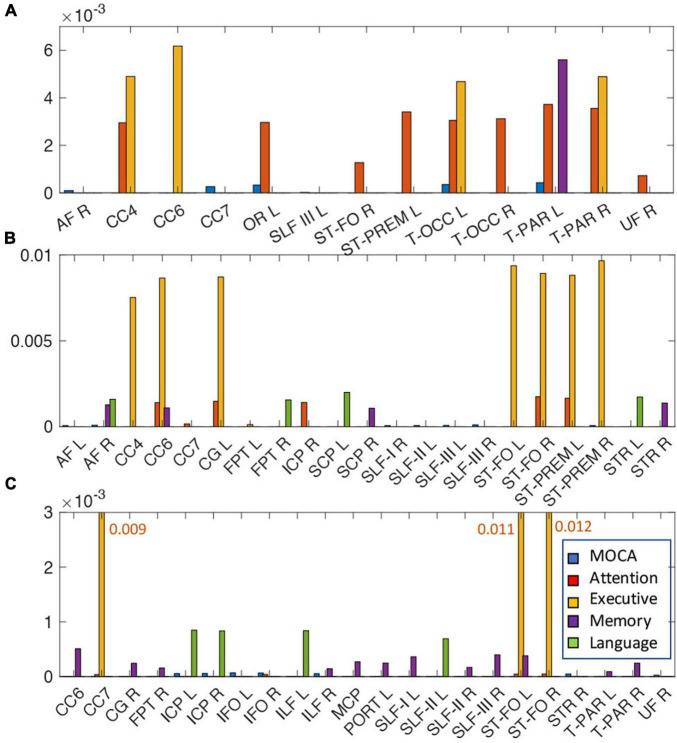
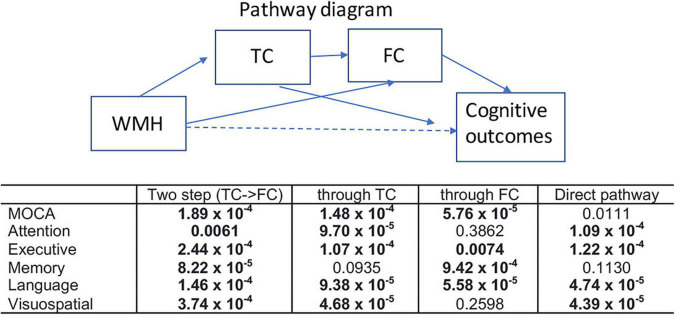
White matter hyperintensities (WMHs) are associated with cognitive decline. Assessing the effect of WMH on WM microstructural changes and its relationships with structural and functional connectivity to multiple cognitive domains are helpful to better understand the pathophysiological processes of cognitive impairment. 65 participants (49 normal and 16 MCI subjects, age: 67.4 ± 8.3 years, 44 females) were studied at 3T. The WMHs and fifty fiber tracts were automatically segmented from the T1/T2-weighted images and diffusion-weighted images, respectively. Tract-profiles of WMH were compared with those of apparent fiber density (AFD). The relationship between AFD and tract connectivity (TC) was assessed. Functional connectivity (FC) between tract ends obtained from resting-state functional MRI was examined in relation to TC. Tract-specific relationships of WMH, TC and FC with a multi-domain neuropsychological test battery and Montreal Cognitive Assessment (MoCA) were also separately assessed by lasso linear regression. Indirect pathways of TC and FC between WMH and multiple cognitive measures were tested using the mediation analysis. Higher WMH loads in WM tracts were locally matched with the reduced AFD, which was related to decrease in TC. However, no direct relationship was found between TC and FC. Tract-specific changes on WMH, TC and FC for each cognitive performance may explain that macro- and microstructural and functional changes are associated differently with each cognitive domain in a fiber specific manner. In these identified tracts, the differences between normal and MCI for WMH and TC were increased, and the relationships of WMH, TC and FC with cognitive outcomes were more significant, compared to the results from all tracts. Indirect pathways of two-step (TC-FC) between WMH and all cognitive domains were significant (p < 0.0083 with Bonferroni correction), while the separated indirect pathways through TC and through FC were different depending on cognitive domain. Deterioration in specific cognitive domains may be affected by alterations in a set of different tracts that are differently associated with macrostructural, microstructural, and function changes. Thus, assessments of WMH and its associated changes on specific tracts help for better understanding of the interrelationships of multiple changes in cognitive impairment.

Keywords: Alzheimer’s disease; aging; cognitive impairment; functional connectivity (FC); white matter fiber tracts; white matter hyperintensity (WMH); white matter lesion (WML).


Conflict of interest statement

The authors declare that the research was conducted in the absence of any commercial or financial relationships that could be construed as a potential conflict of interest.

Figures

FIGURE 1
FIGURE 1
(A) A FLAIR image. (B) WMH was successfully segmented by the automated program. (C) FODs were overlaid on FLAIR with WMH. Altered FODs demonstrated in the WMH regions, compared to similar regions of a subject without WMH (D).
FIGURE 2
FIGURE 2
(A) The segmented fronto-pontine tracts (FPT) are overlaid on T1-weighted images. The tracts are passing through the segmented WMH. Red, Green and Blue represent the x, y, and z diffusion directions, respectively. (B,C) The group-averaged tract-profiles for right (B) and left FPT (C). The AFD tract profiles (upper profiles) of higher-WMH (blue) and MCI-WMH (red) groups are statistically different with those of lower-WMH group (dark green) at the location of WMH in WMH tract profiles (lower profiles: light green color line for lower-WMH, light blue for higher-WMH, and magenta for MCI-WMH groups). Asterisk marks: p < 0.05 (blue for higher-WMH and pink for MCI-WMH groups, compared to lower-WMH group). Left axis (blue): AFD, right axis (red): WMH. Error bars: S.E.M. (D,E) The subtracted AFD profiles (blue lines) calculated by subtracting the lower-WMH group (green lines in B,C) from the higher-WMH group (blue lines in B,C). The subtracted AFD profiles between lower-WMH and MCI-WMH groups show as red lines. In the same way, the subtracted WMH profiles (cyan lines in D,E) were obtained from the lower- (green lines in B,C) and-higher WMH groups (cyan lines in B,C). The magenta lines are subtracted WMH profiles of lower-WMH from those of MCI-WMH groups. (F) The correlation coefficient values were calculated between subtracted AFD and subtracted WMH profiles, and plotted against the amount of WMH difference along the tract (ΔWMH was calculated by subtraction along the WMH profiles between less than 5% (green block on x-axis in D,E) and more than 50% (red block on x-axis in D,E) of the maximum in the profiles). The subtracted WMH profile were well correlated with subtracted AFD profiles at high ΔWMH. The correlation coefficient values were inverted for display purpose.
FIGURE 3
FIGURE 3
(A) The relationship between the amount of WMH on tractometry and normalized mean of AFD tract-profile (correlation coefficient (cc) = −0.41, p < 0.0001). (B) The relationship between normalized mean AFD and TC (cc = 0.50, p < 0.0001). (C) The relationship between TC and FC (cc = 0.12, p < 0.0001). All tracts across subjects are displayed. Each symbol indicates value for each tract of each subject. All 65 subjects are displayed.
FIGURE 4
FIGURE 4
Comparisons between normal and MCI subjects for the amount of WMH volume (A), TC (B), and FC (C) on tract. The graphs on the left were obtained from all tracts, while the graphs on the right were obtained from selected tracts by the lasso linear regression with cognitive measures (see Figure 5). Y-axis: arbitrary unit. Error bars: S.E.M. *p < 0.05.
FIGURE 5
FIGURE 5
The relationships of the amount of WMH volume (A), TC (B), and FC (C) with various cognitive outcomes. The coefficient of WMH, TC, and FC for each cognitive outcome from the lasso linear regression with adjusting age, sex, handedness, diagnosis status and years of education as covariates. Statistically significant tracts are displayed (p < 0.0068). Since each cognitive outcome has different units of measurement, the coefficient of each cognitive outcome was divided by the average value of the cognitive outcome to normalize unit across multiple cognitive outcomes, and converted to absolute value for display purpose. For each cognitive outcome, the color of bar graph is displayed as blue for MOCA, red for attention, yellow for executive, purple for memory, and green for language. No tracts were related with visuospatial function. For FC (C), since the bar graph of the execution function is much larger than that of other functions, it is displayed with a number next to the bar graph. The abbreviations of tract are listed in Supplementary Table 1.
FIGURE 6
FIGURE 6
Results of mediation analysis are summarized for various cognitive outcomes (p-value for each pathway). Mediation analysis was tested for two step indirect path between WMH and each cognitive measure via TC—FC (two step), indirect pathway between WMH and each cognitive measure through TC (through TC), indirect pathway between WMH and each cognitive measure through FC (through FC), and the direct pathway between WMH and each cognition after controlling for the indirect effects. Nuisance variables of age, sex, handedness, years of education, and diagnosis were adjusted. Statistically significance results determined by 20,000 permutations are shown in bold (p < 0.0068).

Similar articles

Cited by

References

    1. Albert M. S. (2011). Changes in cognition. Neurobiol. Aging 32(Suppl. 1) S58–S63. - PMC - PubMed
    1. Batista-García-Ramó K., Fernández-Verdecia C. I. (2018). What we know about the brain structure-function relationship. Behav. Sci. (Basel) 8:39. 10.3390/bs8040039 - DOI - PMC - PubMed
    1. Beckmann C. F., DeLuca M., Devlin J. T., Smith S. M. (2005). Investigations into resting-state connectivity using independent component analysis. Philos. Trans. R. Soc. Lond. B Biol. Sci. 360 1001–1013. 10.1098/rstb.2005.1634 - DOI - PMC - PubMed
    1. Bolandzadeh N., Davis J. C., Tam R., Handy T. C., Liu-Ambrose T. (2012). The association between cognitive function and white matter lesion location in older adults: a systematic review. BMC Neurol. 12:126. 10.1186/1471-2377-12-126 - DOI - PMC - PubMed
    1. Boone K. B., Miller B. L., Lesser I. M., Mehringer C. M., Hill-Gutierrez E., Goldberg M. A., et al. (1992). Neuropsychological correlates of white-matter lesions in healthy elderly subjects, A threshold effect. Arch. Neurol. 49 549–554. 10.1001/archneur.1992.00530290141024 - DOI - PubMed

LinkOut - more resources