. 2022 Feb 3:12:820251.
doi: 10.3389/fphys.2021.820251. eCollection 2021.

Fat Quantification Imaging and Biophysical Modeling for Patient-Specific Forecasting of Microwave Ablation Therapy

Affiliations

Fat Quantification Imaging and Biophysical Modeling for Patient-Specific Forecasting of Microwave Ablation Therapy

Frankangel Servin et al. Front Physiol. .

Abstract

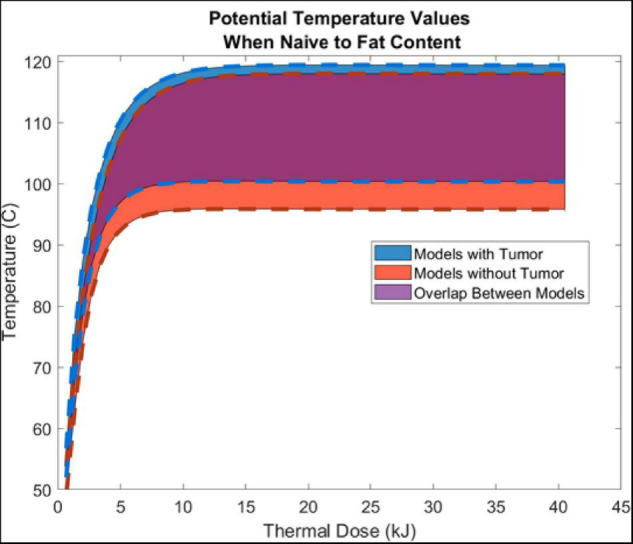
Computational tools are beginning to enable patient-specific surgical planning to localize and prescribe thermal dosing for liver cancer ablation therapy. Tissue-specific factors (e.g., tissue perfusion, material properties, disease state, etc.) have been found to affect ablative therapies, but current thermal dosing guidance practices do not account for these differences. Computational modeling of ablation procedures can integrate these sources of patient specificity to guide therapy planning and delivery. This paper establishes an imaging-data-driven framework for patient-specific biophysical modeling to predict ablation extents in livers with varying fat content in the context of microwave ablation (MWA) therapy. Patient anatomic scans were segmented to develop customized three-dimensional computational biophysical models and mDIXON fat-quantification images were acquired and analyzed to establish fat content and determine biophysical properties. Simulated patient-specific microwave ablations of tumor and healthy tissue were performed at four levels of fatty liver disease. Ablation models with greater fat content demonstrated significantly larger treatment volumes compared to livers with less severe disease states. More specifically, the results indicated an eightfold larger difference in necrotic volumes with fatty livers vs. the effects from the presence of more conductive tumor tissue. Additionally, the evolution of necrotic volume formation as a function of the thermal dose was influenced by the presence of a tumor. Fat quantification imaging showed multi-valued spatially heterogeneous distributions of fat deposition, even within their respective disease classifications (e.g., low, mild, moderate, high-fat). Altogether, the results suggest that clinical fatty liver disease levels can affect MWA, and that fat-quantitative imaging data may improve patient specificity for this treatment modality.

Keywords: computational model; dielectric; fatty liver disease; finite element; hepatocellular carcinoma; liver; microwave ablation; thermal.


Conflict of interest statement

The authors declare that the research was conducted in the absence of any commercial or financial relationships that could be construed as a potential conflict of interest.

Figures

FIGURE 1
FIGURE 1
Analysis overview with (A) mDIXON MR imaging, (B) fat fraction region-of-interest sampling strategy, (C) patient-specific computational models with implanted microwave probe, and (D) realization of 3D MR-Data-driven patient-geometry-/patient-material- specific computational model with simulated microwave ablation.
FIGURE 2
FIGURE 2
Fat quantification imaging of the liver. (A) mDixon water image. (B) mDixon fat fraction images (hyperintensity levels indicating increasing fat fraction).
FIGURE 3
FIGURE 3
(A–D) Fat fraction image segmented with ROIs in patient with low-fat (A), mild-fat (B), moderate-fat (C), and high-fat (D). (E) Histogram of fat-encoded intensity values segmented from mDIXON fat fraction images of 4 patients belonging to different liver-fat disease states (Low, Mild, Moderate, High). Average fat percentages are shown in legend.
FIGURE 4
FIGURE 4
Shows the aggregate average ± SD temperature increase (from all 5 liver-fat configurations) as a function thermal dose (kJ) (Watts⋅s). Temperature data was sampled 5 mm radially from the center of the air slot of the microwave probe (915 MHz probe at 60 W of continuous power for 15 min). Models with tumors are shown in blue, models without a tumor are shown in red, and the overlap between the two are shown in purple.
FIGURE 5
FIGURE 5
Plots show the ablation volume (cm3) as a function of thermal dose (kJ) (Watts⋅s) (915 MHz probe at 60 W of continuous power). Ablation volume captures regions where Arrhenius value ≥ 0.98. Ablation volumes from models without a tumor are shown in dashed lines. Ablation volumes from models with a 2 cm HCC tumor are shown in solid lines. The average clinical thermal dose range is highlighted in light gold (Simo et al., 2013; Yu et al., 2017).
FIGURE 6
FIGURE 6
Ablation of liver tissue (915 MHz probe at 60 W of continuous power for 15 min). Ablation margin outlines area where Arrhenius value (θd) ≥ 0.98. The average ideal liver ablation margins are outlined in a dashed black line and the average high-fat (29.9 % liver fat) ablation margins are outlined in a dashed dotted purple line. (A) Liver models without an HCC tumor. (B) Liver models with a 20 mm diameter HCC tumor.

References

    1. Ahmed M., Liu Z., Humphries S., Goldberg S. N. (2008). Computer modeling of the combined effects of perfusion, electrical conductivity, and thermal conductivity on tissue heating patterns in radiofrequency tumor ablation. Int. J. Hyperther. 24 577–588. 10.1080/02656730802192661 - DOI - PubMed
    1. Alabraba E., Joshi H., Bird N., Griffin R., Sturgess R., Stern N., et al. (2019). Increased multimodality treatment options has improved survival for Hepatocellular carcinoma but poor survival for biliary tract cancers remains unchanged. EJSO 45 1660–1667.i 10.1016/j.ejso.2019.04.002 - DOI - PubMed
    1. Amabile C., Ahmed M., Solbiati L., Meloni M. F., Solbiati M., Cassarino S., et al. (2017). Microwave ablation of primary and secondary liver tumours: ex vivo, in vivo, and clinical characterisation. Int. J. Hyperther. 33 34–42. 10.1080/02656736.2016.1196830 - DOI - PubMed
    1. Anderson B. M., Lin Y. M., Lin E. Y., Cazoulat G., Gupta S., Kyle Jones A., et al. (2021). A novel use of biomechanical model-based deformable image registration (DIR) for assessing colorectal liver metastases ablation outcomes. Med. Phys. 48 6226–6236. 10.1002/mp.15147 - DOI - PMC - PubMed
    1. Brace C. L. (2009). Radiofrequency and microwave ablation of the liver, lung, kidney, and bone: what are the differences? Curr. Problems Diagnostic Radiol. 38 135–143. 10.1067/j.cpradiol.2007.10.001 - DOI - PMC - PubMed

LinkOut - more resources