. 2022 Feb 3:13:817905.
doi: 10.3389/fimmu.2022.817905. eCollection 2022.

Robust and Functional Immune Memory Up to 9 Months After SARS-CoV-2 Infection: A Southeast Asian Longitudinal Cohort

Affiliations

Robust and Functional Immune Memory Up to 9 Months After SARS-CoV-2 Infection: A Southeast Asian Longitudinal Cohort

Hoa Thi My Vo et al. Front Immunol. .

Abstract

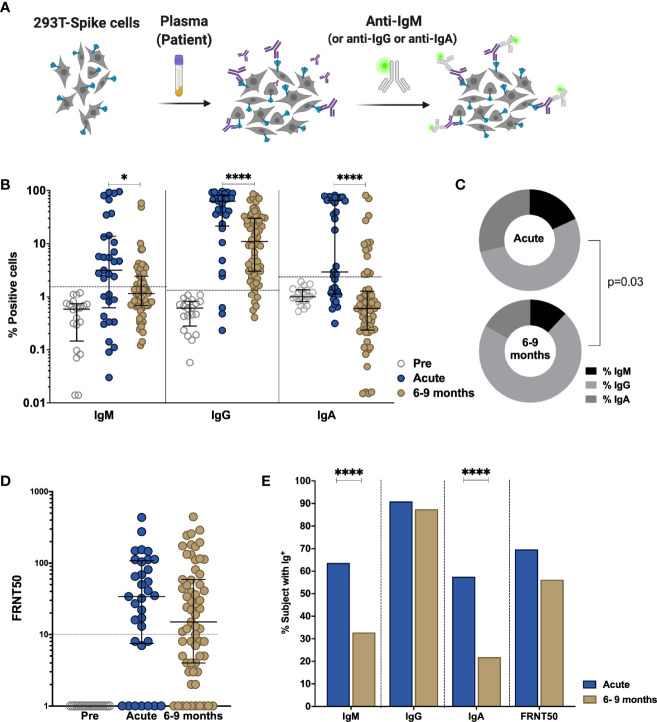
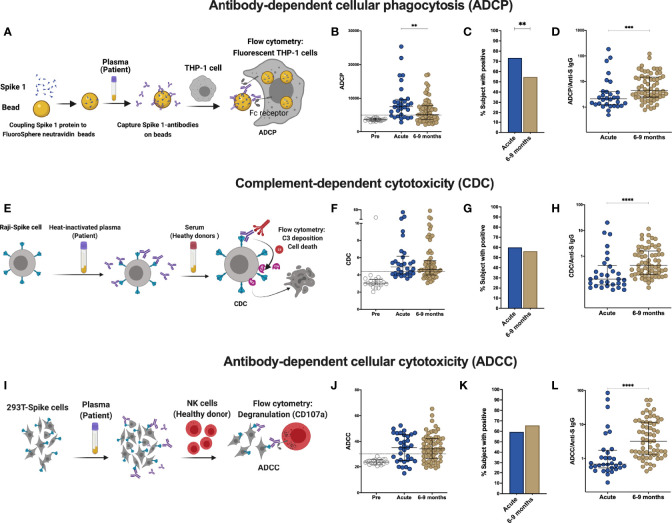
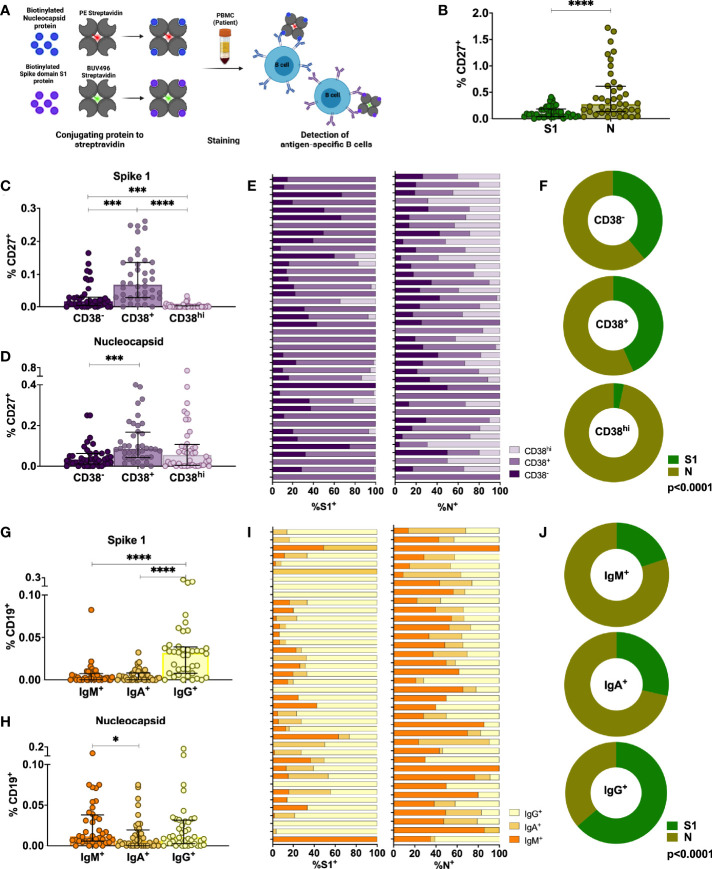
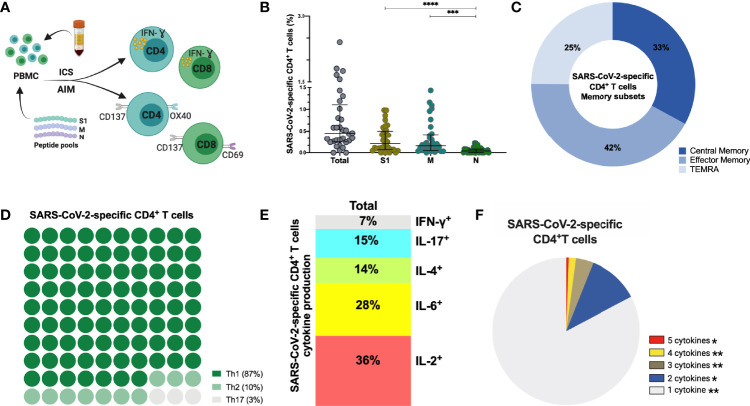
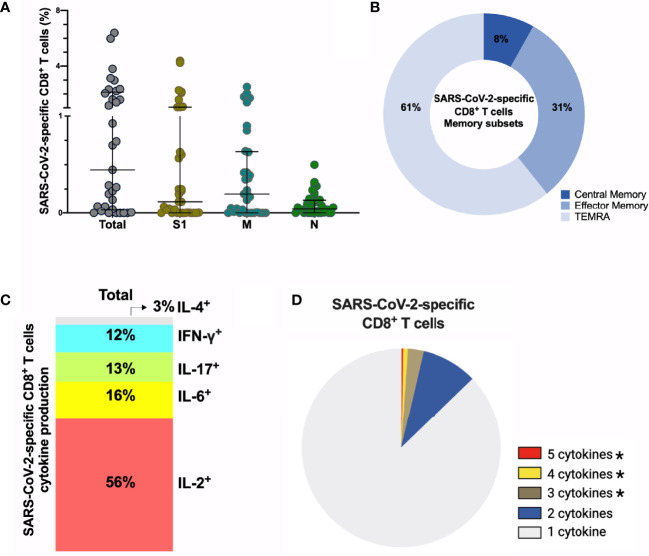
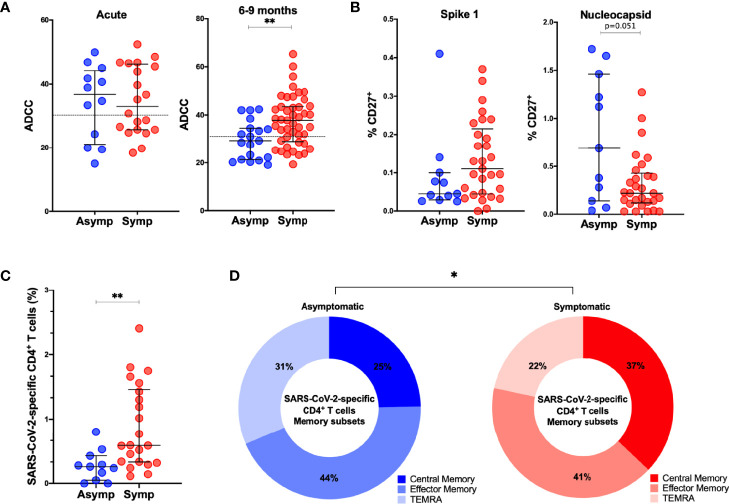
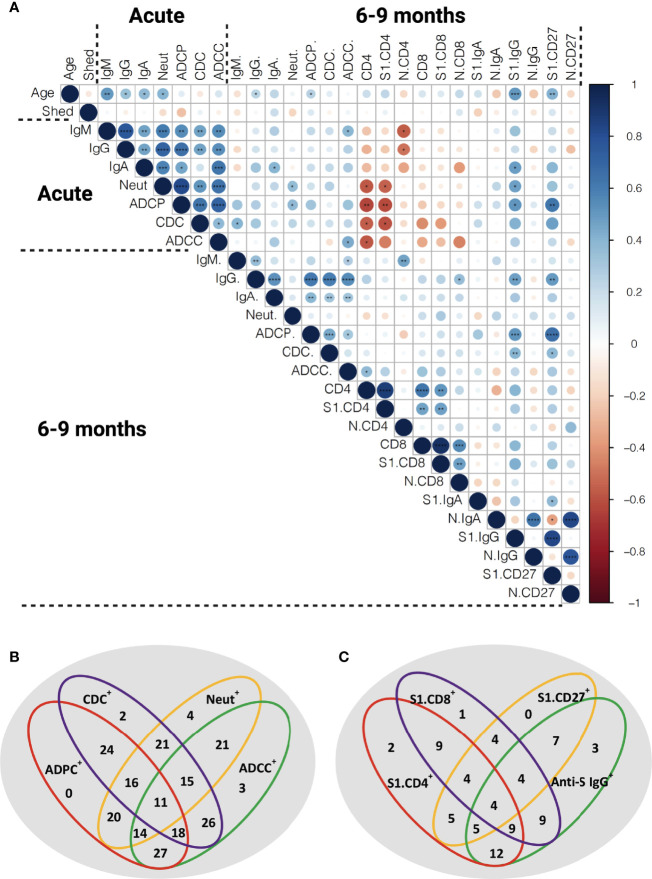
The duration of humoral and cellular immune memory following SARS-CoV-2 infection in populations in least developed countries remains understudied but is key to overcome the current SARS-CoV-2 pandemic. Sixty-four Cambodian individuals with laboratory-confirmed infection with asymptomatic or mild/moderate clinical presentation were evaluated for Spike (S)-binding and neutralizing antibodies and antibody effector functions during acute phase of infection and at 6-9 months follow-up. Antigen-specific B cells, CD4+ and CD8+ T cells were characterized, and T cells were interrogated for functionality at late convalescence. Anti-S antibody titers decreased over time, but effector functions mediated by S-specific antibodies remained stable. S- and nucleocapsid (N)-specific B cells could be detected in late convalescence in the activated memory B cell compartment and are mostly IgG+. CD4+ and CD8+ T cell immune memory was maintained to S and membrane (M) protein. Asymptomatic infection resulted in decreased antibody-dependent cellular cytotoxicity (ADCC) and frequency of SARS-CoV-2-specific CD4+ T cells at late convalescence. Whereas anti-S antibodies correlated with S-specific B cells, there was no correlation between T cell response and humoral immune memory. Hence, all aspects of a protective immune response are maintained up to nine months after SARS-CoV-2 infection and in the absence of re-infection.

Keywords: B cell immunity; SARS-CoV-2; T cell immunity; antibody effector function; long term immune response.


Conflict of interest statement

The authors declare that the research was conducted in the absence of any commercial or financial relationships that could be construed as a potential conflict of interest.

Figures

Figure 1
Figure 1
Comparison of antibody response in SARS-CoV-2-infected individuals during the acute phase and 6-9 months post infection. Non-infected samples obtained before the pandemic (pre), and SARS-Cov-2 infected individuals were sampled 2-9 days post laboratory confirmation and 6-9 months later. (A) Schematic model of the S-Flow assay. (B) Amount of antibodies against spike protein were reported as percentage of spike-expressing 293T cells bound by IgM, IgG, IgA in the S-Flow assay. (C) Pie charts show the proportion of anti-S IgM, IgG and IgA antibodies. (D) SARS-CoV-2 neutralizing activity was calculated as FRNT50 titer in foci reduction neutralization test (FRNT). (E) Comparison of the percentage of individuals positive for anti-S IgM, IgG, IgA and FRNT50. Statistical comparisons were performed by Mann Whitney test (B, D) and Chi-square test (C, E). The dashed line indicates the cutoff for positivity based on values calculated following formula: cut-off = % mean positive cells from 19 pre-pandemic samples + 3x standard deviation. Each dot represents the result from a single individual. Lines represent median and IQR. *p < 0.05 and ****p < 0.0001. Pre-pandemic n=19, acute n=33, 6-9 months n=64.
Figure 2
Figure 2
Comparison of effector function profiles of plasma from SARS-CoV-2-infected individuals during the acute phase and 6-9 months post infection. Non-infected samples obtained before the pandemic (pre), and SARS-Cov-2 infected individuals were sampled 2-9 days post laboratory confirmation and 6-9 months later. (A) Schematic representation of the antibody-dependent cellular phagocytosis (ADCP) assay. (B) Comparison of ADCP activity in pre-pandemic samples, SARS-CoV-2-infected individuals in the acute phase of infection and 6-9 months later. (C) Percentage of individuals with ADCP above the cutoff for positivity. (D) Ratio of ADCP to anti-spike IgG measured by S-Flow. (E) Schematic representation of complement-dependent cytotoxicity (CDC) assay. (F) Comparison of CDC activity in pre-pandemic samples, SARS-CoV-2-infected individuals in the acute phase of infection and 6-9 months later. (G) Percentage of individuals with CDC above the cutoff for positivity. (H) Ratio of CDC to anti-spike IgG as measured by S-Flow. (I) Schematic representation of antibody-dependent cellular cytotoxicity (ADCC). SARS-CoV-2 plasma induced NK degranulation as measured by CD107a staining using spike-expressing 293T cells as target cells. NK cells were isolated from healthy donors. (J) Comparison of ADCC activity in pre-pandemic samples, SARS-CoV-2-infected individuals in the acute phase of infection and 6-9 months later. (K) Percentage of individuals with ADCC above the cutoff for positivity. (L) Ratio of ADCC to anti-spike IgG as measured by S-Flow. Statistical comparisons were performed by Mann Whitney test. The dashed line indicates the cutoff for positivity set based on values calculated following formula: cut-off = % mean positive cells from 19 pre-pandemic samples + 3x standard deviation. Each dot represents result from a single individual. Lines represent median and IQR. **p < 0.01, ***p < 0.001, and ****p < 0.0001. Pre-pandemic: n=19, acute ADCP and CDC: n=30, acute ADCC: n=32, 6-9 months ADCP, CDC and ADCC: n=64.
Figure 3
Figure 3
Characterization of antigen-specific memory B cells in the peripheral blood of individuals infected with SARS-CoV-2 6-9 months after infection. (A) Schematic representation of the memory B cell assay. (B) Comparison of percentages of S1-specific or N-specific memory B cells (CD19+CD27+). (C, D) Percentages of S1- and N-specific B cells among resting memory B cells (CD38-), activated memory B cells (CD38+) or plasmablasts within the CD27+ memory B cell population. (E, F) Proportion of S1-specific and N-specific CD27+CD19+ B cell subsets for each individual and the whole cohort (G, H) Percentages of S1- and N-specific cells in non-class-switched B cells (IgD-IgM+) or class-switched B cells (IgD-IgA+ or IgD-IgG+). (I, J) Proportion of S1-specific and N-specific switched and unswitched CD19+ B cells for each individual and for the whole cohort. Statistical comparisons were performed by Mann-Whitney test (B), Wilcoxon Rank Sum test (C, D, G, H) or Chi-square test (F, J). Each dot represents result from a single individual. Lines represent median and IQR (n=40). *p < 0.05, ***p < 0.001, and ****p < 0.0001. n = 40. S1, subunit 1 of spike protein; N, Nucleocapsid protein.
Figure 4
Figure 4
SARS-CoV-2-specific CD4+ T cells 6-9 months post-infection. (A) Schematic representation of the CD4+ T cell assay (B) Frequency (percentage of CD4+ T cells) of total SARS-CoV-2-specific CD4 + T cells after overnight stimulation with S, M and N peptide pools as assessed by induced expression of OX40 and CD137. Each dot represents result from a single individual (n=33). Lines represent median and IQR. (B) Distribution of SARS-CoV-2–specific CD4 + T cells among central memory, effector memory, and terminally differentiated effector memory cells (TEMRA). (C) Frequencies of SARS-CoV-2-specific CD4+ T helper (Th) subset. (D) Cytokine production and (E) pie chart representing the multifunctional SARS-CoV-2-specific CD4+ T cell response assessed by intracellular cytokine staining after incubation with SARS-CoV-2 peptides compared to unstimulated control, n=8. SARS-CoV-2 specific activation and cytokine production were calculated by subtracted the unstimulated control from the SARS-CoV-2 peptide stimulated condition. Statistical comparisons were performed by Kruskal-Wallis test (B) and Wilcoxon Rank Sum test (F). *p < 0.05, **p < 0.01, ***p < 0.001, ****p < 0.0001. S1, subunit 1 of spike protein; M, membrane protein; N, nucleocapsid protein.
Figure 5
Figure 5
SARS-CoV-2-specific CD8+ T cells 6-9 months post-infection. (A) Frequency (percentage of CD8+ T cells) of total SARS-CoV-2-specific CD8 + T cells after overnight stimulation with S, M and N peptide pools as assessed by induced expression of CD69 and CD137. Each dot represents result of a single individual (n=33). Lines represent median and IQR. (B) Distribution of SARS-CoV-2-specific CD8 + T cells among central memory, effector memory, and terminally differentiated effector memory cells (TEMRA). (C) Cytokine production and (D) pie chart representing the multifunctional CD8 + T of SARS-Cov-2-specific T cells assessed by intracellular cytokine staining after incubation with SARS-CoV-2 peptides compared to unstimulated control, n=8. SARS-CoV-2 specific activation and cytokine production were calculated by subtracted the unstimulated control from the SARS-CoV-2 peptide stimulated condition. (A) Kruskal-Wallis test and (D) Wilcoxon Rank Sum test. *p < 0.05. S1, subunit 1 of spike protein; M, membrane protein; N, nucleocapsid protein.
Figure 6
Figure 6
Comparison of adaptive immune memory in asymptomatic and symptomatic individuals. (A). Comparisons of ADCC activity in asymptomatic (asymp; n=12) versus symptomatic (symp; n=20) individuals in the acute phase and 6-9 months after confirmed infection using 293T-spike cells as target cell. Percentage of CD107a positive cells is measured as readout for ADCC. (B) Comparison of percentages of S1-specific or N-specific memory B cells (CD19+CD27+) between 11 asymptomatic individuals and 29 symptomatic individuals. (C) Frequency (percentage of CD4+ T cells) of total SARS-CoV-2-specific CD4+ T cells after overnight stimulation with peptide pools comparing asymptomatic individuals (asymp; n=11) with symptomatic patients (symp; n=22). (D) Comparison of CD4+ T cell memory phenotype between asymptomatic individuals (asymp; n=11) and symptomatic patients (symp; n=22). Statistical comparisons were performed by (A–C) Mann Whitney tests and (D) Chi-square test for trend *p < 0.05, **p < 0.01.
Figure 7
Figure 7
Correlation of the functional anti-SARS-CoV-2 immune responses. (A) Spearman correlation matrix showing humoral immune memory and effector functions measured in the acute phase and 6-9 months post infection were correlated to each other and to frequencies of antigen-specific B and T cells measured 6-9 months after infection. Red represents a negative correlation between two variables and blue indicates a positive correlation. The size of the dot represents the magnitude of the correlation coefficient. Statistical analysis was performed with spearman correlation test. *p <0.05, **p < 0.01, ***p < 0.001, ****p < 0.001. IgM: anti-S IgM titers, IgG: anti-S IgG titers, IgA: anti-S IgA titers, Neut: FRNT50 titers, CD4: total SARS-CoV-2 specific CD4+ T cells, S1.CD4: S-specific CD4+ T cells, N.CD4: N-specific CD4+ T cells, CD8: total SARS-CoV-2 specific CD8+ T cells, S1.CD8: S-specific CD8+ T cells, N.CD8: N-specific CD8+ T cells, S1.IgA: S1-specific IgD-IgA+ B cells, N.IgA: N-specific IgD-IgA+ B cells, S1. IgG: S1-specific IgD-IgG+ B cells, N.IgG: N-specific IgD-IgG+ B cells, S1.CD27: S1-specific CD27+ B cells, N.CD27: N-specific CD27+ B cells. (B) Venn diagram showing the relation of anti-S humoral immune responses at late convalescence. All individuals with detectable anti-S IgG titers are included (n=56). (C) Venn diagram showing the relation of anti-S IgG, S1-specific CD27+ B cells and S1-specific T cells at late convalescence. The cutoffs for S1-specific CD27+ B cell response and S-specific CD4+ and CD8+ T cell responses were arbitrarily set above 0.1% (n =20).

Similar articles

Cited by

References

    1. Chen N, Zhou M, Dong X, Qu J, Gong F, Han Y, et al. . Epidemiological and Clinical Characteristics of 99 Cases of 2019 Novel Coronavirus Pneumonia in Wuhan, China: A Descriptive Study. Lancet (2020) 395:507–13. doi: 10.1016/S0140-6736(20)30211-7 - DOI - PMC - PubMed
    1. Guan WJ, Ni ZY, Hu Y, Liang WH, Ou CQ, He JX, et al. . Clinical Characteristics of Coronavirus Disease 2019 in China. N Engl J Med (2020) 382:1708–20. doi: 10.1056/NEJMoa2002032 - DOI - PMC - PubMed
    1. Zhu N, Zhang D, Wang W, Li X, Yang B, Song J, et al. . A Novel Coronavirus From Patients With Pneumonia in China, 2019. N Engl J Med (2020) 382:727–33. doi: 10.1056/NEJMoa2001017 - DOI - PMC - PubMed
    1. Dan JM, Mateus J, Kato Y, Hastie KM, Yu ED, Faliti CE, et al. . Immunological Memory to SARS-CoV-2 Assessed for Up to 8 Months After Infection. Science (2021) 371:eabf4063. doi: 10.1126/science.abf4063 - DOI - PMC - PubMed
    1. Hartley GE, Edwards ESJ, Aui PM, Varese N, Stojanovic S, McMahon J, et al. . Rapid Generation of Durable B Cell Memory to SARS-CoV-2 Spike and Nucleocapsid Proteins in COVID-19 and Convalescence. Sci Immunol (2020) 5:e01991-20. doi: 10.1126/sciimmunol.abf8891 - DOI - PMC - PubMed

Publication types

MeSH terms

Substances