. 2022 Feb 4:12:807798.
doi: 10.3389/fpls.2021.807798. eCollection 2021.

Genotypic Variation of Nitrogen Use Efficiency and Amino Acid Metabolism in Barley

Affiliations

Genotypic Variation of Nitrogen Use Efficiency and Amino Acid Metabolism in Barley

Bérengère Decouard et al. Front Plant Sci. .

Erratum in

Abstract

Owing to the large genetic diversity of barley and its resilience under harsh environments, this crop is of great value for agroecological transition and the need for reduction of nitrogen (N) fertilizers inputs. In the present work, we investigated the diversity of a North African barley genotype collection in terms of growth under limiting N (LN) or ample N (HN) supply and in terms of physiological traits including amino acid content in young seedlings. We identified a Moroccan variety, Laanaceur, accumulating five times more lysine in its leaves than the others under both N nutritional regimes. Physiological characterization of the barley collection showed the genetic diversity of barley adaptation strategies to LN and highlighted a genotype x environment interaction. In all genotypes, N limitation resulted in global biomass reduction, an increase in C concentration, and a higher resource allocation to the roots, indicating that this organ undergoes important adaptive metabolic activity. The most important diversity concerned leaf nitrogen use efficiency (LNUE), root nitrogen use efficiency (RNUE), root nitrogen uptake efficiency (RNUpE), and leaf nitrogen uptake efficiency (LNUpE). Using LNUE as a target trait reflecting barley capacity to deal with N limitation, this trait was positively correlated with plant nitrogen uptake efficiency (PNUpE) and RNUpE. Based on the LNUE trait, we determined three classes showing high, moderate, or low tolerance to N limitation. The transcriptomic approach showed that signaling, ionic transport, immunity, and stress response were the major functions affected by N supply. A candidate gene encoding the HvNRT2.10 transporter was commonly up-regulated under LN in the three barley genotypes investigated. Genes encoding key enzymes required for lysine biosynthesis in plants, dihydrodipicolinate synthase (DHPS) and the catabolic enzyme, the bifunctional Lys-ketoglutarate reductase/saccharopine dehydrogenase are up-regulated in Laanaceur and likely account for a hyperaccumulation of lysine in this genotype. Our work provides key physiological markers of North African barley response to low N availability in the early developmental stages.

Keywords: NUE (nitrogen use efficiency); barley; crop/stress physiology; lysine (amino acids); natural variability.


Conflict of interest statement

MA was employed by company TIMAC AGRO International SAS. The remaining authors declare that the research was conducted in the absence of any commercial or financial relationships that could be construed as a potential conflict of interest.

Figures

FIGURE 1
FIGURE 1
Different genotypes by N supply interactions within the barley North African collection. Plants were grown for 14 days under LN or HN then leaves and roots were harvested separately and frozen under liquid nitrogen. The physiological parameters were measured as indicated in the “Materials and Methods” section. Traits displaying GXN interactions are illustrated by different GXN patterns. (A) Total plant N uptake (PNUpE). (B) Leaf dry weight (LDW). (C) Plant nitrogen use efficiency (PNUE). (D) Root nitrogen partitioning (RP%N). Mean values under HN are plotted against mean values under LN. Four independent experiments were performed. Stars indicate a significant difference between LN and HN (Student’s test, 13 ≤ n ≤ 16, p < 0.05). Bars represent SE.
FIGURE 2
FIGURE 2
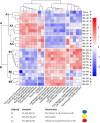
Hierarchical clustering analysis (HCA) showing groups of genotypes sharing similar physiological traits. Plants were grown for 14 days under LN or HN then leaves and roots were harvested separately and frozen under liquid nitrogen. The physiological parameters were measured as indicated in the “Materials and Methods” section. The color scale is based on the value of the normalized mean for each trait. Normalization was made for the LN and HN conditions separately. The clustering under LN was chosen to determine three subgroups (A1, A2, and A3) labeled with the indicated colors. HCA was constructed with the R package.
FIGURE 3
FIGURE 3
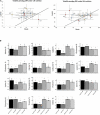
Amino acid distribution in barley leaves and roots under LN and HN. Plants were grown for 14 days under LN or HN then leaves and roots were harvested separately and frozen under liquid nitrogen. Following freezing in liquid nitrogen, AA were quantified by HPLC as indicated in the “Material and Methods.” (A) Comparison of total amino acids levels in leaves were plotted against levels in roots of barley genotypes under LN and HN as indicated. The strait line represents the Y = X curve. Bars represent SE. Stars indicate a significant difference between LN and HN for each barley genotype (Student’s test, 13 ≤ n ≤ 16, p < 0.05). Colors of the dots correspond to the classes defined in Figure 1. (B) Individual amino acid % in the barley collection under LN or HN. Four independent experiments were performed. Stars indicate significant difference between LN and HN (Student’s test, 13 ≤ n ≤ 16, p < 0.05). Bars represent SE.
FIGURE 4
FIGURE 4
Genetic diversity of amino acid composition in barley leaves and roots under LN and HN. Plants were grown for 14 days under LN or HN then leaves and roots were harvested separately and frozen under liquid nitrogen. The following freezing in liquid nitrogen AA was quantified by HPLC as indicated in the Material and methods. (A,B) Hierarchical clustering analysis of the amino acid % under LN or HN in leaves and roots, respectively, showing genotypes sharing similar amino acid profiles. The color scale is based on the value of the normalized mean for each trait. Normalization was made for the LN and HN conditions separately. The colored circles in front of each genotype label represent the above-mentioned group A, B, C in Figure 2. HCA was constructed with the R package. (C) Level of lysine in leaves of each genotype under HN or LN. The different letters indicate values significantly different at P < 0.05 as determined using R-ANOVA Newman–Keuls (SNK) comparisons. (D) Picture showing the senescing phenotype of M4 leaves under LN. An enlargement of the senescing leaf is shown on the right. White scale bar = 5 cm.
FIGURE 5
FIGURE 5
Differentially regulated genes under LN and HN in GP, M4, and M5. Plants were grown for 14 days under LN or HN then leaves were frozen under liquid nitrogen. RNA was extracted from leaves and RNAseq was performed as indicated in “Materials and Methods” section. Upset plot for overlapping up and down differentially expressed genes in M4, M5, and GP barley genotypes under LN or HN. The number of genes in each category is indicated on top of each bar. Functional categories overrepresented in the set of genes are indicated next to the arrows (geneontology.org). Thick arrows indicate up-regulated genes, thin arrows indicate down-regulated genes.
FIGURE 6
FIGURE 6
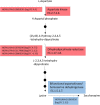
Simplified Lysine biosynthesis and catabolism pathways were found to be differentially expressed in M4 compared to GP and M5. Genes encoding enzymes of these pathways are indicated with their accession numbers in front of the corresponding enzyme. For each gene, the log2 of the fold change (log2FC) corresponds to the expression in M4 compared to the mean of the gene expression level in M5 and GP. Red and blue boxes correspond to biosynthesis and catabolism of lysine, respectively. Black dots represent intermediate enzymatic steps that were omitted for simplification.

References

    1. Abid M., Tian Z., Ata-Ul-Karim S. T., Cui Y., Liu Y., Zahoor R., et al. (2016). Nitrogen nutrition improves the potential of wheat (Triticum aestivum L.) to alleviate the effects of drought stress during vegetative growth periods. Front. Plant Sci. 7:981. 10.3389/fpls.2016.00981 - DOI - PMC - PubMed
    1. Avila-Ospina L., Marmagne A., Talbotec J., Krupinska K., Masclaux-Daubresse C. (2015). The identification of new cytosolic glutamine synthetase and asparagine synthetase genes in barley (Hordeum vulgare L.), and their expression during leaf senescence. J. Exp. Bot. 66, 2013–2026. 10.1093/jxb/erv003 - DOI - PMC - PubMed
    1. Ayachi I., Ghabriche R., Kourouma Y., Ben Naceur M., Abdelly C., Thomine S., et al. (2021). Cd tolerance and accumulation in barley: screening of 36 North African cultivars on Cd-contaminated soil. Environ. Sci. Pollut. Res. 28 42722–42736. 10.1007/s11356-021-13768-y - DOI - PubMed
    1. Backes A., Guerriero G., Ait Barka E., Jacquard C. (2021a). Pyrenophora teres: taxonomy, morphology, interaction with barley, and mode of control. Front. Plant Sci. 12:509. 10.3389/fpls.2021.614951 - DOI - PMC - PubMed
    1. Backes A., Vaillant-Gaveau N., Esmaeel Q., Ait Barka E., Jacquard C. (2021b). A biological agent modulates the physiology of barley infected with Drechslera teres. Sci. Rep. 11:8330. 10.1038/s41598-021-87853-0 - DOI - PMC - PubMed