. 2022 Feb 3:13:811884.
doi: 10.3389/fpls.2022.811884. eCollection 2022.

Comparative Physiology and Transcriptome Analysis of Young Spikes in Response to Late Spring Coldness in Wheat (Triticum aestivum L.)

Affiliations

Comparative Physiology and Transcriptome Analysis of Young Spikes in Response to Late Spring Coldness in Wheat (Triticum aestivum L.)

Gang Jiang et al. Front Plant Sci. .

Abstract

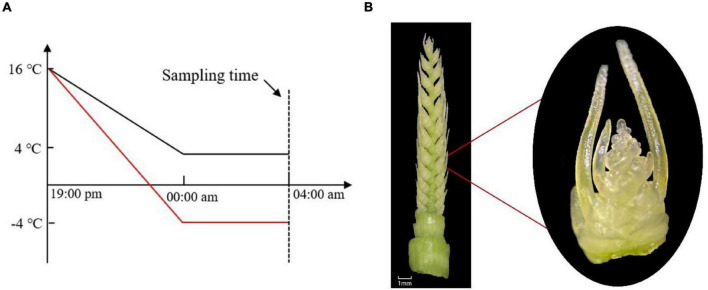
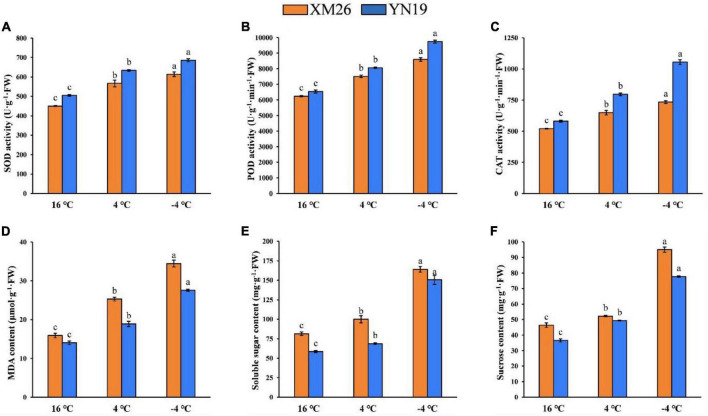
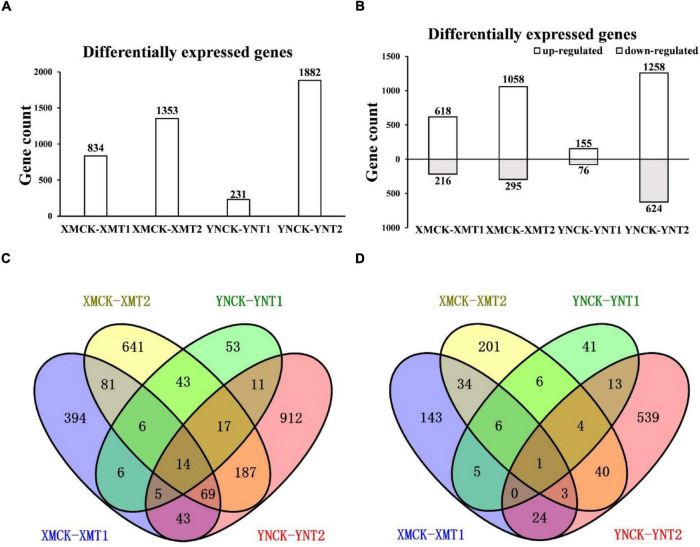
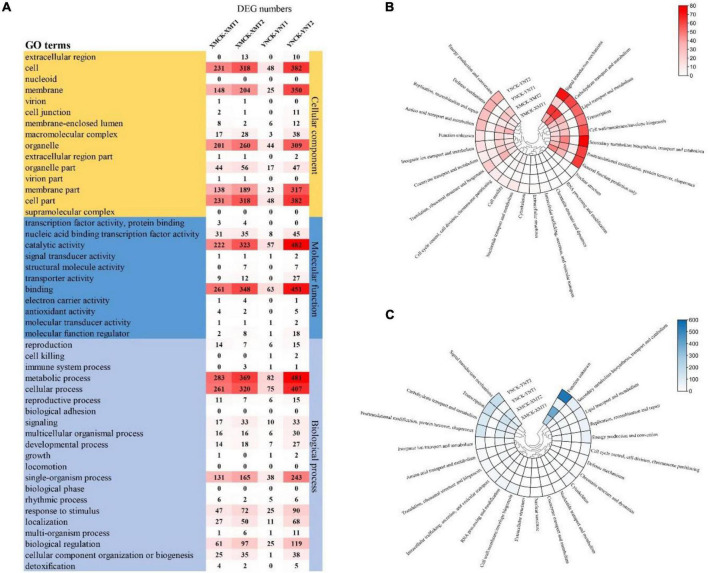
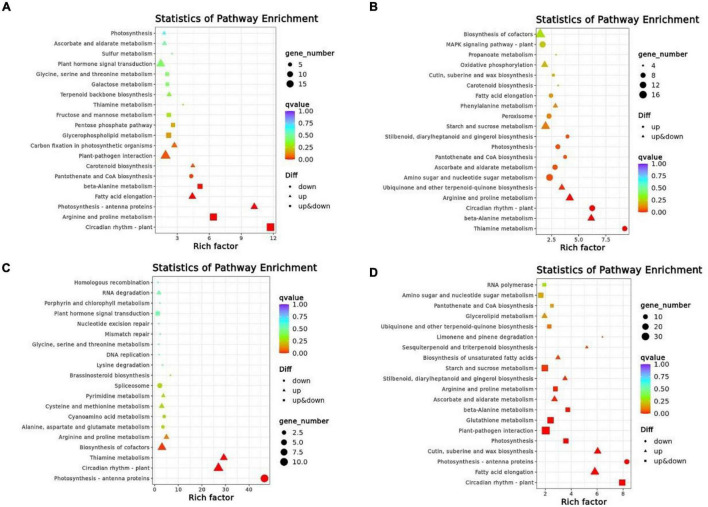
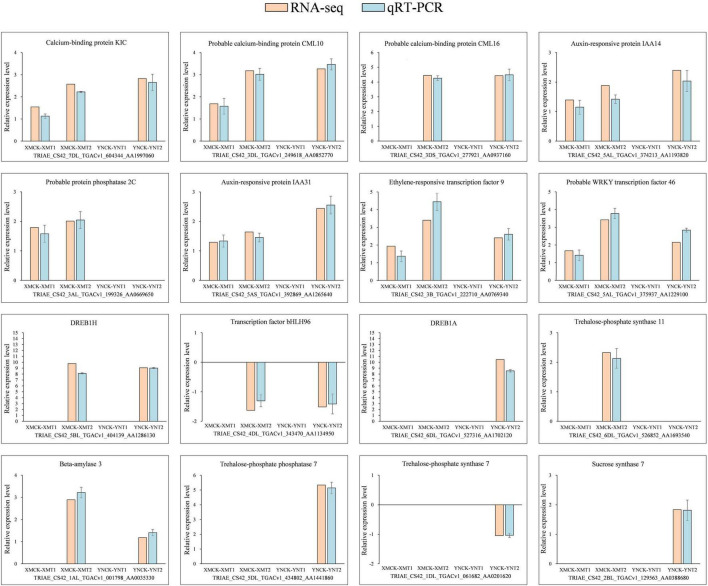
Late spring coldness (LSC) is critical for wheat growth and development in the Huang-Huai valleys of China. However, little is known about the molecular mechanisms for young spikes responding to low temperature (LT) stress during anther connective tissue formation phase (ACFP). To elucidate the molecular mechanisms associated with low temperature, we performed a comparative transcriptome analysis of wheat cultivars Xinmai26 (XM26: cold-sensitive) and Yannong19 (YN19: cold-tolerant) using RNA-seq data. Over 4000 differently expressed genes (DEGs) were identified under low temperature conditions (T1: 4°C) and freezing conditions (T2: -4°C) compared with control (CK: 16°C). The number of DEGs associated with two cultivars at two low temperature treatments (T1: 4°C and T2: -4°C) were 834, 1,353, 231, and 1,882 in four comparison groups (Xinmai26-CK vs. Xinmai26-T1, Xinmai26-CK vs. Xinmai26-T2, Yannong19-CK vs. Yannong19-T1, and Yannong19-CK vs. Yannong19-T2), respectively. Furthermore, to validate the accuracy of RNA-seq, 16 DEGs were analyzed using quantitative real-time RT-PCR. Several transcriptome changes were observed through Kyoto Encyclopedia of Genes and Genomes (KEGG) pathway functional enrichment analysis in plant hormone signal transduction, circadian rhythm-plant, and starch and sucrose metabolism under low temperature. In addition, 126 transcription factors (TFs), including AP2-ERF, bHLH, WRKY, MYB, HSF, and members of the bZIP family, were considered as cold-responsive. It is the first study to investigate DEGs associated with low temperature stress at the transcriptome level in two wheat cultivars with different cold resistance capacities. Most likely, the variations in transcription factors (TFs) regulation, and starch and sucrose metabolism contribute to different cold resistance capacities in the two cultivars. Further, physiological activities of superoxide dismutase (SOD), peroxidase (POD), catalase (CAT) enzymes, malondialdehyde (MDA), soluble sugar (SS), and sucrose contents were evaluated to investigate the negative impacts of low temperature in both cultivars. These findings provide new insight into the molecular mechanisms of plant responses to low temperature and potential candidate genes that required for improving wheat's capacity to withstand low temperature stress.

Keywords: Triticum aestivum L.; anther connective tissue formation phase (ACFP); differentially expressed genes (DEGs); late spring coldness (LSC); physiology and transcriptome.


Conflict of interest statement

The authors declare that the research was conducted in the absence of any commercial or financial relationships that could be construed as a potential conflict of interest.

Figures

FIGURE 1
FIGURE 1
(A) Temperature gradually declined from field conditions (16°C) to target LT (4°C, −4°C) in 5 h, then in the next 4 h, were subjected to LT treatment. (B) Young spike of wheat at the anther connective tissue formation phase (ACFP).
FIGURE 2
FIGURE 2
Physiological indices of Xinmai26 (XM26) and Yannong19 (YN19) under cold stress; (A) Superoxide dismutase (SOD) activity, (B) Peroxidase (POD) activity, (C) Catalase (CAT) activity, (D) malondialdehyde (MDA) content, (E) Soluble sugar content, and (F) Sucrose content. Data mean ± SD (n = 3). Different lowercase letters on the columns indicate significant differences between temperature treatments (P ≤ 0.05).
FIGURE 3
FIGURE 3
(A) The number of DEGs in each comparison group, (B) The number of upregulated and downregulated DEGs in each comparison group, (C) Venn diagram of upregulated DEGs in each comparison group, and (D) Venn diagram of downregulated DEGs in each comparison group. XMCK, Xinmai26 was treated at 16°C; XMT1, Xinmai26 was treated at 4°C for 4 h; XMT2, Xinmai26 was treated at −4°C for 4 h; YNCK, Yannong19 was treated at 16°C; YNT1, Yannong19 was treated at 4°C for 4 h; YNT2, Yannong19 was treated at −4°C for 4 h.
FIGURE 4
FIGURE 4
(A) The number of DEGs for GO terms in each comparison group, (B) Heat map of clustering of the number of DEGs annotated by COG database, and (C) Heat map of clustering of the number of DEGs annotated by eggNOG database. XMCK, Xinmai26 was treated at 16°C; XMT1, Xinmai26 was treated at 4°C for 4 h; XMT2, Xinmai26 was treated at −4°C for 4 h; YNCK, Yannong19 was treated at 16°C; YNT1, Yannong19 was treated at 4°C for 4 h; YNT2, Yannong19 was treated at −4°C for 4 h.
FIGURE 5
FIGURE 5
A scattered plot of the KEGG pathway for DEGs in each of the comparison group [(A) XMCK-XMT1, (B) XMCK-XMT2, (C) YNCK-YNT1, and (D) YNCK-YNT2]. Each circle in the figure represents a KEGG pathway. The ordinate represents the pathway name, and the horizontal axis represents enrichment factor, the ratio of the proportion of differential genes annotated to this pathway relative to the proportion of genes annotated to this pathway in all genes. Enrichment level of DEGs in this pathway is more significant when the enrichment factor is high. The color of the circle represents q-value, which was the P-value corrected by multiple hypothesis testing. DEGs in this pathway have better enrichment significance when the q-value is smaller. Each circle indicates the number of genes enriched in the pathway, and the larger the circle, the more genes. XMCK, Xinmai26 was treated at 16°C; XMT1, Xinmai26 was treated at 4°C for 4 h; XMT2, Xinmai26 was treated at −4°C for 4 h; YNCK, Yannong19 was treated at 16°C; YNT1, Yannong19 was treated at 4°C for 4 h; YNT2, Yannong19 was treated at −4°C for 4 h.
FIGURE 6
FIGURE 6
Expression validation of 16 selected DEGs. The relative expression levels of 16 DEGs were determined using qRT-PCR at 4°C and −4°C. There were 14 upregulated genes and two downregulated genes, with three biological replications and three technical replications for each. Relative expression levels were calculated by log2 2–ΔΔCt method and log2FC (RNA-seq). Here, Y-axis indicates relative expression levels and X-axis indicates each comparison group (XMCK-XMT1, XMCK-XMT2, YNCK-YNT1, YNCK-YNT2). An empty histogram indicates either RNA-seq could not detect the gene under this treatment or its expression level was low by | log2(foldchange)| < 1. XMCK, Xinmai26 was treated at 16°C; XMT1, Xinmai26 was treated at 4°C for 4 h; XMT2, Xinmai26 was treated at −4°C for 4 h; YNCK, Yannong19 was treated at 16°C; YNT1, Yannong19 was treated at 4°C for 4 h; YNT2, Yannong19 was treated at −4°C for 4 h.

References

    1. Aroca R., Porcel R., Ruiz-Lozano J. M. (2012). Regulation of root water uptake under abiotic stress conditions. J. Exp. Bot. 63 43–57. 10.1093/jxb/err266 - DOI - PubMed
    1. Artlip T. S., Wisniewski M. E., Bassett C. L., Norelli J. L. (2013). CBF gene expression in peach leaf and bark tissues is gated by a circadian clock. Tree Physiol. 33 866–877. 10.1093/TREEPHYS/TPT056 - DOI - PubMed
    1. Aslam M., Sugita K., Qin Y., Rahman A. (2020). Aux/iaa14 regulates microrna-mediated cold stress response in Arabidopsis roots. Int. J. Mol. Sci. 21 1–25. 10.3390/IJMS21228441 - DOI - PMC - PubMed
    1. Augspurger C. K. (2013). Reconstructing patterns of temperature, phenology, and frost damage over 124 years: spring damage risk is increasing. Ecology 94 41–50. 10.1890/12-0200.1 - DOI - PubMed
    1. Avonce N., Leyman B., Mascorro-Gallardo J. O., van Dijck P., Thevelein J. M., Iturriaga G. (2004). The Arabidopsis trehalose-6-P synthase AtTPS1 gene is a regulator of glucose, abscisic acid, and stress signaling. Plant Physiol. 136 3649–3659. 10.1104/PP.104.052084 - DOI - PMC - PubMed