. 2022 Feb 2:9:818882.
doi: 10.3389/fmed.2022.818882. eCollection 2022.

B Cell Composition Is Altered After Kidney Transplantation and Transitional B Cells Correlate With SARS-CoV-2 Vaccination Response

Affiliations

B Cell Composition Is Altered After Kidney Transplantation and Transitional B Cells Correlate With SARS-CoV-2 Vaccination Response

Max Schuller et al. Front Med (Lausanne). .

Abstract

Background: The COVID-19 pandemic has major implications on kidney transplant recipients (KTRs) since they show increased mortality due to impaired immune responses to SARS-CoV-2 infection and a reduced efficacy of SARS-CoV-2 vaccination. Surprisingly, dialysis patients have shown superior seroconversion rates after vaccination compared to KTRs. Therefore, we investigated peripheral blood B cell (BC) composition before and after kidney transplantation (KT) and aimed to screen the BC compartment to explain impaired antibody generation.

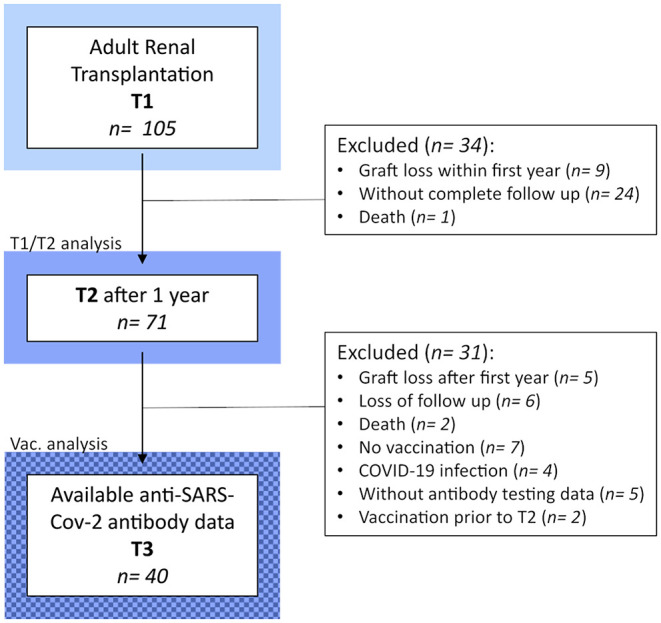
Methods: A total of 105 patients were recruited, and multicolor flow cytometric phenotyping of peripheral venous blood BC subpopulations was performed before and 1 year after KT. Complete follow-up was available for 71 individuals. Anti-SARS-CoV-2 antibodies were collected retrospectively and were available for 40 subjects, who had received two doses of an mRNA-based vaccine (BNT162b2 or mRNA-1273).

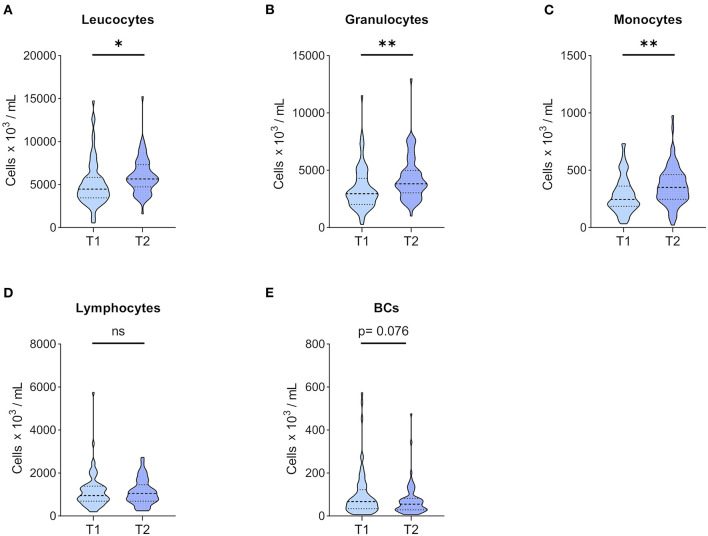
Results: Overall, relative BC frequencies within lymphocytes decreased, and their absolute counts trended in the same direction 1 year after KT as compared to CKD G5 patients. Frequencies and absolute numbers of naïve BCs remained stable. Frequencies of double negative BCs, a heterogeneous subpopulation of antigen experienced BCs lacking CD27 expression, were increased after KT, yet their absolute counts were similar at both time points. Transitional BCs (TrBCs) and plasmablasts were significantly reduced after KT in absolute and relative terms. Memory BCs were affected differently since class-switched and IgM-only subsets decreased after KT, but unswitched and IgD-only memory BCs remained unchanged. CD86+ and CD5+ expression on BCs was downregulated after KT. Correlational analysis revealed that TrBCs were the only subset to correlate with titer levels after SARS-CoV-2 vaccination. Responders showed higher TrBCs, both absolute and relative, than non-responders.

Conclusion: Together, after 1 year, KTRs showed persistent and profound compositional changes within the BC compartment. Low TrBCs, 1 year after KT, may account for the low serological response to SARS-CoV-2 vaccination in KTRs compared to dialysis patients. Our findings need confirmation in further studies as they may guide vaccination strategies.

Keywords: B cells; CKD G5; COVID-19; SARS-CoV-2 vaccination; kidney transplantation.


Conflict of interest statement

Authors VP and BP were employed by CBmed GmbH. The remaining authors declare that the research was conducted in the absence of any commercial or financial relationships that could be construed as a potential conflict of interest.

Figures

Figure 1
Figure 1
Detailed flow chart of the study design and populations.
Figure 2
Figure 2
Leucocytes and major leucocyte subpopulation counts. Whole blood of 71 patients was drawn before KT (T1) and 1 year after KT (T2). After staining for CD45, major CD45+ leucocyte subpopulations were differentiated according to forward and side scatter using flow cytometry, and absolute numbers were obtained using 123count eBeads (Thermo Fisher Scientific). Violin plots of absolute numbers of (A) leucocytes, (B) granulocytes, (C) monocytes, (D) lymphocytes, and (E) BCs are shown at T1 and T2. The heavy dashed line indicates the median, and the light dashed lines mark the IQR. The shapes of the colored areas show the data distributions. Differences between both time points were calculated with Wilcoxon signed-rank test (*p < 0.05; **p < 0.01).
Figure 3
Figure 3
Dynamics of BC subpopulation frequencies before and 1 year after kidney transplantation. PBMCs were analyzed from 71 patients before (T1) and 1 year after KT (T2). Frequencies of (A) naïve BCs, (B) transitional BCs, (C) double-negative (DN) BCs, (D) plasmablasts, (E) IgD-only memory BCs, (F) IgM-only memory BCs, (G) class-switched memory BCs, and (H) unswitched memory BCs in CD19+ lymphocytes are shown as violin plots. Medians are indicated by heavy dashed lines and IQR by light dashed lines, respectively. The distribution of data points is visualized by the plot shape. Wilcoxon signed-rank test was used for comparison between T1 and T2 (***p < 0.001; ****p < 0.0001).
Figure 4
Figure 4
Markers of activation and tolerance in BCs before and 1 year after KT. PBMCs of 71 KTRs before (T1) and 1 year after KT (T2) were stained for CD86, CD27, and CD5. Frequencies of (A) CD86+ and (C) CD27 CD5+ in CD19+ lymphocytes are given. Absolute numbers per milliliter of (B) CD86+ and (D) CD27 CD5+ were calculated from their relative frequency and total BC counts. Median and IQR are marked by heavy and light dashed lines, respectively. The plots shapes indicate the distributions of data points. Comparisons between T1 and T2 were calculated using Wilcoxon-signed rank test (*p < 0.05; ****p < 0.0001).
Figure 5
Figure 5
Impact of MMF dose on blood BC pool 1 year after KT in 71 KTRs. Spearman correlation matrix of MMF dose and (A) frequencies of BC subpopulations and (B) absolute counts of BCs at T2. Correlation coefficients are given for significant correlations only.
Figure 6
Figure 6
Correlations between anti-SARS-CoV2 antibody levels and BC subpopulations 1 year after KT. Spearman correlation matrix of antibody levels and (A) frequencies of BC subpopulations in CD19+ lymphocytes 1 year after KT (T2) and (C) absolute counts of BC subpopulations at T2. Numbers are given for significant correlations only. Mann-Whitney-U Test was used to compare relative TrBC frequency (B) and absolute TrBC numbers (D) between non-responders (NR; n = 20, black circles) and responders (R; n = 20, blue circles). (*p < 0.05).

References

    1. Tonelli M, Wiebe N, Knoll G, Bello A, Browne S, Jadhav D, et al. . Systematic review: kidney transplantation compared with dialysis in clinically relevant outcomes. Am J Transplant. (2011) 11:2093–109. 10.1111/j.1600-6143.2011.03686.x - DOI - PubMed
    1. Marcen R. Immunosuppressive drugs in kidney transplantation: impact on patient survival, and incidence of cardiovascular disease, malignancy and infection. Drugs. (2009) 69:2227–43. 10.2165/11319260-000000000-00000 - DOI - PubMed
    1. Hart A, Smith JM, Skeans MA, Gustafson SK, Wilk AR, Castro S, et al. . OPTN/SRTR 2018 Annual Data Report: Kidney. Am J Transplant. (2020) 20:20–130. 10.1111/ajt.15672 - DOI - PubMed
    1. Schmitz R, Fitch ZW, Schroder PM, Choi AY, Jackson AM, Knechtle SJ, et al. . B cells in transplant tolerance and rejection: friends or foes? Transpl Int. (2020) 33:30–40. 10.1111/tri.13549 - DOI - PMC - PubMed
    1. Karahan GE, Claas FH, Heidt SB. Cell immunity in solid organ transplantation. Front Immunol. (2016) 7:686. 10.3389/fimmu.2016.00686 - DOI - PMC - PubMed