. 2022 Feb 2:9:787423.
doi: 10.3389/fcvm.2022.787423. eCollection 2022.

T-Cell Subpopulations Exhibit Distinct Recruitment Potential, Immunoregulatory Profile and Functional Characteristics in Chagas versus Idiopathic Dilated Cardiomyopathies

Affiliations

T-Cell Subpopulations Exhibit Distinct Recruitment Potential, Immunoregulatory Profile and Functional Characteristics in Chagas versus Idiopathic Dilated Cardiomyopathies

Eula G A Neves et al. Front Cardiovasc Med. .

Abstract

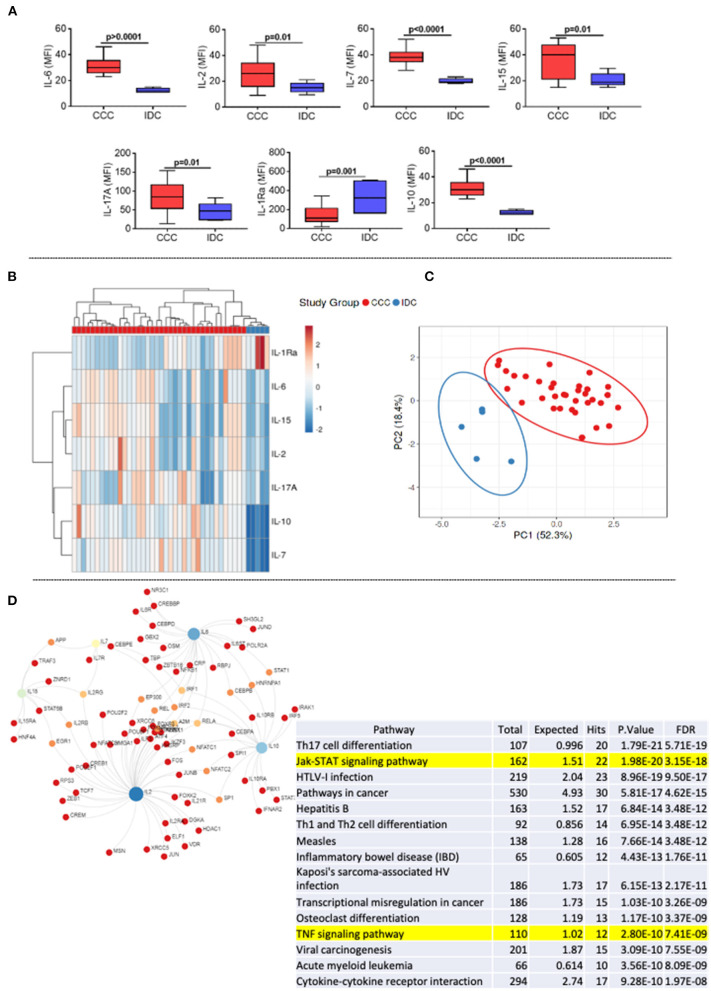
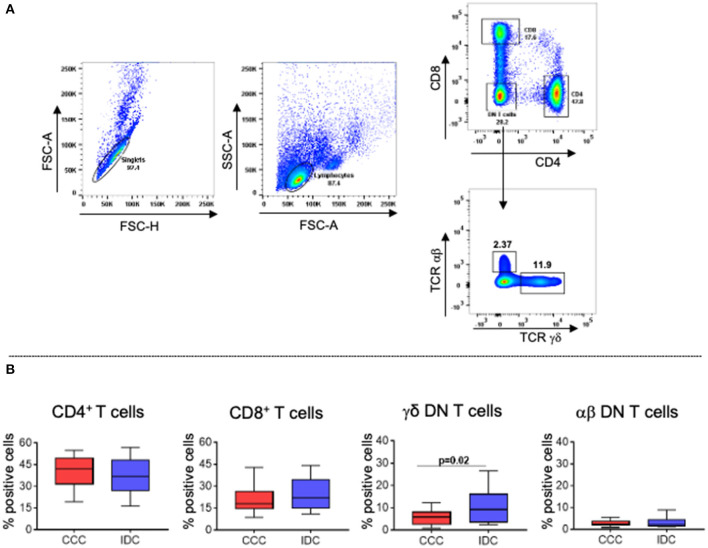
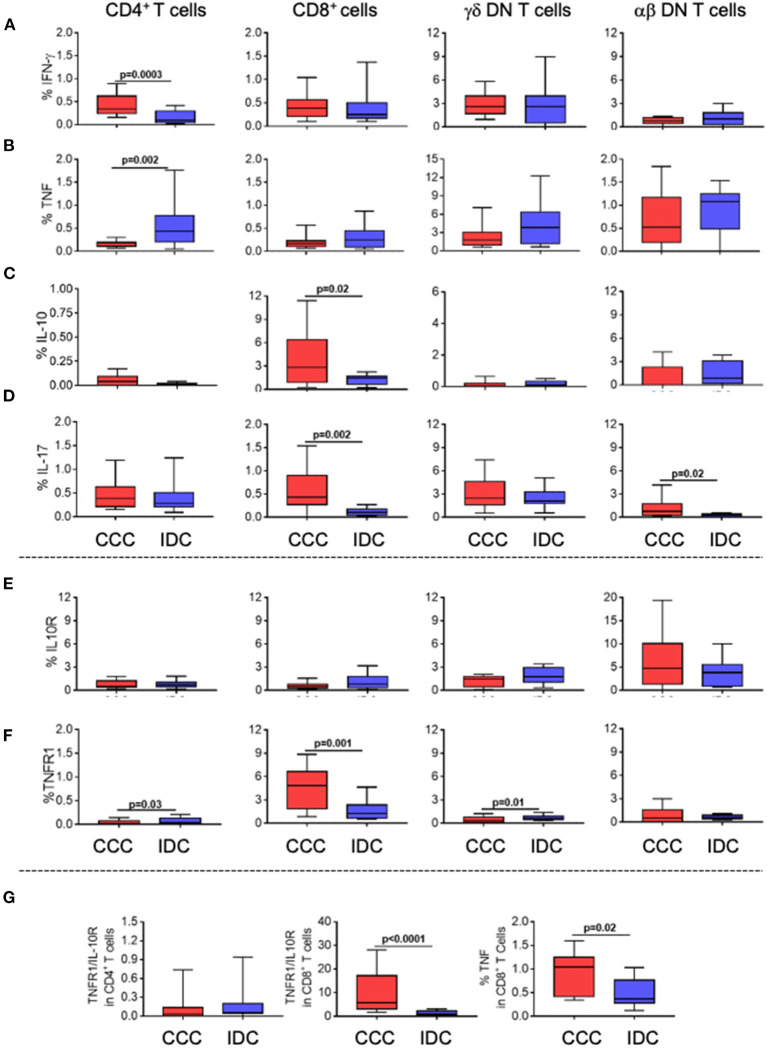
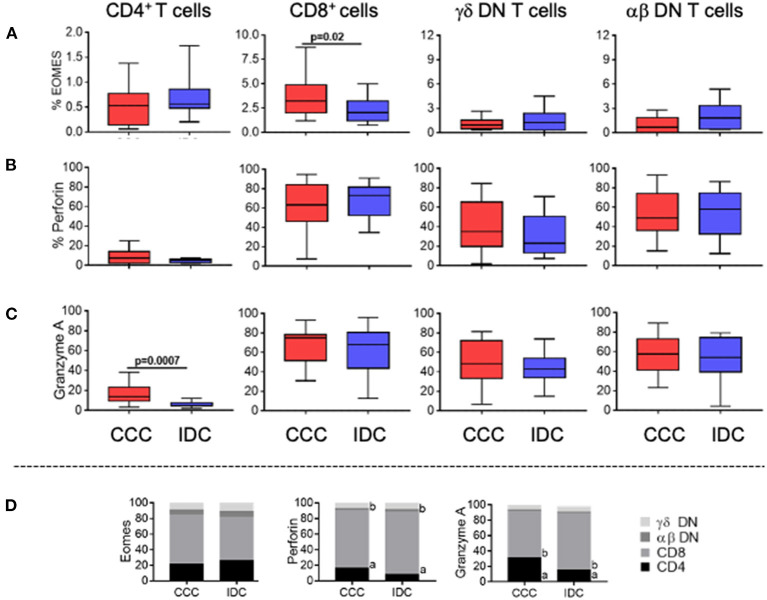
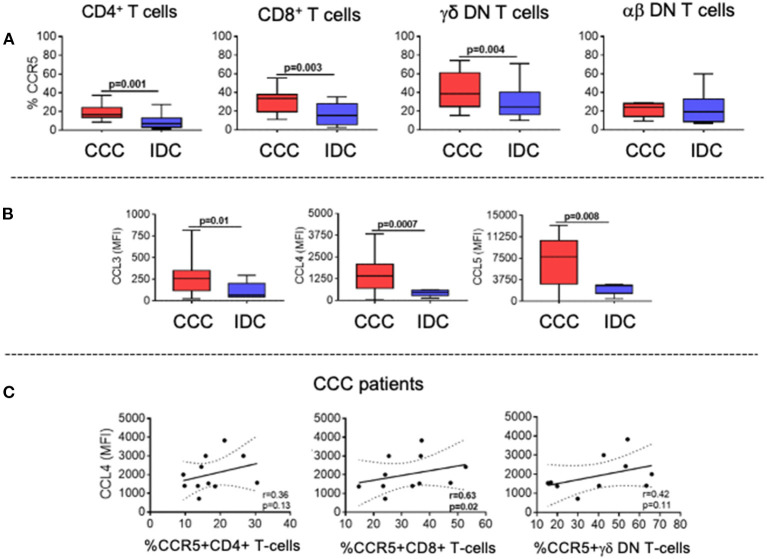
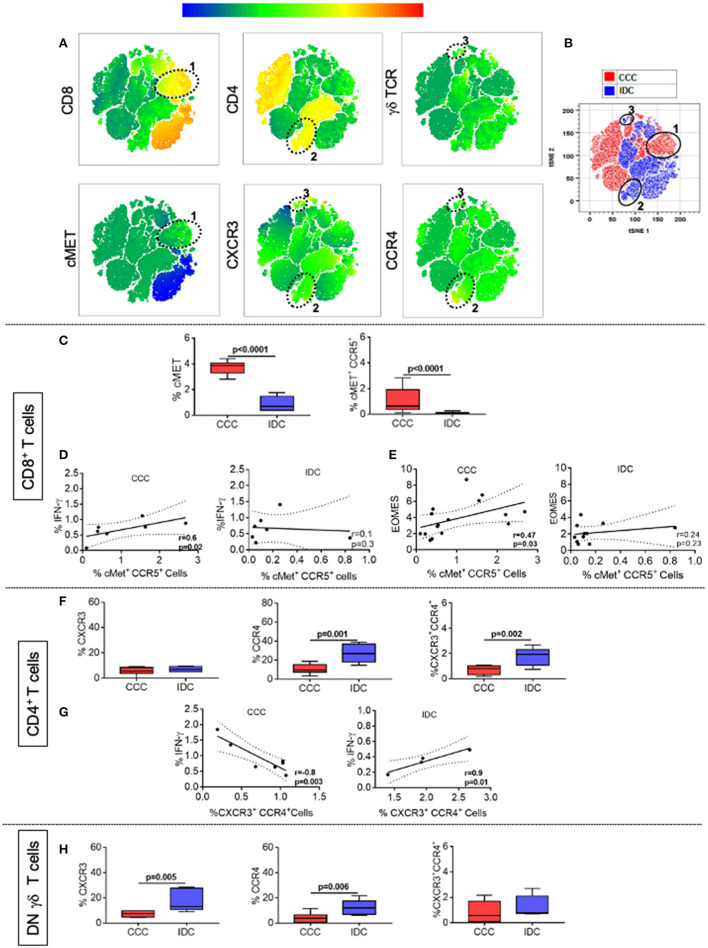
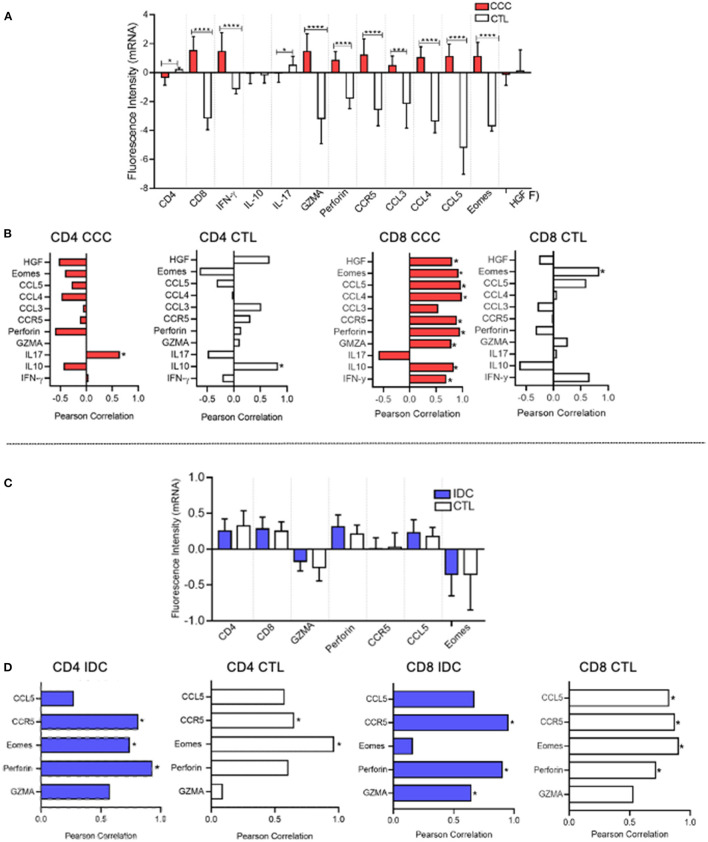
Chronic Chagas cardiomyopathy (CCC) is one of the deadliest cardiomyopathies known and the most severe manifestation of Chagas disease, which is caused by infection with the parasite Trypanosoma cruzi. Idiopathic dilated cardiomyopathies (IDC) are a diverse group of inflammatory heart diseases that affect the myocardium and are clinically similar to CCC, often causing heart failure and death. While T-cells are critical for mediating cardiac pathology in CCC and IDC, the mechanisms underlying T-cell function in these cardiomyopathies are not well-defined. In this study, we sought to investigate the phenotypic and functional characteristics of T-cell subpopulations in CCC and IDC, aiming to clarify whether the inflammatory response is similar or distinct in these cardiomyopathies. We evaluated the expression of systemic cytokines, determined the sources of the different cytokines, the expression of their receptors, of cytotoxic molecules, and of molecules associated with recruitment to the heart by circulating CD4+, CD8+, and CD4-CD8- T-cells from CCC and IDC patients, using multiparameter flow cytometry combined with conventional and unsupervised machine-learning strategies. We also used an in silico approach to identify the expression of genes that code for key molecules related to T-cell function in hearts of patient with CCC and IDC. Our data demonstrated that CCC patients displayed a more robust systemic inflammatory cytokine production as compared to IDC. While CD8+ T-cells were highly activated in CCC as compared to IDC, CD4+ T-cells were more activated in IDC. In addition to differential expression of functional molecules, these cells also displayed distinct expression of molecules associated with recruitment to the heart. In silico analysis of gene transcripts in the cardiac tissue demonstrated a significant correlation between CD8 and inflammatory, cytotoxic and cardiotropic molecules in CCC transcripts, while no correlation with CD4 was observed. A positive correlation was observed between CD4 and perforin transcripts in hearts from IDC but not CCC, as compared to normal tissue. These data show a clearly distinct systemic and local cellular response in CCC and IDC, despite their similar cardiac impairment, which may contribute to identifying specific immunotherapeutic targets in these diseases.

Keywords: Chagas cardiomyopathy; T-cells; chemokines; cytokines; idiopathic cardiomyopathy; inflammation.


Conflict of interest statement

The authors declare that the research was conducted in the absence of any commercial or financial relationships that could be construed as a potential conflict of interest. The reviewer JS declared a shared affiliation with one of the authors AT, to the handling editor at time of review.

Figures

Figure 1
Figure 1
Comparative analysis of plasma cytokines levels between the study groups. (A) Comparative analysis of plasma cytokine levels between patients with Chronic Chagas cardiomyopathy (CCC, n = 38) and Idiopathic cardiomyopathy (IDC, n = 5). Plasma soluble cytokine levels were measured using the Bio-Plex ProTM Human Cytokine Standard 27-plex Kit, and results are expressed in MFI, as described in Materials and Methods. Graphs are expressed as boxplots, with the minimum and maximum values indicated. p-values < 0.05 were considered statically significant and are shown in the Figure. (B) Representative heat map analysis of cytokine plasma levels. Both rows and columns are grouped using correlation distance and mean link. In the color gradient bar, blue indicates lower plasma levels, while red indicates higher levels. Vertical lines represent each sample evaluated, and horizontal lines represent each molecule in the study. (C) Principal component analyses (PCA) between measured cytokines and evaluated study groups; the X and Y axes show % of the total variance. Prediction ellipses indicate with a probability of 0.95 that a new observation will fall within the ellipse. (D) Network and enriched pathway analysis in CCC. Protein-protein network interactions were performed considering the molecules altered in CCC as compared to IDC. Blue and light green represent rub nodes. Different colors distinguish nodes with different numbers of interactions. Bottom table shows a pathway enrichment analysis derived from protein-protein interactions based on Kyoto Encyclopedia of Genes and Genomes (KEGG) algorithm, showing the top 20 hits for CCC with lowest false discovery rates (FDR). T-cell signaling and TNF signaling pathways are highlighted.
Figure 2
Figure 2
Frequency of different T lymphocyte subpopulations in peripheral blood of patients with chronic Chagas cardiomyopathy and idiopathic cardiomyopathy. (A) Representative dot plots of the analysis strategy used in the study: To remove doublets, the parameters FSC-A × FSC-H were used; lymphocytes were selected according to size (FSC-A) and granularity (SSC-A) parameters. For phenotypic separation of cell subpopulations, CD8 and CD4 surface markers were selected, followed by selection of CD4−CD8− cells to identify gamma−delta+ and alpha−beta+ DN T cells. (B) Frequency of CD4+ T cells, CD8+ T cells, gamma−delta+ DN T cells (CCC, n = 17; IDC, n = 13), and alpha−beta+ DN T cells (CCC, n = 10; IDC, n = 10). Graphs are expressed as boxplots, with the minimum and maximum values indicated.
Figure 3
Figure 3
Cellular immune profile of cytokines and immunoregulatory receptors in T-cell subpopulations in different cardiomyopathies. Frequency of expression of cytokines and immunoregulatory receptors (A) IFN-gamma, (B) TNF, (C) IL-10 (D) IL-17 (E) IL-10R, (F) TNF-R1. The analysis was performed as described in the materials and methods for comparison between the different groups in CD4+, CD8+, gamma-delta+ (CCC, n = 17, IDC, n = 13) and alpha-beta+ DN T cells (CCC, n = 10, IDC, n = 10). (G) analysis of the ratio of TNFR1+/IL10R+ cells in CD4+ and CD8+ T cells; TNF expression in CD8+ T cells stimulated with PMA/Ionomycin (CCC, n = 7; IDC, n = 8). Values of p < 0.05 were considered statistically significant. Graphs are expressed as boxplots, with the minimum and maximum values indicated.
Figure 4
Figure 4
Expression of cytotoxic molecules by the different T-cell subpopulations. Frequency of expression of molecules associated with cytotoxic function (A) Eomes, (B) perforin and (C) granzyme A are shown. Graphs are expressed as boxplots, with the minimum and maximum values indicated. (D) Contribution of different cell subpopulations to the expression of different cytotoxic molecules. The analysis was performed as described in the materials and methods for comparison between the different groups in CD4+, CD8+, gamma-delta+ DN T cells (CCC, n = 17, IDC, n = 13) and alpha-beta+ DN T cells (CCC, n = 10, IDC, n = 10). Values of p < 0.05 were considered statistically significant.
Figure 5
Figure 5
Expression of CCR5 by the different T-cell subpopulations and of its soluble chemokine ligands CCL3, CCL4, CCL5. (A) Evaluation of the frequency of expression of CCR5 by CD4+, CD8+, gamma-delta+ DN T cells (CCC, n = 17, IDC, n = 13) and alpha-beta+ DN T cells (CCC, n = 10, IDC, n = 10). The analysis was performed as described in the materials and methods for comparison between the different groups. (B) Plasma levels of soluble chemokines (CCL3, CCL4, CCL5) in samples from patients with Chronic Chagas cardiomyopathy (CCC, n = 38) and idiopathic cardiomyopathy (IDC, n = 5). Graphs are expressed as boxplots, with the minimum and maximum values indicated. (C) Correlation analysis between plasma levels of CCL4 and the frequency of expression of CCR5 in CD4+, CD8+ and gamma-delta+ DN T cells in CCC group. Parametric data were analyzed using Pearson's correlation test and non-parametric data using Spearman's test. Values of p < 0.05 were considered statistically significant.
Figure 6
Figure 6
CCR4 and CXCR3 expression reveals distinct recruitment potential between cardiomyopathies. (A) Representation of t-distributed stochastic neighbor embedding (t-SNE) using the expression density of CD4, CD8, cMET, TCR gamma-delta, CXCR3, and CCR4, with emphasis on clusters 1, 2, and 3 shown by the ellipses. Cluster 1 shows the colocalization between cMET and CD8 expression, while clusters 2 and 3 demonstrate the expression of CXCR3 and CCR4 by CD4+ and gamma-delta+ DN T cells, respectively. (B) tSNE generated showing the stratification between the CCC (red) and IDC (blue) groups after overlaping the islands formed by the algorithm. (C) Frequency (%) of cMET+ and co-expression of cMET+CCR5+ in CD8+ T cells (CCC, n = 17, IDC, n = 13). (D) Correlation analysis between the frequency of CD8+ IFN-gamma+ cells stimulated with PMA/Ionomycin (CCC, n = 7; IDC, n = 8) and CD8+cMET+ CCR5+ cells. (E) Correlation analysis between the frequency of CD8+Eomes+ cells and CD8+cMET+CCR5+ cells. (F) Frequency (%) of CXCR3, CCR4 and co-expression of CXCR3+ CCR4+ in CD4+ T cells (CCC, n = 8; IDC, n = 5). (G) Correlation analysis between the frequency of CD4+ IFN-gamma+ cells stimulated with PMA/Ionomycin (CCC, n = 7, IDC, n = 5) and CD4+ CXCR3+ CCR4+ cells. (H) Frequency of CXCR3, CCR4 and co-expression of CXCR3+ CCR4+ in gamma-delta+ DN T cells (CCC, n = 8; IDC, n = 5). The analysis was performed as described in the materials and methods for comparison between the different groups. Graphs are expressed as boxplots, with the minimum and maximum values indicated. Values of p < 0.05 were considered statistically significant.
Figure 7
Figure 7
In silico analysis shows association between CD8 and CD4 mRNA with cytotoxic molecules in CCC and IDC hearts, respectively. (A) In silico comparative analysis between the expression of gene transcripts of molecules related to the function of CD4+ and CD8+ cells in cardiac tissue samples from patients with chronic Chagas cardiomyopathy (CCC, n = 10) and healthy donors (CTL, n = 7) (B) Correlation analysis between the intensity of CD8 and CD4 mRNA expression and functional molecules associated with inflammatory, regulatory, cytotoxic, and cardiotropic function in the CCC and CTL group. (C) Comparative analysis between the expression of gene transcripts of molecules related to the function of CD4+ and CD8+ cells in cardiac tissue samples from patients with idiopathic cardiomyopathy (IDC, n = 7) and Healthy donors (CTL, n = 8) (D) Correlation analysis between the intensity of CD4 and CD8 mRNA expression and functional molecules associated with inflammatory, regulatory, cytotoxic and cardiotropic function in the IDC and CTL group. Microarray data were available in Expression Omnibus databases for download [GEO- (http://www.ncbi.nlm.nih.gov/geo/)] were downloaded and subjected to statistical analysis by Graphpad Prism 8; Parametric data were analyzed by the test Student's t and non-parametric by Mann–Whitney test. Values of p < 0.05 were considered statistically significant. Pearson's test performed correlation analysis. *p < 0.05, *** and ****p < 0.0001.

References

    1. Roth GA, Mensah GA, Johnson CO, Addolorato G, Ammirati E, Baddour LM, et al. . Global burden of cardiovascular diseases and risk factors, 1990-2019: update from the GBD 2019 study. J Am Coll Cardiol. (2020) 76:2982–3021. 10.1016/j.jacc.2020.11.010 - DOI - PMC - PubMed
    1. Bocchi EA, Bestetti RB, Scanavacca MI, Cunha Neto E, Issa VS. Chronic chagas heart disease management: from etiology to cardiomyopathy treatment. J Am Coll Cardiol. (2017) 70:1510–24. 10.1016/j.jacc.2017.08.004 - DOI - PubMed
    1. Nunes MCP, Beaton A, Acquatella H, Bern C, Bolger AF, Echeverría LE, et al. . Chagas cardiomyopathy: an update of current clinical knowledge and management: a scientific statement from the American Heart Association. Circulation. (2018) 138:e169–209. 10.1161/CIR.0000000000000599 - DOI - PubMed
    1. Rojas LZ, Glisic M, Pletsch-Borba L, Echeverría LE, Bramer WM, Bano A, et al. . Electrocardiographic abnormalities in Chagas disease in the general population: a systematic review and meta-analysis. PLoS Negl Trop Dis. (2018) 12:e0006567. 10.1371/journal.pntd.0006567 - DOI - PMC - PubMed
    1. Torres RM, Correia D, Pereira C, Dutra WO, Talvani A, Sousa AS, et al. . Prognosis of chronic Chagas heart disease and other pending clinical challenges. Mem Inst Oswaldo Cruz. (2021) 116:1–17.10.1590/0074-02760210172 - DOI - PMC - PubMed