. 2022 Feb 4:9:831789.
doi: 10.3389/fcvm.2022.831789. eCollection 2022.

Deciphering Cell-Cell Communication in Abdominal Aortic Aneurysm From Single-Cell RNA Transcriptomic Data

Affiliations

Deciphering Cell-Cell Communication in Abdominal Aortic Aneurysm From Single-Cell RNA Transcriptomic Data

Huan Yang et al. Front Cardiovasc Med. .

Abstract

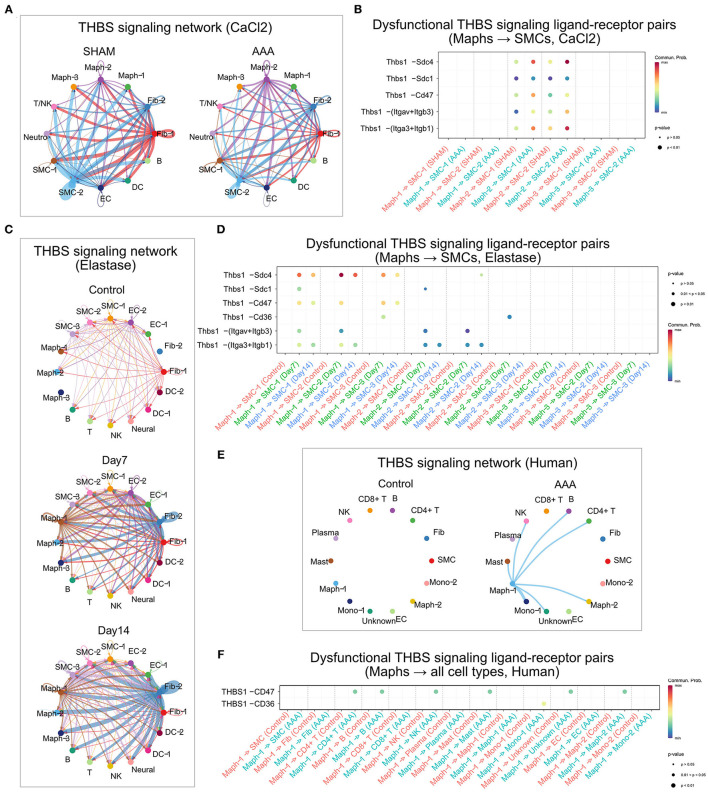
Cell-cell communication coordinates cellular differentiation, tissue homeostasis, and immune responses in states of health and disease. In abdominal aortic aneurysm (AAA), a relatively common and potentially life-threatening vascular disease, intercellular communications between multiple cell types are not fully understood. In this study, we analyzed published single-cell RNA sequencing (scRNA-seq) datasets generated from the murine CaCl2 model, perivascular elastase model, Angiotensin II model, and human AAA using bioinformatic approaches. We inferred the intercellular communication network in each experimental AAA model and human AAA and predicted commonly altered signaling pathways, paying particular attention to thrombospondin (THBS) signaling between different cell populations. Together, our analysis inferred intercellular signaling in AAA based on single-cell transcriptomics. This work provides important insight into cell-cell communications in AAA and has laid the groundwork for future experimental investigations that can elucidate the cell signaling pathways driving AAA.

Keywords: abdominal aortic aneurysm; animal models; cell-cell communication; single-cell RNA sequencing; thrombospondin.


Conflict of interest statement

The authors declare that the research was conducted in the absence of any commercial or financial relationships that could be construed as a potential conflict of interest.

Figures

Figure 1
Figure 1
Inferred intercellular communication network in the murine CaCl2 model. (A) Total interaction strength in sham (NaCl treated) and AAA (CaCl2 treated) groups. (B) Scatter plot of incoming and outgoing interaction strength of each cell population in sham and AAA groups. (C) Heatmap of differential interaction strength in AAA group compared to sham group. The top colored bar plot represents the sum of column of values displayed in the heatmap (incoming signaling). The right colored bar plot represents the sum of row of values (outgoing signaling). In the heatmap, red (or blue) represents increased (or decreased) signaling in AAA compared to sham group. Relative value = the interaction strength from source to target in AAA group – the interaction strength from source to target in sham group. (D) Overall information flow of each signaling pathway in sham and AAA groups. Relative information flow is the ratio of the communication probability of a certain group (sham or AAA group) relative to sham and AAA combined. (E–I) Signaling changes of SMC-1 (E), SMC-2 (F), Maph-1 (G), Maph-2 (H), Maph-3 (I) in AAA compared to sham group.
Figure 2
Figure 2
Inferred intercellular communication network in the murine perivascular elastase model. (A) Total interaction strength in control, Day 7, and 14 groups. (B–D) Scatter plot of incoming and outgoing interaction strength of each cell population in control (B), Day 7 (C), and Day 14 (D) groups. (E,F) Heatmap of differential interaction strength in Day 7 compared to control group (E), and Day 14 compared to control group (F). The top colored bar plot represents the sum of column of values displayed in the heatmap (incoming signaling). The right colored bar plot represents the sum of row of values (outgoing signaling). In the heatmap, red (or blue) represents increased (or decreased) signaling in Day 7 (E) or Day 14 (F) compared to control group. Relative value = the interaction strength from source to target in Day 7 (E) or Day 14 (F) group—the interaction strength from source to target in control group. (G) Overall information flow of each signaling pathway in control, Day 7, and 14 groups. Relative information flow is the ratio of the communication probability of a certain group (control, Day 7, or Day 14) relative to all groups combined. (H) Signaling changes of SMC and macrophage populations in Day 7 compared to control group.
Figure 3
Figure 3
Inferred intercellular communication network in the murine Angiotensin II infusion model. (A) Scatter plot of incoming and outgoing interaction strength of each cell population in Angiotensin II group. (B) Outgoing and incoming signal strength of each signaling pathway in each cell population in Angiotensin II group.
Figure 4
Figure 4
Inferred intercellular communication network in human AAA tissues. (A) Total interaction strength in control and AAA samples. (B,C) Scatter plot of incoming and outgoing interaction strength of each cell population in control (B) and AAA (C) groups. (D) Heatmap of differential interaction strength in AAA compared to control group. The top colored bar plot represents the sum of column of values displayed in the heatmap (incoming signaling). The right colored bar plot represents the sum of row of values (outgoing signaling). In the heatmap, red (or blue) represents increased (or decreased) signaling in AAA compared to control group. Relative value = the interaction strength from source to target in AAA group – the interaction strength from source to target in control group. (E) Overall information flow of each signaling pathway in control and AAA groups. Relative information flow is the ratio of the communication probability of a certain group (control or AAA group) relative to control and AAA combined. (F) Signaling changes of different cell populations in AAA compared to control group.
Figure 5
Figure 5
Altered signaling in murine and human AAA. (A) Venn diagram and bar graph of the numbers of altered signaling pathways in the murine CaCl2 model (CaCl2 treated compared to sham group), elastase model (Day 7 group compared to control group and Day 14 group compared to control group), and human AAA samples (AAA compared to control group). (B,C) Venn network of upregulated (B) or downregulated (C) signaling pathways in the murine CaCl2 model, elastase model, and human AAA samples.
Figure 6
Figure 6
THBS signaling in murine and human AAA. (A,C,E) Circle plot of THBS signaling network in the murine CaCl2 model (A), elastase model (C), or human AAA (E). The edge colors are consistent with the signal sender, and edge weights are proportional to the interaction strength. Thicker edge line indicates a stronger signal. (B,D,F) Bubble plot of the communication probability of all the significant ligand-receptor pairs that contributed to THBS signaling sent from macrophages to SMCs in the murine CaCl2 model (B) or elastase model (D), and from Maph-1 to each cell population in human AAA (F). The dot color and size represent the communication probability and p-values, respectively. p-values were computed from one-sided permutation test.

References

    1. Chaikof EL, Dalman RL, Eskandari MK, Jackson BM, Lee WA, Mansour MA, et al. . The Society for Vascular Surgery practice guidelines on the care of patients with an abdominal aortic aneurysm. J Vasc Surg. (2018) 67:2–77.e72. 10.1016/j.jvs.2017.10.044 - DOI - PubMed
    1. Quintana RA, Taylor WR. Cellular mechanisms of aortic aneurysm formation. Circ Res. (2019) 124:607–18. 10.1161/CIRCRESAHA.118.313187 - DOI - PMC - PubMed
    1. Hadi T, Boytard L, Silvestro M, Alebrahim D, Jacob S, Feinstein J, et al. . Macrophage-derived netrin-1 promotes abdominal aortic aneurysm formation by activating MMP3 in vascular smooth muscle cells. Nat Commun. (2018) 9:5022. 10.1038/s41467-018-07495-1 - DOI - PMC - PubMed
    1. Salmon M, Johnston WF, Woo A, Pope NH, Su G, Upchurch GRJr, et al. . KLF4 regulates abdominal aortic aneurysm morphology and deletion attenuates aneurysm formation. Circulation. (2013) 128:S163–174. 10.1161/CIRCULATIONAHA.112.000238 - DOI - PMC - PubMed
    1. Li G, Qin L, Wang L, Li X, Caulk AW, Zhang J, et al. . Inhibition of the mTOR pathway in abdominal aortic aneurysm: implications of smooth muscle cell contractile phenotype, inflammation, and aneurysm expansion. Am J Physiol Heart Circ Physiol. (2017) 312:H1110–9. 10.1152/ajpheart.00677.2016 - DOI - PubMed