. 2021 Sep;1(9):838-849.
doi: 10.1038/s43587-021-00104-9. Epub 2021 Sep 14.

Evidence for accelerated aging in mammary epithelia of women carrying germline BRCA1 or BRCA2 mutations

Affiliations

Evidence for accelerated aging in mammary epithelia of women carrying germline BRCA1 or BRCA2 mutations

Sundus F Shalabi et al. Nat Aging. 2021 Sep.

Abstract

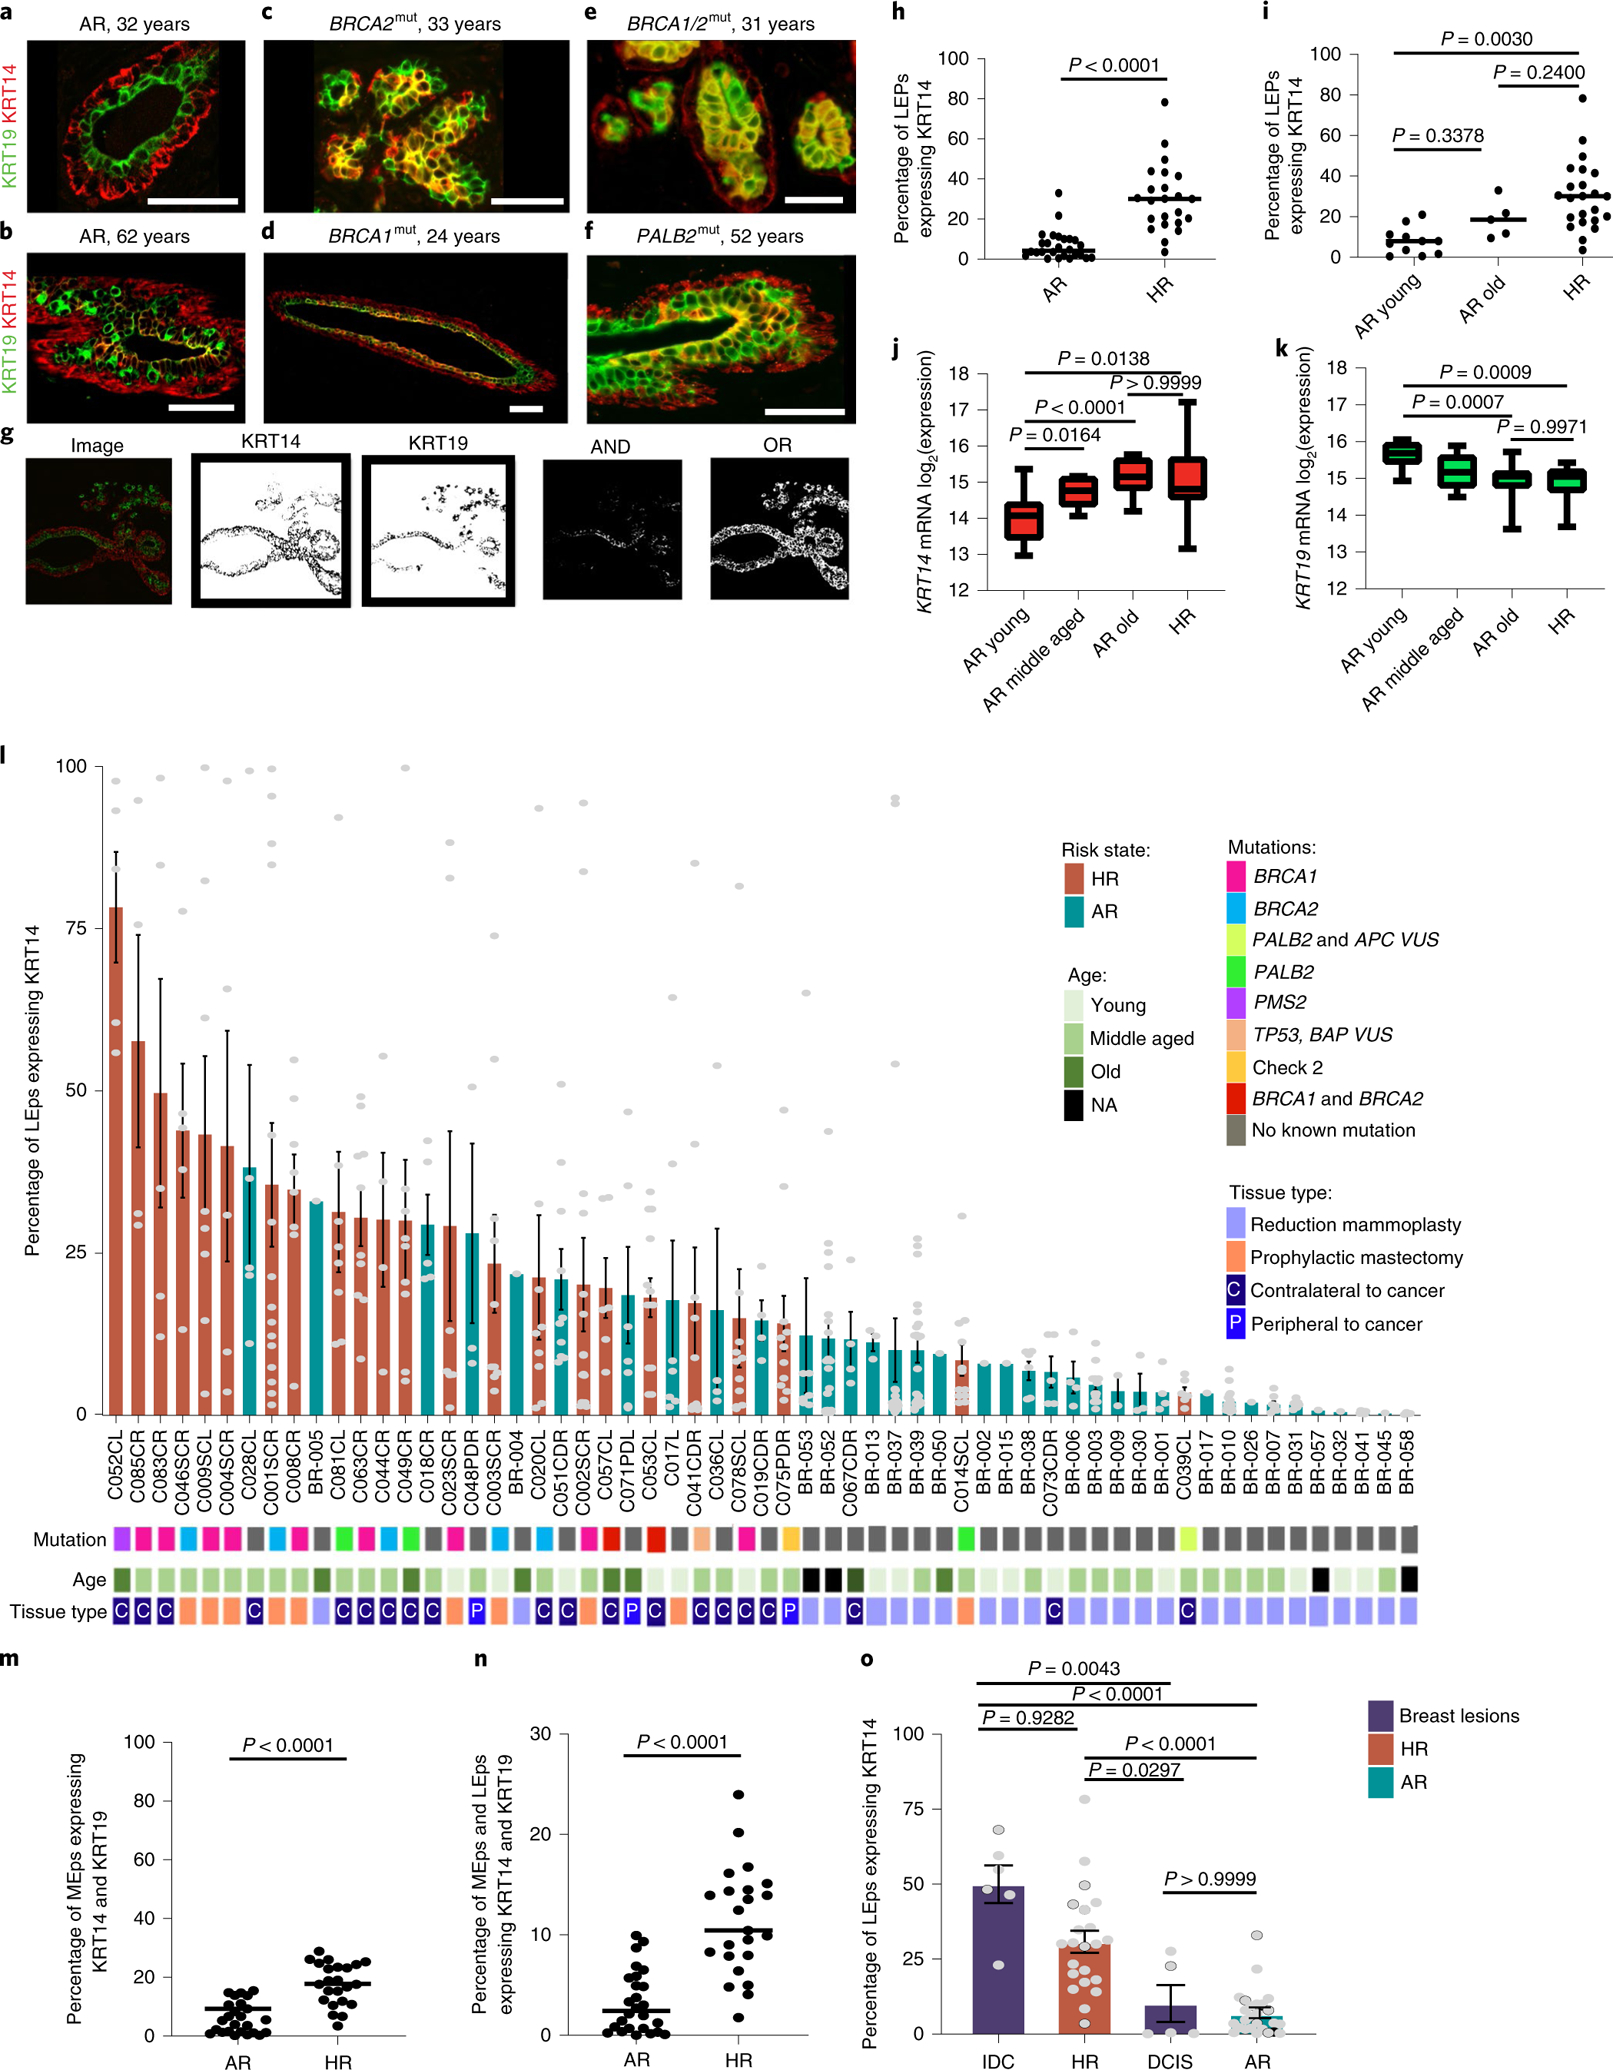
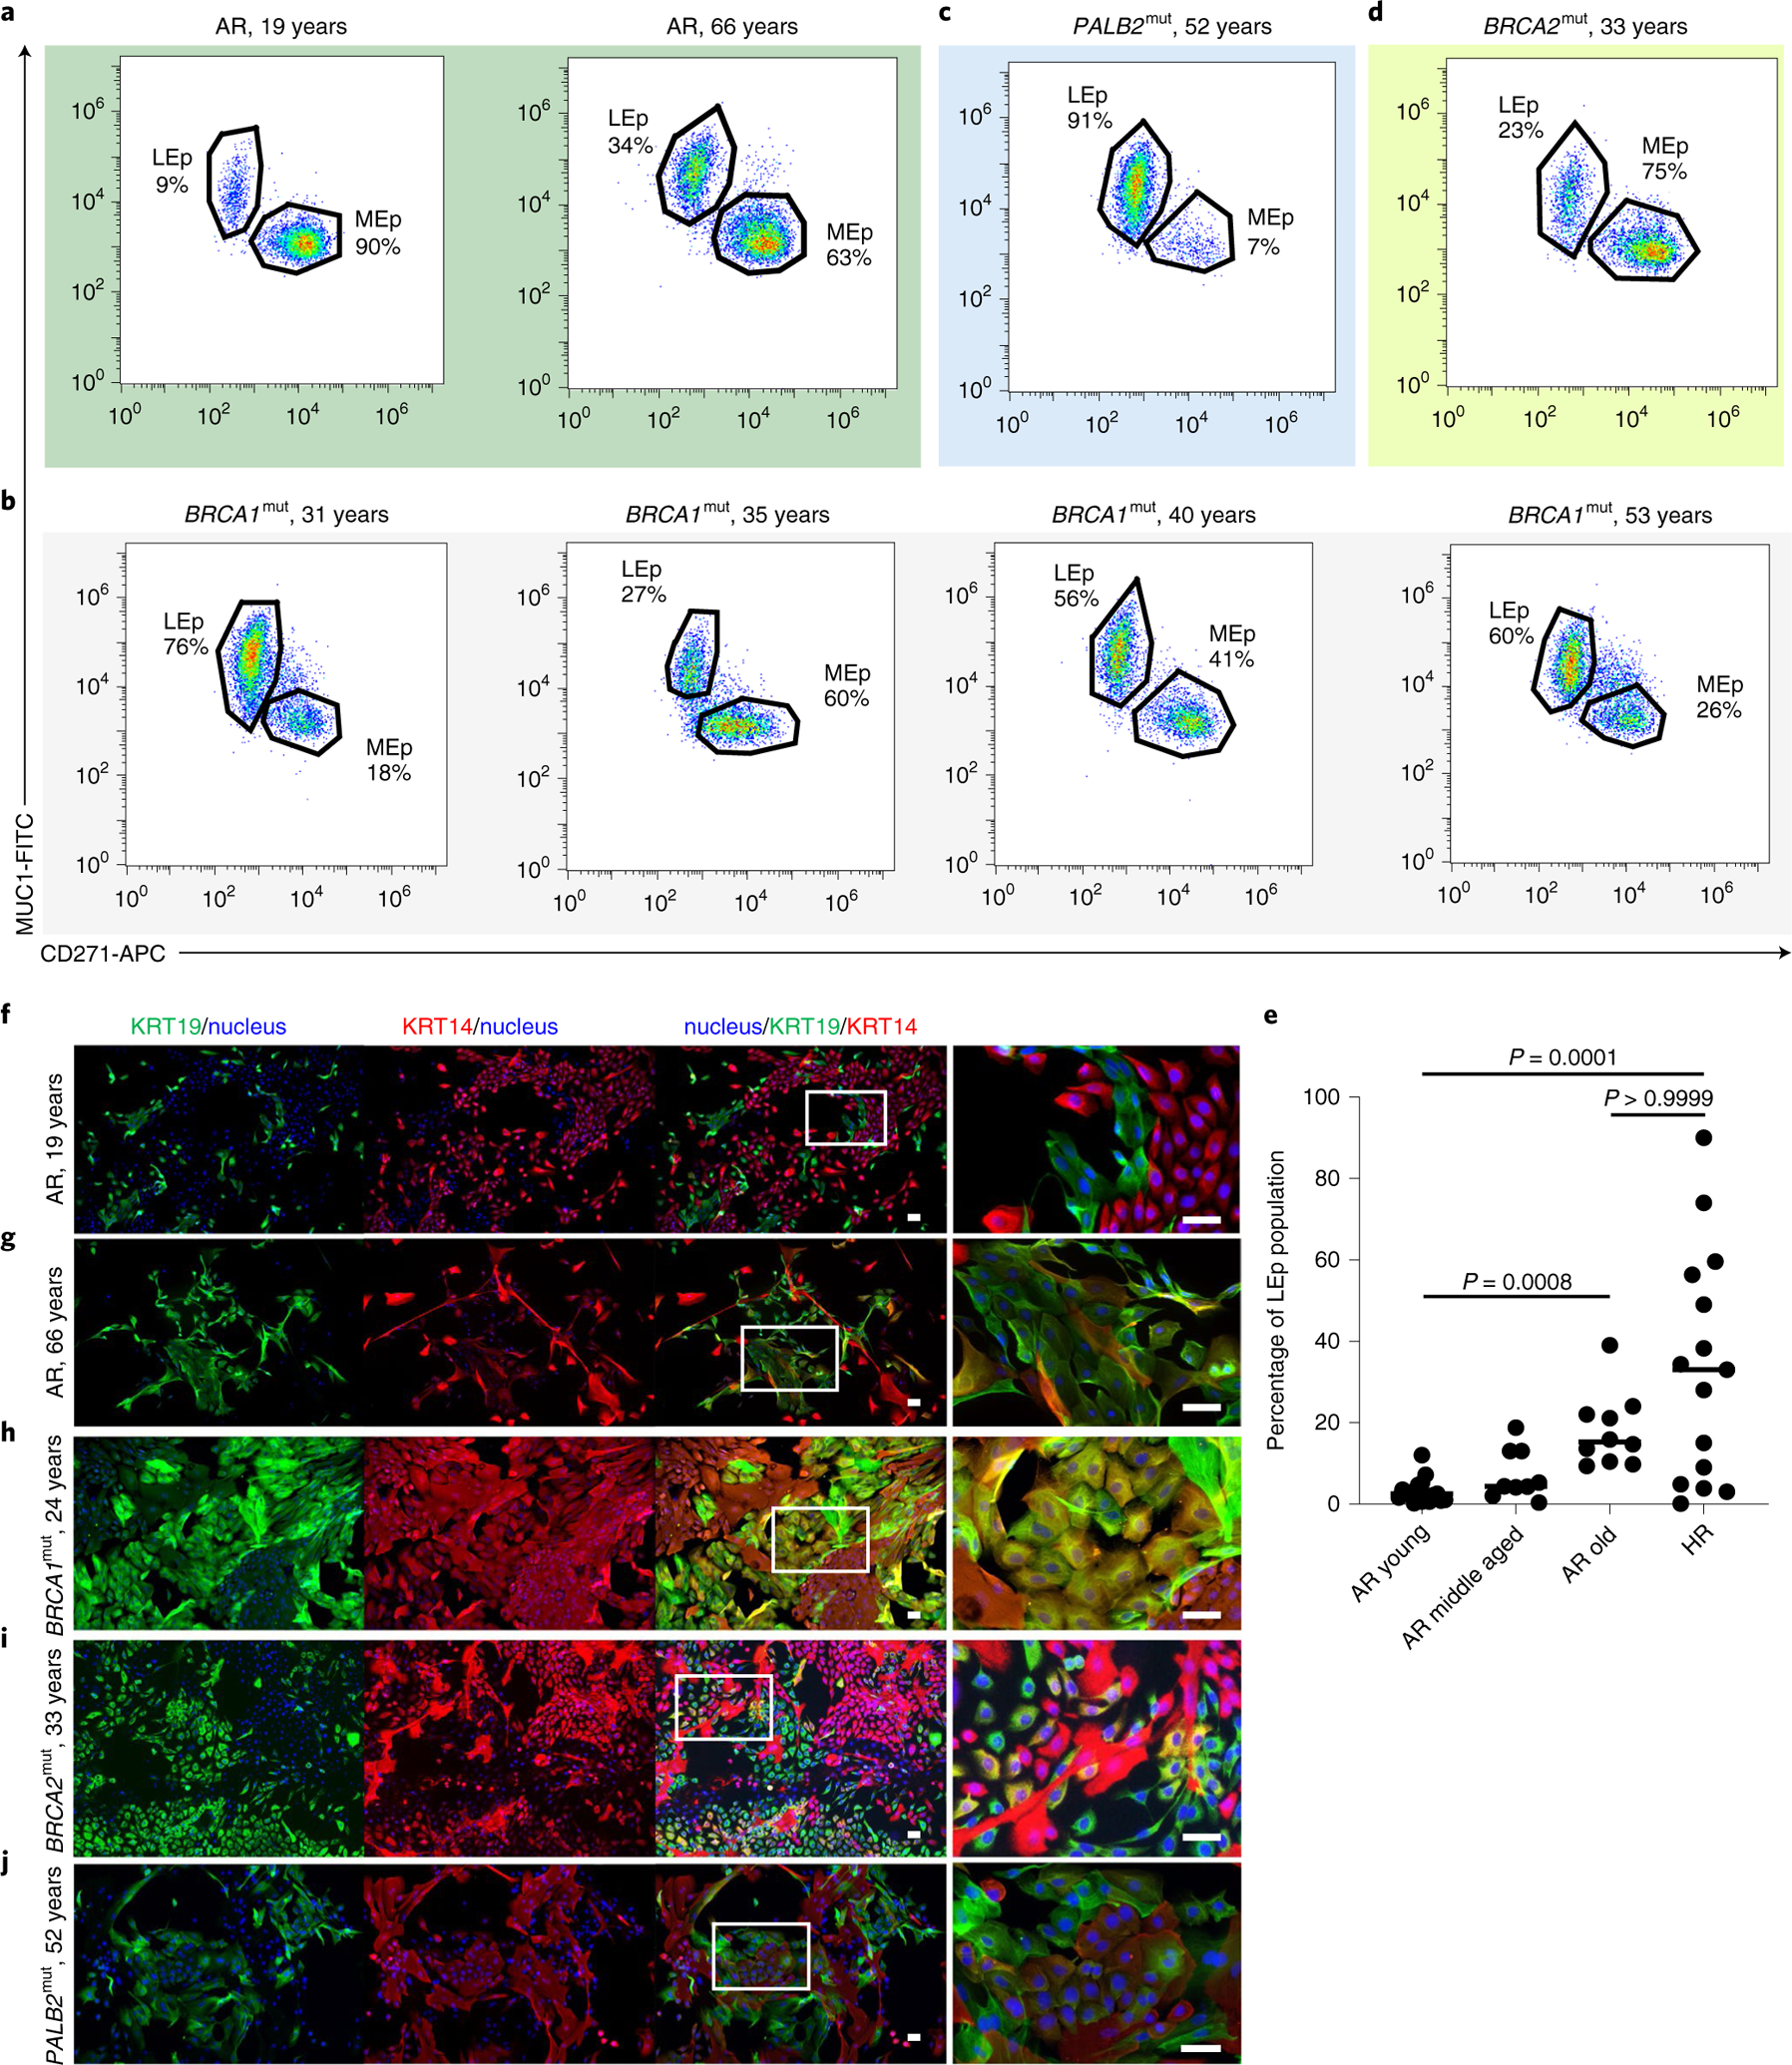
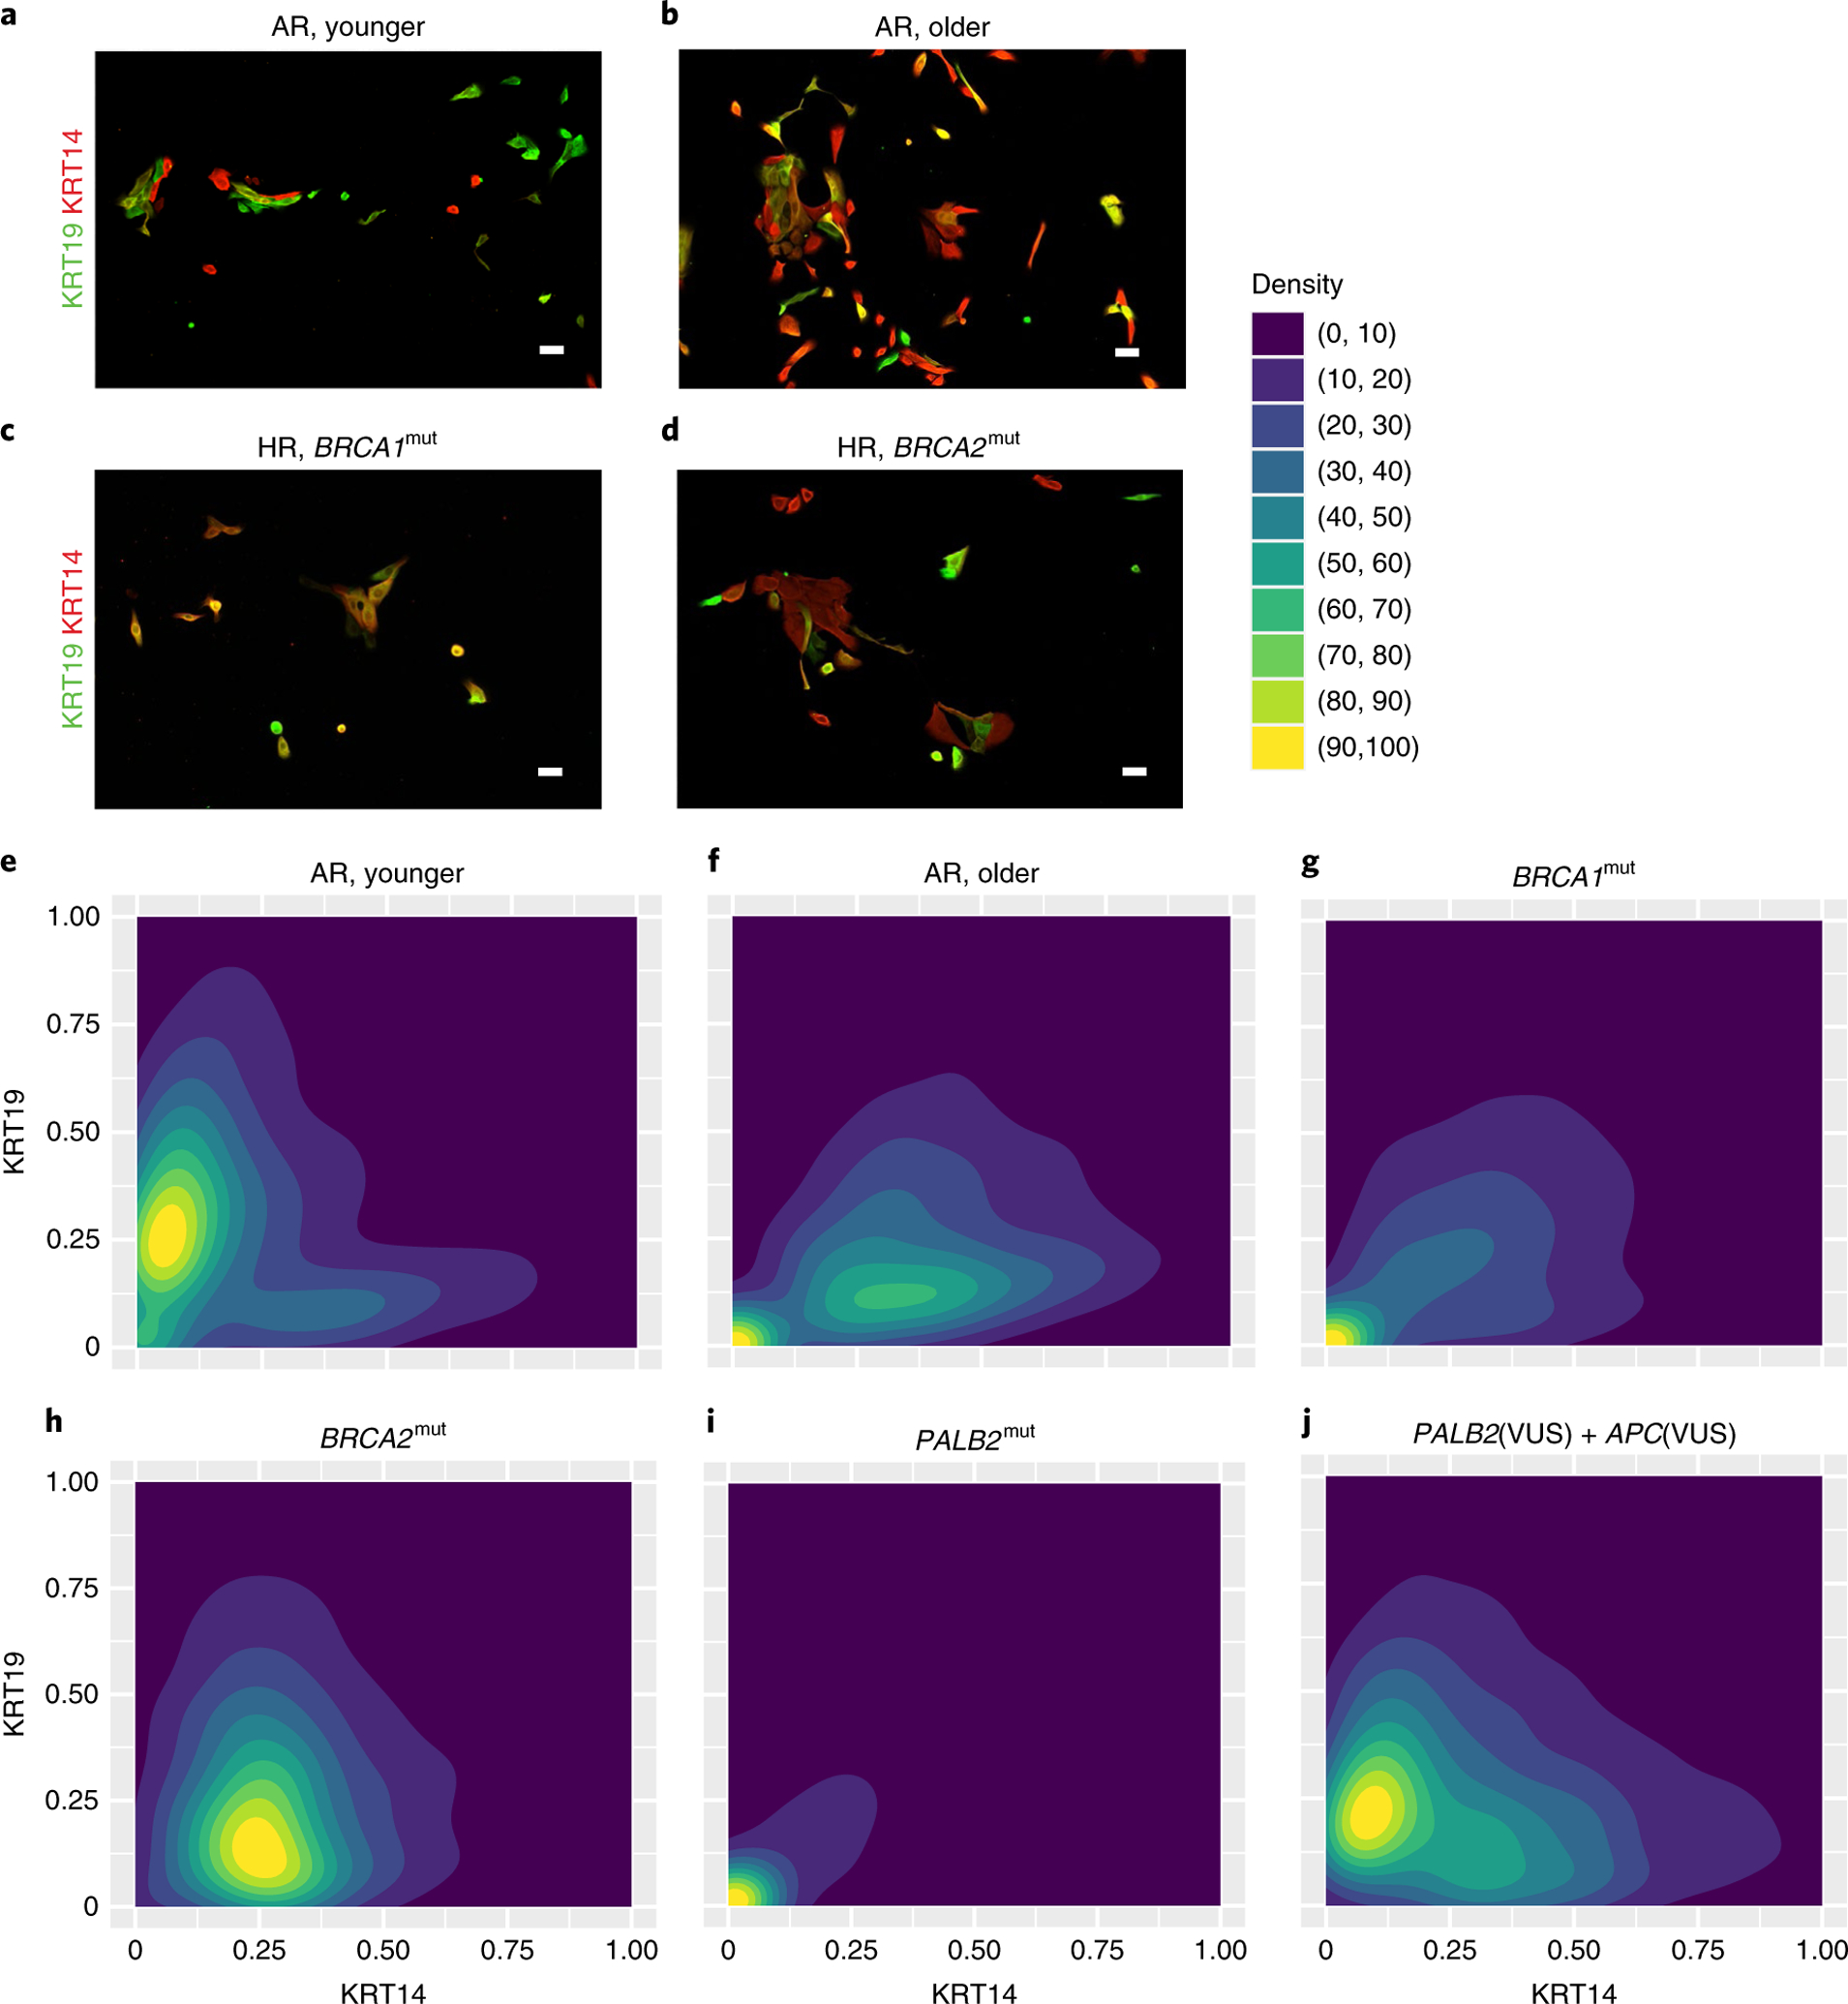
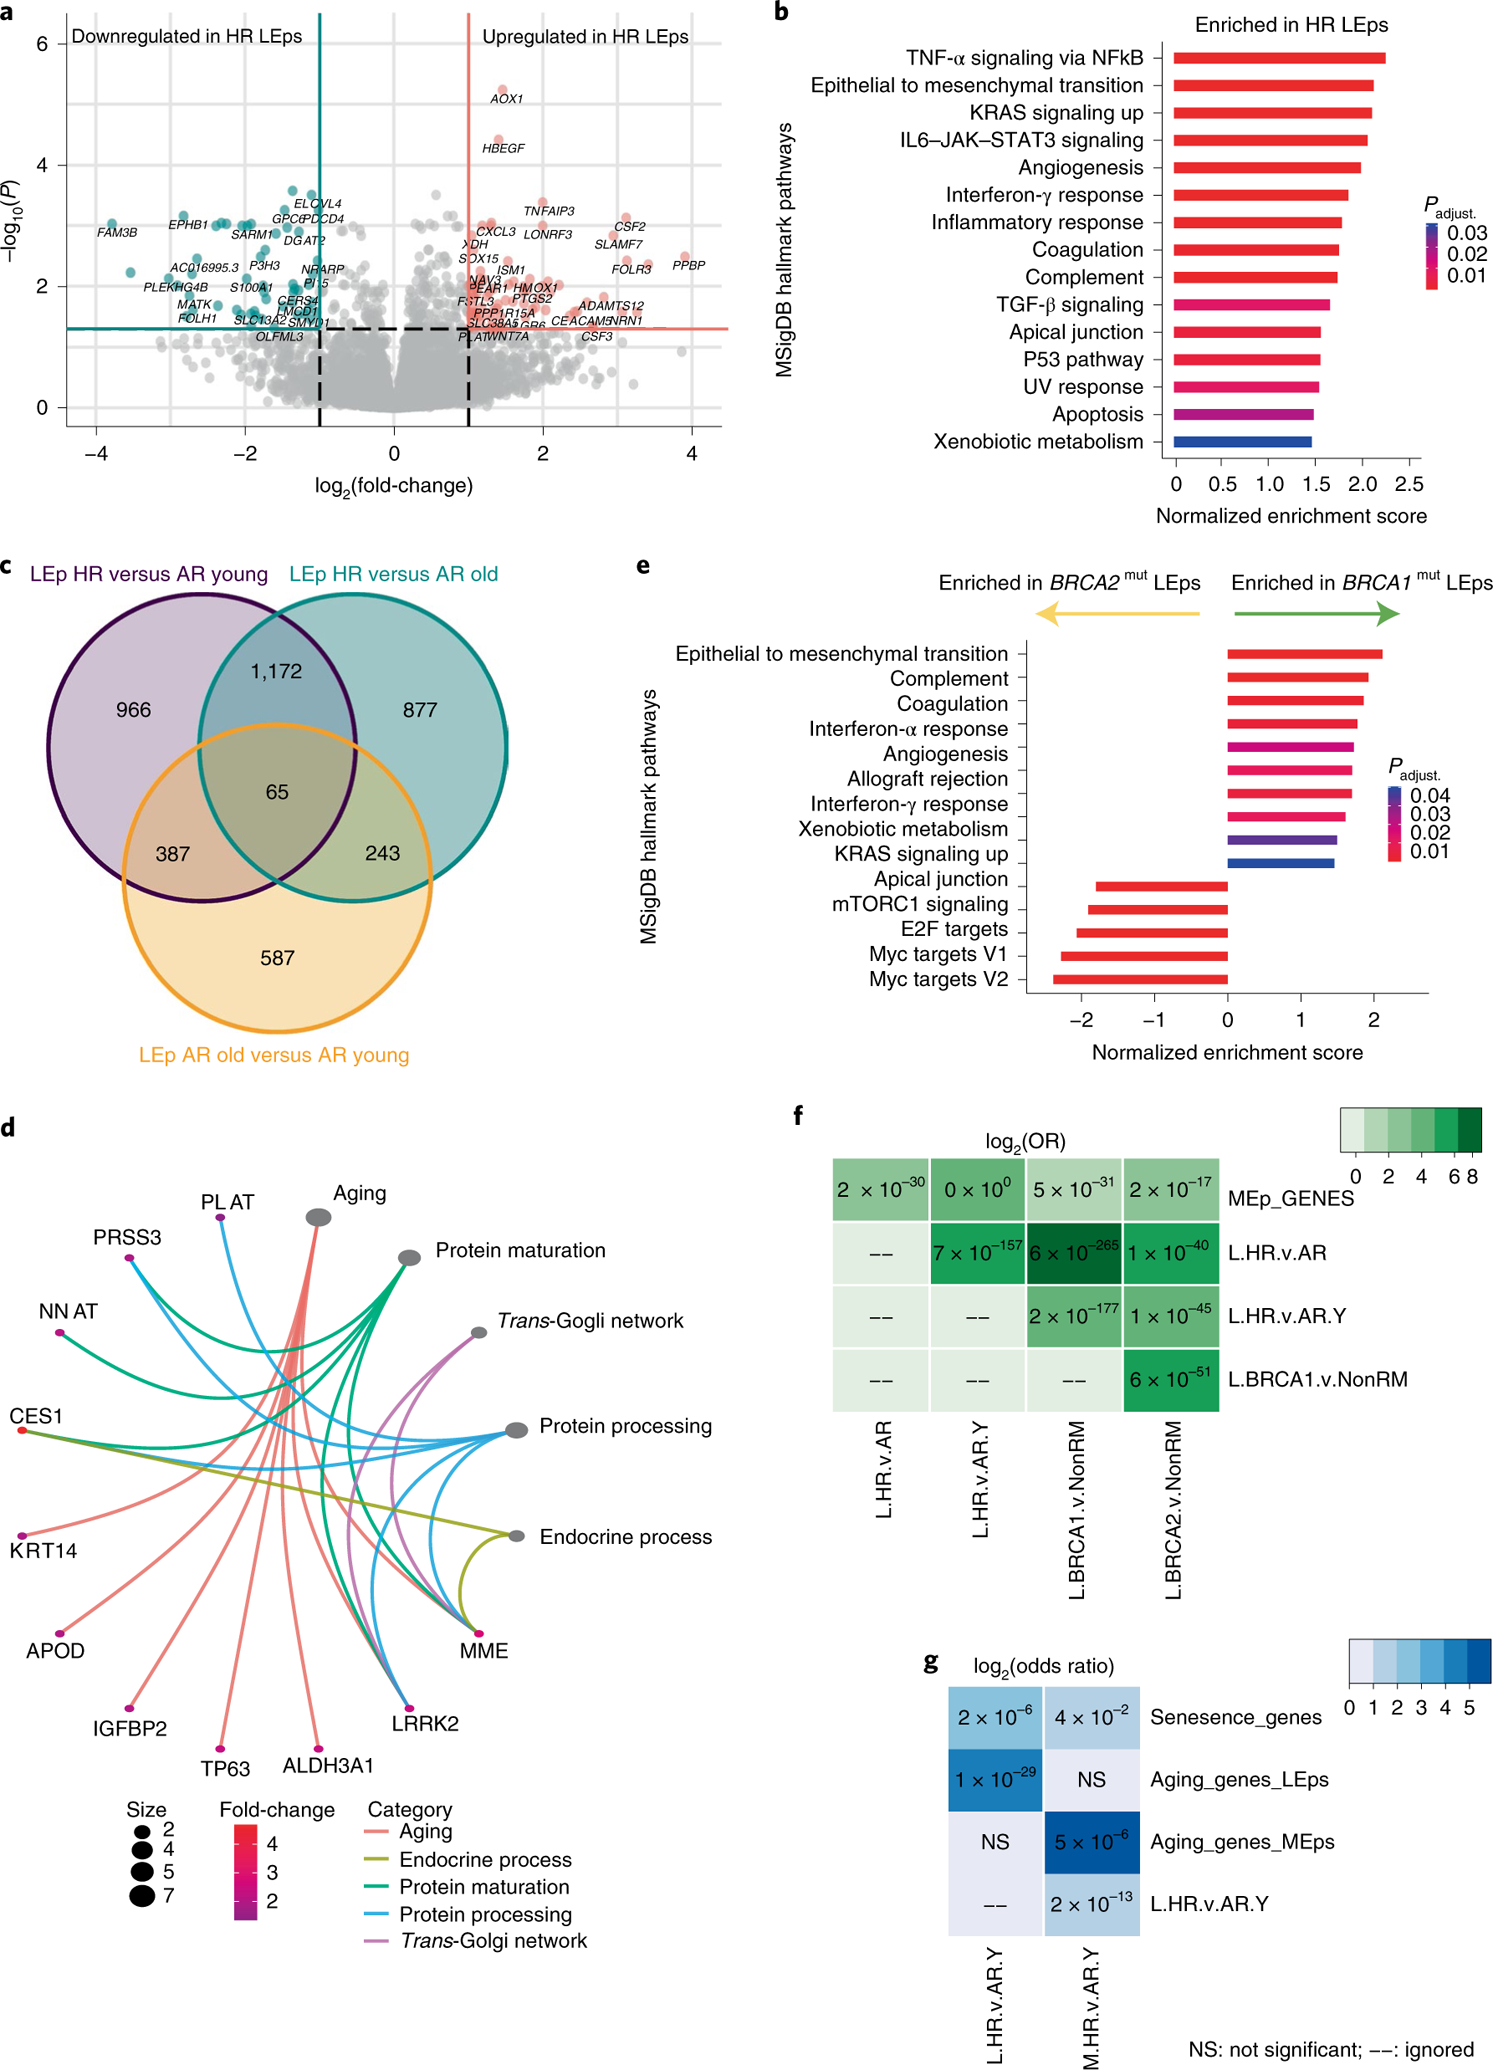
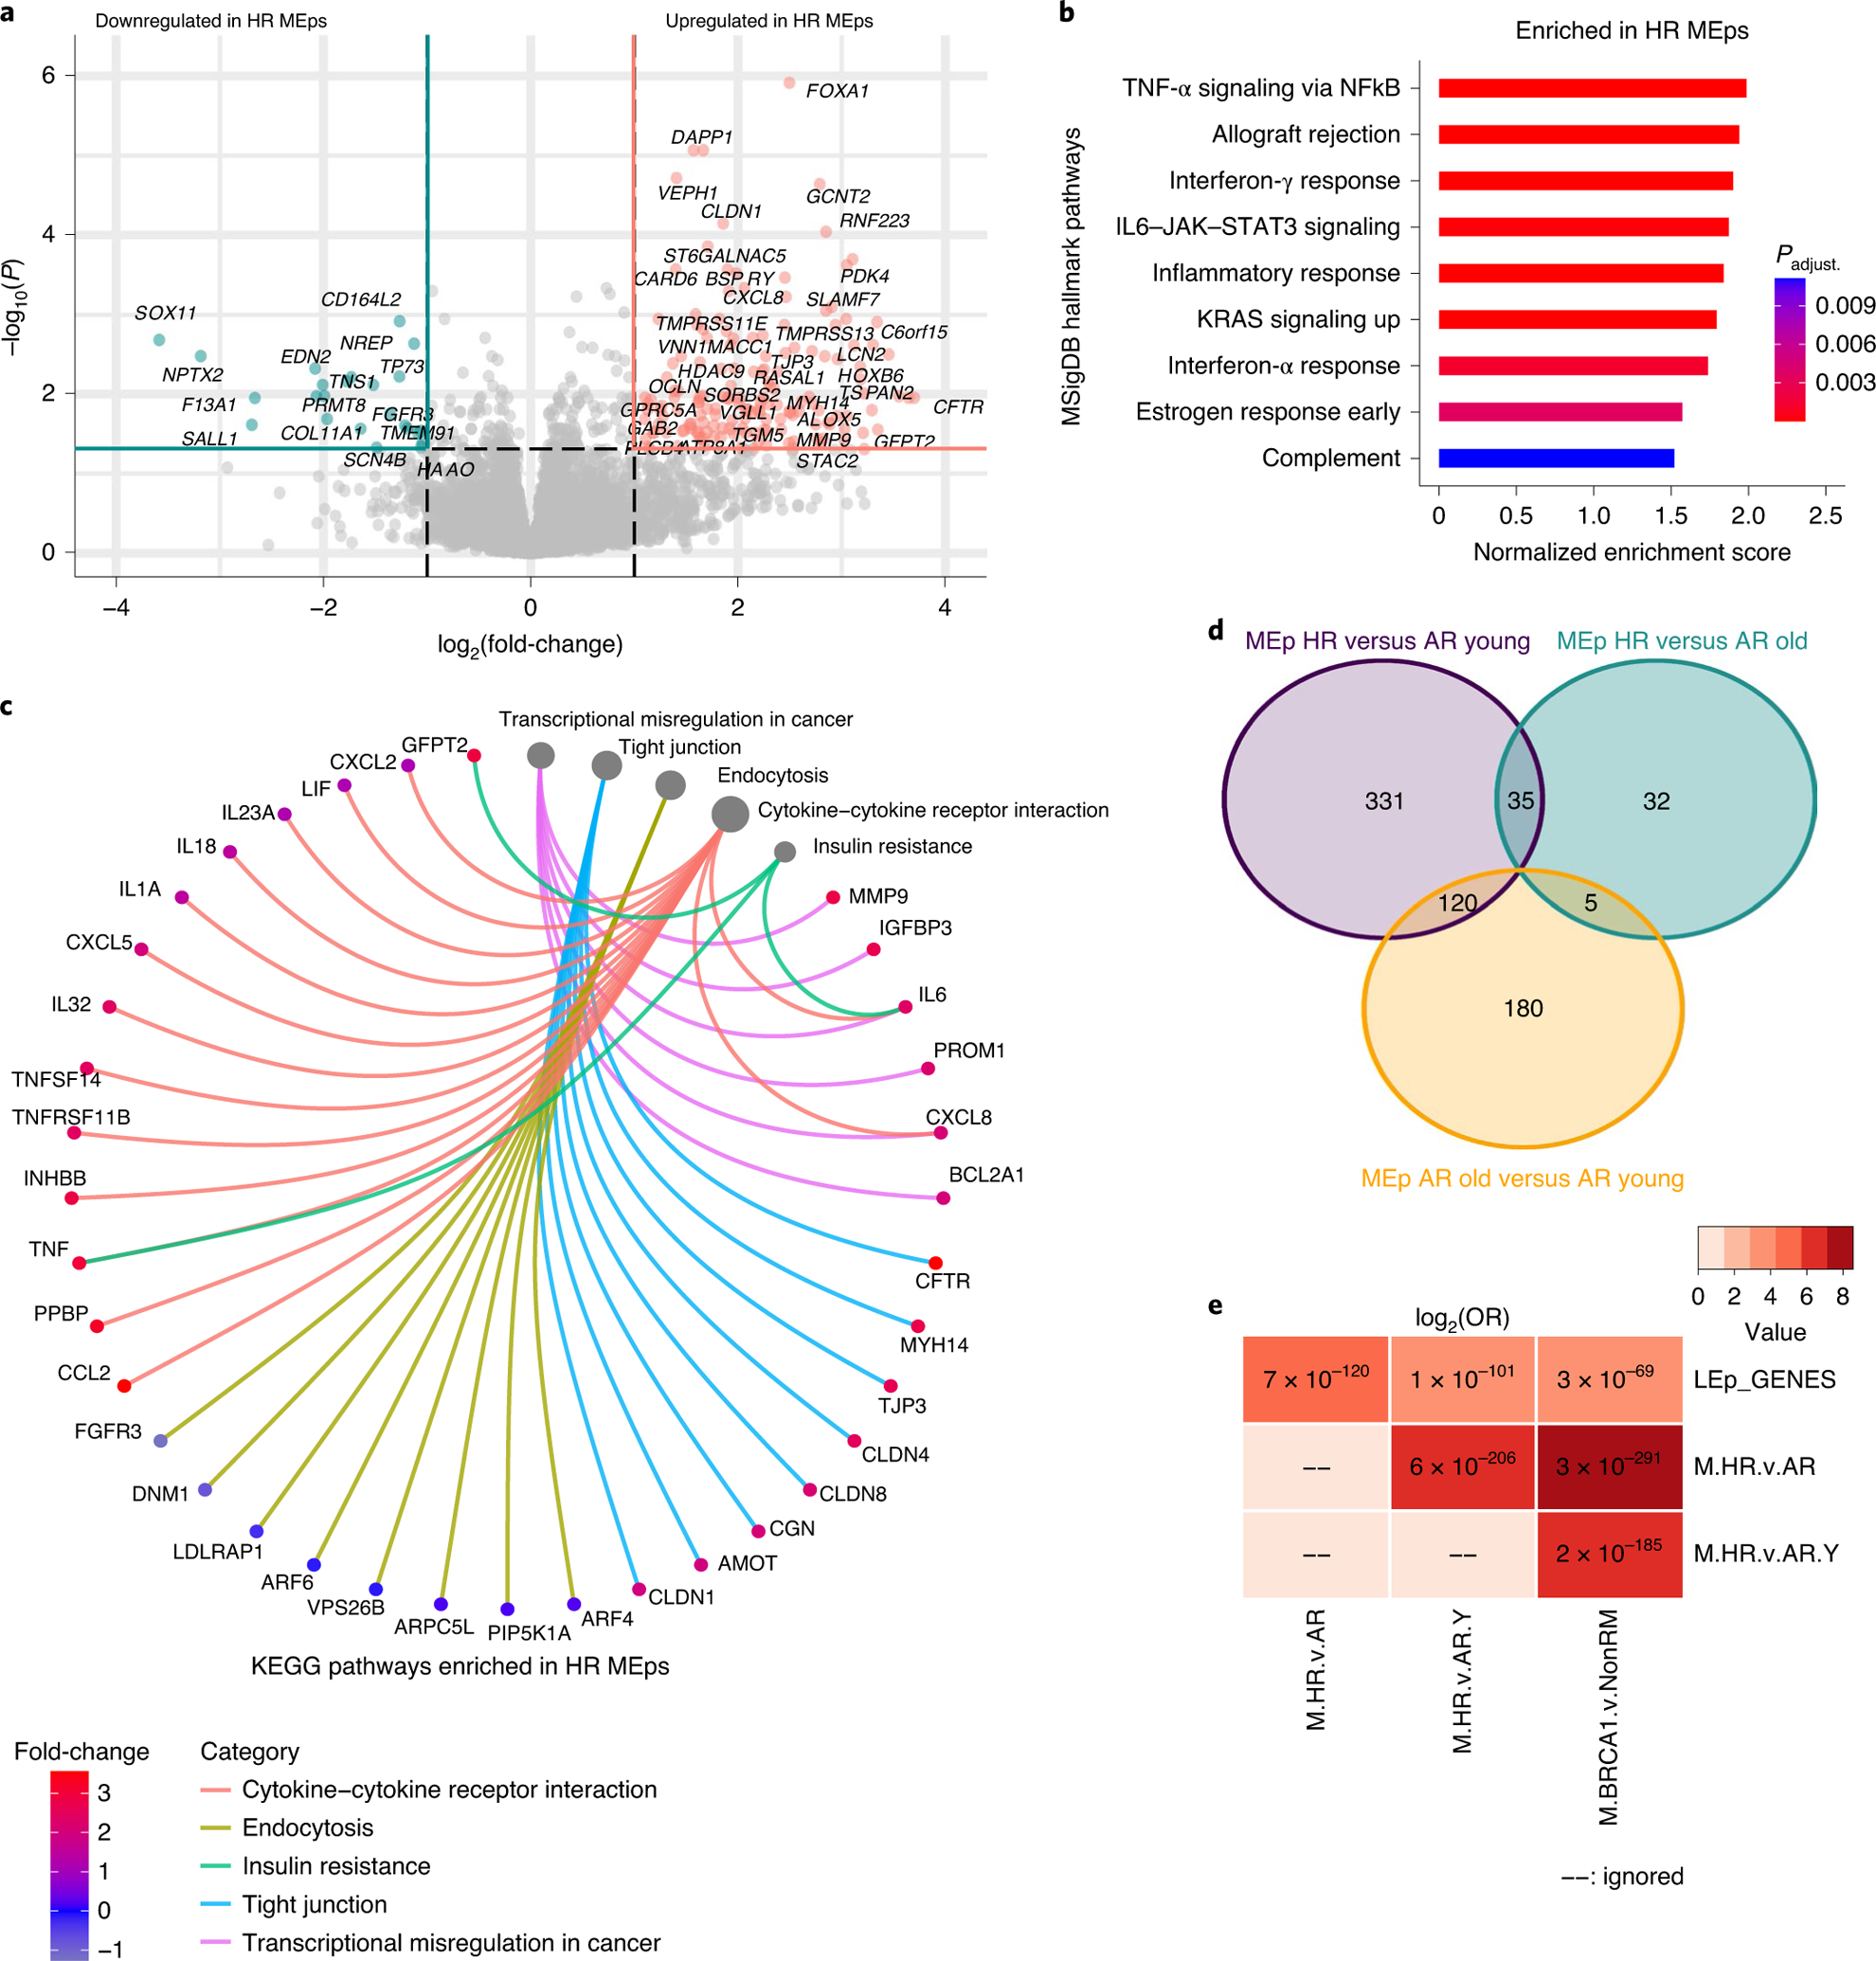
During aging in the human mammary gland, luminal epithelial cells lose lineage fidelity by expressing markers normally expressed in myoepithelial cells. We hypothesize that loss of lineage fidelity is a general manifestation of epithelia that are susceptible to cancer initiation. In the present study, we show that histologically normal breast tissue from younger women who are susceptible to breast cancer, as a result of harboring a germline mutation in BRCA1, BRCA2 or PALB2 genes, exhibits hallmarks of accelerated aging. These include proportionately increased luminal epithelial cells that acquired myoepithelial markers, decreased proportions of myoepithelial cells and a basal differentiation bias or failure of differentiation of cKit+ progenitors. High-risk luminal and myoepithelial cells are transcriptionally enriched for genes of the opposite lineage, inflammatory- and cancer-related pathways. We have identified breast-aging hallmarks that reflect a convergent biology of cancer susceptibility, regardless of the specific underlying genetic or age-dependent risk or the associated breast cancer subtype.


Conflict of interest statement

Competing interests The authors declare no competing interests.

Figures

Extended Data Fig. 1 |
Extended Data Fig. 1 |. Parity status does not impact loss of lineage fidelity in LEps.
(a-c) dot plots representing the distribution of (a) gravidity, (b) parity, and (c) time since last childbirth in years between average-risk (AR) and high-risk (HR) women included in this study. The lines on the plots represent the medians. (d-f) Correlation plots investigating the association of (d) gravidity, (e) parity, and (c) time since last childbirth in years and the percentage of luminal epithelial cells (LEps) expressing KRT14. The plots report Pearson correlation coefficient (r) and P values that were determined by a two tailed simple linear regression. The lines on the plots represent the best fit line computed via regression analysis.
Extended Data Fig. 2 |
Extended Data Fig. 2 |. High-risk epithelial strains with low LEp populations.
Flow cytometry analysis of passage four epithelia stained for (a-b) CD271(MEp marker) and MUC1(LEp marker) or (c-d) CD271 and CD133 (LEp marker) from HR women carrying (a) BRCA1 or (b-d) BRCA2 mutations.
Extended Data Fig. 3 |
Extended Data Fig. 3 |. High-risk mammary epithelial progenitors with various mutations show basal differentiation biases after 7 days of culture.
(a-d) Histograms of cKit-enriched cells stained with KRT14 and KRT19 that were fixed after 2 days of culture from (a) AR women with no predisposing mutations and (b) HR women, and after 7 days of culture from (c) AR women and (d) HR women. (e-f) Immunofluorescent images of cKit-enriched cells stained for KRT19 (green) and KRT14 (red) that were fixed after 7 days of culture from (e) an AR woman (40 y) and (f) an HR woman harboring a germline BRCA2 mutation (44 y). (g-l) Density contour plots of KRT14 and KRT19 mean fluorescent intensity signals in cKit-enriched cells that were fixed after 7 days of culture from (g) AR younger women, (h) AR older women, and HR women harboring germline mutations of (i) BRCA1, (j) BRCA2, (k) PALB2 and (l) PALB2 (VUS)+APC (VUS). Scale bars = 50 μm. Abbreviations are as follows: VUS, variant of unknown significance. Experiments in e-f were repeated three times independently with similar results. The number of cell strains used in each experiment representing the two groups are as follows: e, five; f, thirteen.
Extended Data Fig. 4 |
Extended Data Fig. 4 |. Differentiation patterns from high-risk mammary epithelial progenitors that had a VuS.
(a-b) Immunofluorescent images of cKit-enriched cells stained for KRT19 (green) and KRT14 (red) that were fixed after 2 days of culture from (a) an HR woman harboring a germline BRCA1 mutation with a BRCA2 VUS and (b) an HR woman harboring a PALB2(VUS) and APC(VUS). (c-d) Density contour plots of KRT14 and KRT19 mean fluorescent intensity signals in cKit-enriched cells from an HR woman harboring germline mutations of (b) BRCA1+BRCA2(VUS) that were either fixed after (c) 2 days or (d) 7 days of culture. Experiments in a-b were repeated twice with similar results. Scale bars = 50 μm.
Fig. 1 |
Fig. 1 |. HR LEps coexpress KRT14 along with KRT19 resembling aged LEps.
af, Immunofluorescent images of primary human mammary ducts stained for KRT19 (green) and KRT14 (red) from a 32-year-old AR woman (a), a 62-year-old AR woman (b), a 33-year-old woman harboring a BRCA2 mutation (BRCA2mut) (c), a 24-year-old woman harboring a BRCA1mut (d), a 31-year-old woman harboring BRCA1 and BRCA2 mutations (e) and a 52-year-old woman harboring a PALB2mut (f). Scale bars, 50 μm. g, A schematic of the method used in quantification and analysis of immunofluorescent images. h, Dot plot of the percentage of KRT19+ LEps expressing KRT14 in HR (n = 23) and AR (n = 26) samples. The P value was computed using a two-sided Mann–Whitney U-test. i, Dot plot of the percentage of KRT19+ LEps expressing KRT14 in HR (n = 23), AR younger (≤35 years, n = 11) and AR older (>55 years, n = 5) strains. The P values were computed using one-way ANOVA adjusted for multiple comparisons using Tukey’s post-hoc test. j,k, The log2(expression) of KRT14 (j) and KRT19 (k) mRNA in passage 4 LEps. The outlines of the boxes represent the first and third quartiles. The vertical line inside the boxes represents the median, and the whiskers go from each quartile to the minimum and maximum values. The P values were computed using Welch’s ANOVA test adjusted for multiple comparisons with Dunnett’s T3 post-hoc test. l, Waterfall plot of the percentage of KRT19+ LEps that express KRT14 in HR and AR strains mapped for mutation, age and tissue type. Age groups are as follows: young, ≤35 years; middle aged, >35 years and ≤55 years; and old, >55 years. m, Dot plot of the percentage of KRT14+ MEps expressing KRT19 fluorescent signal in HR and AR samples. n, Dot plot of the percentage of KRT19+ LEps and KRT14+ MEps expressing KRT14 and KRT19 in HR and AR samples detected by immunofluorescence. In m and n, the P values were computed using a two-sided Mann–Whitney U-test. o, Waterfall plot of the percentage of KRT19+ LEps that express KRT14 in all HR strains, all AR strains and tissue sections of premalignant and malignant breast lesions. The P values were computed using the Kruskal–Wallis test adjusted for multiple comparisons using Dunn’s post-hoc test. In l and o, the edges of the bars represent the means and the error bars represent the s.e.m. The gray dots in l represent data from each image taken per strain. The gray dots in o represent the average of images taken per strain/sample in the groups listed. At least two sections from each individual were stained and analyzed independently with similar results. The number of different individuals representing each group are as follows: a, 11; b, five; c, five; d, nine; e, two; f, three.
Fig. 2 |
Fig. 2 |. HR cultured mammary epithelial cells show luminal expansion with a basal phenotype.
ad, Flow cytometry analysis of passage 4 epithelia stained for CD271 and MUC1 from an AR 19-year-old woman and an AR 66-year-old woman (a), HR women of different ages (31, 35, 40 and 53 years) harboring BRCA1 mutations (b), an HR 52-year-old woman harboring a PALB2 mutation (PALB2mut) (c) and an HR 33-year-old woman harboring a BRCA2mut (d). e, Dot plot of the percentage of LEp populations from passage 4 epithelial strains derived from AR younger women (≤35 years, n = 17), AR middle-aged women (36–55 years, n = 9), AR older women (>55 years, n = 10) and HR women (n = 15). The median of each sample is indicated by a horizontal line. The P values were computed using the Kruskal–Wallis test adjusted for multiple comparisons with Dunn’s post-hoc test. fj, Immunofluorescence staining of passage 4 cultured epithelial cells stained for KRT19 (green), KRT14 (red) and Hoechst (blue) from an AR 19-year-old woman (f), an AR 66-year-old woman (g), an HR 24-year-old woman harboring a BRCA1mut (h), an HR 33-year-old woman harboring a BRCA2mut (i) and a 52-year-old woman harboring a PALB2mut (j). The image on the right-hand side of each panel is a magnification of the area outlined by the white rectangle in the merged image. Scale bars, 50 μm. Experiments in fj were repeated three times independently with similar results.
Fig. 3 |
Fig. 3 |. HR mammary epithelial progenitors show a differentiation defect and a basal differentiation bias.
ad, Immunofluorescent images of cKit-enriched cells stained for KRT19 (green) and KRT14 (red) that were fixed at 2 d of culture from an AR younger woman (a), an AR older woman (b), an HR 35-year-old woman harboring a BRCA1 mutation (BRCA1mut) (c) and an HR 44 year-old woman harboring a BRCA2mut (d). Scale bars, 50 μm. ej, Density contour plots of KRT14 and KRT19 mean florescent intensity signals in cKit-enriched cells that were fixed after 2 d of culture from AR younger women (e), AR older women (f) and HR women harboring germline mutations of BRCA1 (g), BRCA2 (h), PALB2 (i) and PALB2(VUS) + APC(VUS) (j). Experiments in ad were repeated three times independently with similar results. The number of individuals with cKit+ were derived from representing each group as follows: a, three; b, two; c, eight; d, six.
Fig. 4 |
Fig. 4 |. Transcriptomes of HR LEps resemble aged LEps and map to inflammatory and cancer-related pathways.
a, Volcano plot of DE genes in HR compared with AR LEps. b, MSigDB hallmark gene sets enriched in HR LEps compared with AR LEps. TGF-β, transforming growth factor β. c, Venn diagram of DE genes of three comparisons: HR versus AR younger (≤35 years) LEps, HR versus AR older (>55 years) LEps and AR older versus AR younger LEps. d, GO terms overrepresented in common genes upregulated in both HR and AR older LEps. The size of the circles reflects the number of genes per term. Padjust. is the adjusted P value for multiple comparisons. e, MSigDB hallmark gene sets enriched in LEps harboring BRCA1 versus BRCA2 mutations. f,g, Matrices of genes overlapping between several comparisons. Numbers in the matrix represent P values; the color gradient is the log2(OR) of the overlap. The P values were computed using Fischer’s exact test within the GeneOverlap package for each pair of gene lists compared in a one-sided manner (alternative = greater). L.HR.v.AR, genes upregulated in HR LEps compared with AR LEps; L.HR.v.AR.Y, genes upregulated in HR LEps compared with AR younger LEps (≤35 years); L.BRCA1.v.Non.RM, genes upregulated in LEps harboring BRCA1 mutations compared with AR LEps that do not harbor any mutations collected from reduction mammoplasties; L.BRCA2.v.Non.RM, genes upregulated in LEps harboring BRCA2 mutations compared with AR LEps that do not harbor any mutations collected from reduction mammoplasties; M.HR.v.AR.Y, genes upregulated in HR MEps compared with AR younger MEps (≤35 years).
Fig. 5 |
Fig. 5 |. Transcriptomes of HR MEps resemble aged MEps and map to inflammatory and cancer-related pathways.
a, Volcano plot of DE genes in HR compared with AR MEps. b, MSigDB hallmark gene sets enriched in HR MEps compared with AR MEps. c, KEGG pathways overrepresented in HR MEps compared with AR MEps. The size of the circles reflects the number of genes per pathway. d, Venn diagram of DE genes of three comparisons: HR versus AR younger (≤35 years) MEps, HR versus AR older (>55 years) MEps and AR older versus AR younger MEps. e, A matrix of genes overlapping across several comparisons. Numbers in the matrix represent P values whereas the color gradient is the log2(OR) of the overlap. The P values were computed using Fischer’s exact test within the GeneOverlap package for each pair of gene lists compared in a one-sided manner (alternative = greater). M.HR.v.AR, genes upregulated in HR MEps compared with AR MEps; M.HR.v.AR.Y, genes upregulated in HR MEps compared with AR younger MEps (≤35 years); M.BRCA1.v.Non.RM, genes upregulated in MEps harboring BRCA1 mutations compared with AR MEps that do not harbor any mutations collected from reduction mammoplasties.

Comment in

  • Remaining true to one's identity.
    Caruso JA, Tlsty TD. Caruso JA, et al. Nat Aging. 2021 Sep;1(9):757-759. doi: 10.1038/s43587-021-00113-8. Nat Aging. 2021. PMID: 37117630 Free PMC article.

References

    1. Rate of New Female Breast Cancers, United States, 2018 (CDC, 2018); https://gis.cdc.gov/Cancer/USCS/#/AtAGlance/
    1. Kuchenbaecker KB et al. Risks of breast, ovarian, and contralateral breast bancer for BRCA1 and BRCA2 mutation carriers. J. Am. Med. Acad 317, 2402–2416 (2017). - PubMed
    1. Todhunter ME, Sayaman RW, Miyano M & LaBarge MA Tissue aging: the integration of collective and variant responses of cells to entropic forces over time. Curr. Opin. Cell Biol 54, 121–129 (2018). - PMC - PubMed
    1. Deugnier M-A, Teulière J, Faraldo MM, Thiery JP & Glukhova MA The importance of being a myoepithelial cell. Breast Cancer Res 4, 224–230 (2002). - PMC - PubMed
    1. Sternlicht MD & Barsky SH The myoepithelial defense: a host defense against cancer. Med. Hypotheses 48, 37–46 (1997). - PubMed

Publication types