

QRS micro-fragmentation as a mortality predictor
- PMID: 35187560
- PMCID: PMC9584751
- DOI: 10.1093/eurheartj/ehac085
QRS micro-fragmentation as a mortality predictor
Abstract
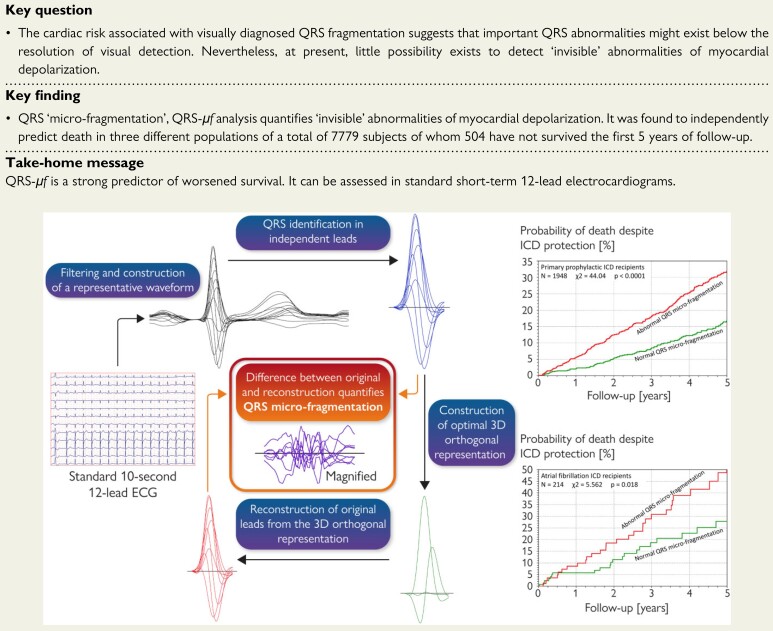
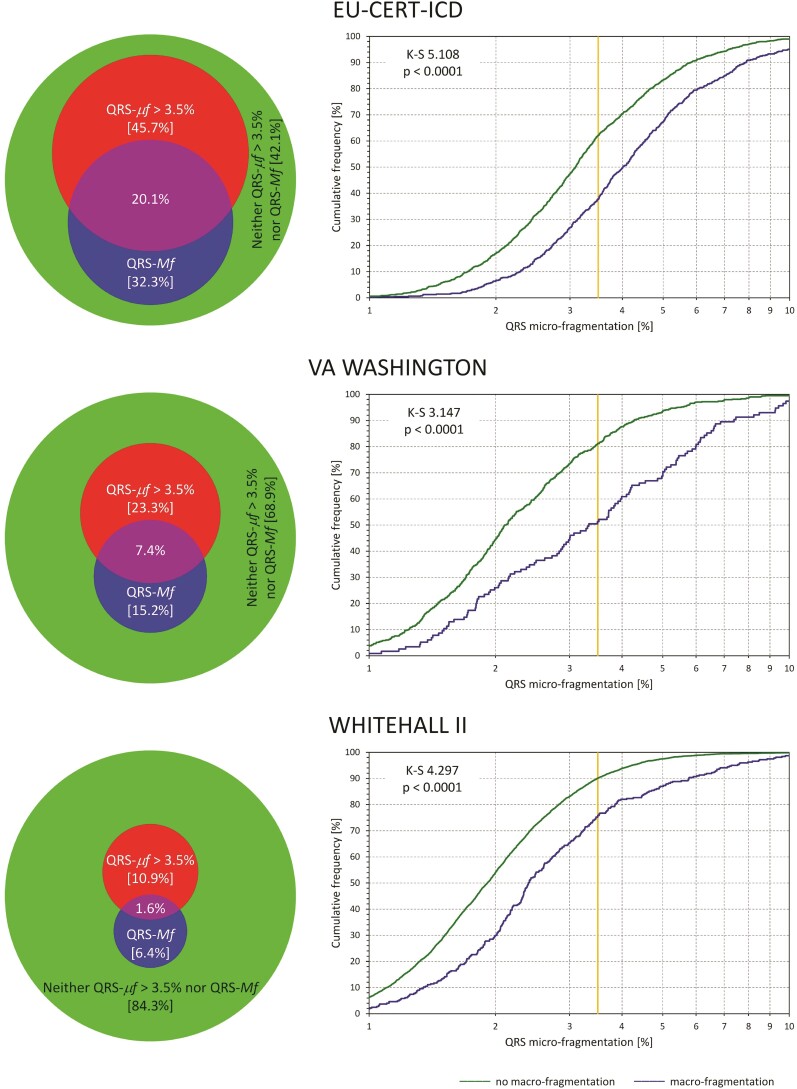
Aims: Fragmented QRS complex with visible notching on standard 12-lead electrocardiogram (ECG) is understood to represent depolarization abnormalities and to signify risk of cardiac events. Depolarization abnormalities with similar prognostic implications likely exist beyond visual recognition but no technology is presently suitable for quantification of such invisible ECG abnormalities. We present such a technology.
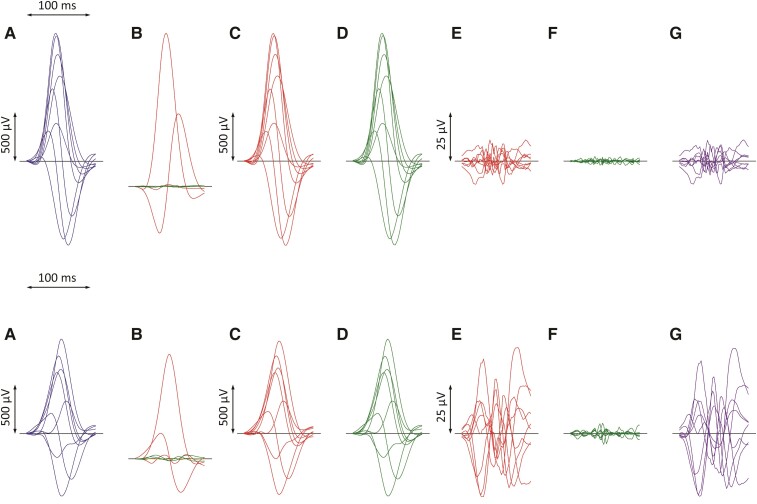
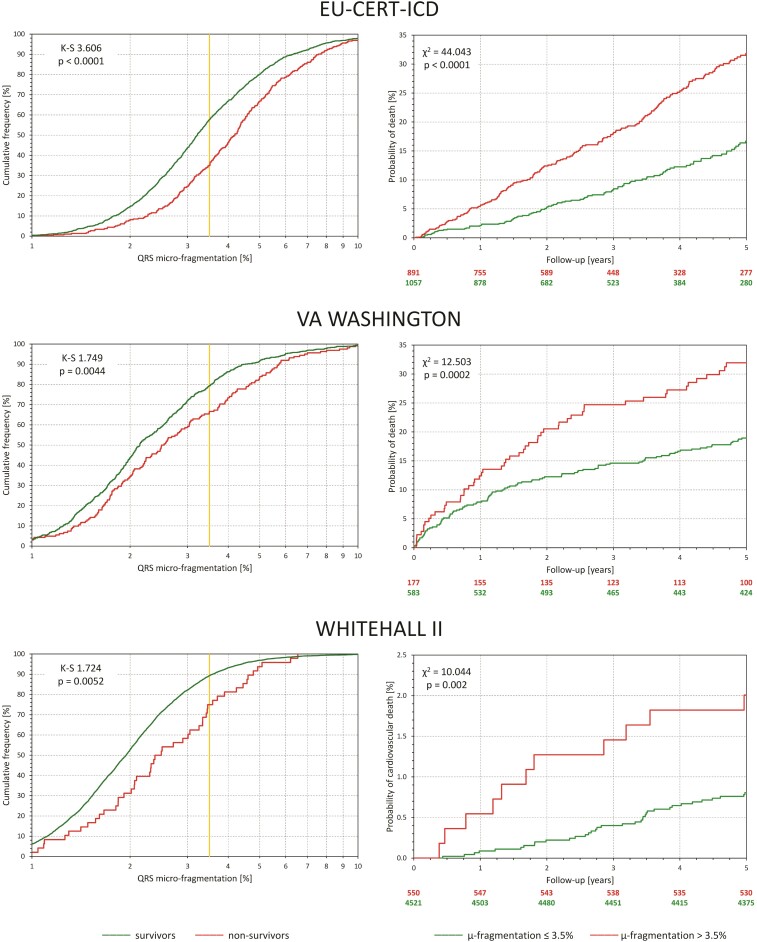
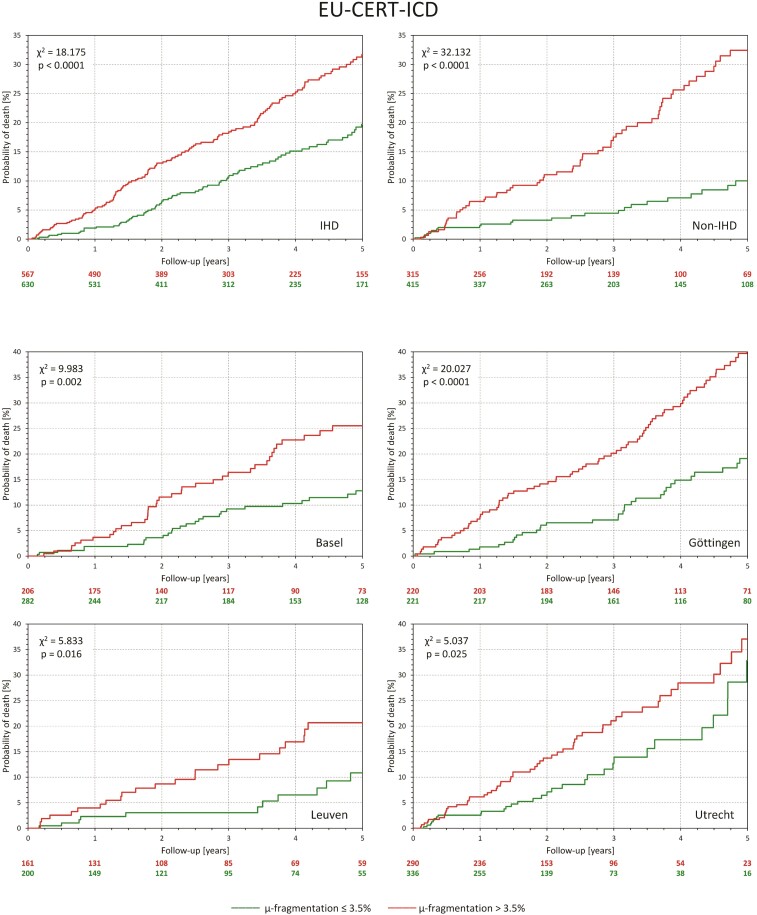
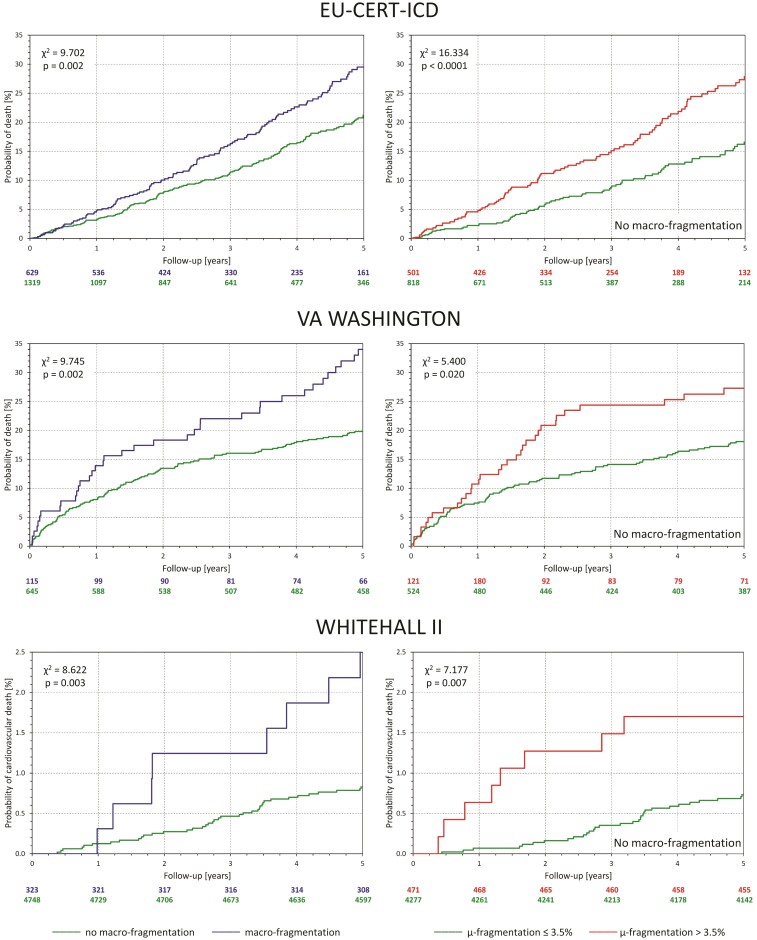
Methods and results: A signal processing method projects all ECG leads of the QRS complex into optimized three perpendicular dimensions, reconstructs the ECG back from this three-dimensional projection, and quantifies the difference (QRS 'micro'-fragmentation, QRS-μf) between the original and reconstructed signals. QRS 'micro'-fragmentation was assessed in three different populations: cardiac patients with automatic implantable cardioverter-defibrillators, cardiac patients with severe abnormalities, and general public. The predictive value of QRS-μf for mortality was investigated both univariably and in multivariable comparisons with other risk factors including visible QRS 'macro'-fragmentation, QRS-Mf. The analysis was made in a total of 7779 subjects of whom 504 have not survived the first 5 years of follow-up. In all three populations, QRS-μf was strongly predictive of survival (P < 0.001 univariably, and P < 0.001 to P = 0.024 in multivariable regression analyses). A similar strong association with outcome was found when dichotomizing QRS-μf prospectively at 3.5%. When QRS-μf was used in multivariable analyses, QRS-Mf and QRS duration lost their predictive value.
Conclusion: In three populations with different clinical characteristics, QRS-μf was a powerful mortality risk factor independent of several previously established risk indices. Electrophysiologic abnormalities that contribute to increased QRS-μf values are likely responsible for the predictive power of visible QRS-Mf.
Keywords: Electrocardiogram; Fragmentation; Mortality prediction; QRS complex.
© The Author(s) 2022. Published by Oxford University Press on behalf of European Society of Cardiology.
Conflict of interest statement
Conflict of interest: Dr Hnatkova reports support from European Community’s Seventh Framework Programme, during the study, and from British Heart Foundation, during the study, and personal royalties from St Paul’s Cardiac Electrophysiology; Dr Andršová reports personal consulting fees from St Paul’s Cardiac Electrophysiology, and personal lecture honoraria from Servier Laboratories; Dr Novotný reports support from European Community’s Seventh Framework Programme, during the study, and personal consulting fees from St Paul’s Cardiac Electrophysiology; Dr Britton reports no conflict of interest; Dr Shipley reports no conflict of interest; Dr Vandenberk reports fellowship funding from Frans Van de Werf Fund for Clinical Cardiovascular Research; Dr Sprenkeler reports no conflict of interest; Dr Junttila reports no conflict of interest; Dr Reichlin reports institutional consultation fees from Biosense Webster, Boston Scientific, Biotronik, Farapulse, Bayer, BMS-Pfizer, and Medtronic, institutional lecture honoraria from Biosense Webster, Bayer, BMS-Pfizer, and Medtronic, and institutional meeting support from Bayer, BMS-Pfizer, and Biotronik; Dr Schlögl reports from European Community’s Seventh Framework Programme, during the study, and private investor income from Johnson and Johnson, and Bayer AG; Dr Vos reports a grant from the Horizon 2020 programme; Dr Friede reports support from European Community’s Seventh Framework Programme, during the study, personal consultation fees from Bayer, CSL Behring, Galapagos, Minoryx, Vifor, Novartis, and LivaNova, lecture fees from Fresenius Kabi, and personal fees for Advisory and Data Safety Monitoring boards from Bayer, Biosense Webster, Janssen, Novartis, Roche, and BSM; Dr Bauer reports grant from Medtronic Bakken Research Center, and lecture fees from Medtronic; Dr Huikuri reports no conflict of interest; Dr Willems reports support from European Community’s Seventh Framework Programme, during the study, post-doctoral clinical researcher support by the Fund for Scientific Research Flanders, during the study, institutional research grants from Abbott, Biotronik, Boston Scientific, and Medtronic, institutional lecture fees from Abbott, Biotronik, Boston Scientific, Medtronic, Daichi Sankyo, and Boehringer Ingelheim, meeting support from Daichi Sankyo, and unpaid Secretary position at the Belgian Heart Rhythm Society; Dr Schmidt reports his Chair positions of the Association of Medical Ethics Committees in the Federal Republic of Germany; Dr Franz reports no conflict of interest; Dr Sticherling reports support from European Community’s Seventh Framework Programme, during the study, consulting fees from Abbott, Biotronik, Boston Scientific, and Medtronic, and lecture honoraria from Abbott, Biotronik, Boston Scientific, and Medtronic; Dr Zabel reports support from European Community’s Seventh Framework Programme, during the study; Dr Malik reports support from European Community’s Seventh Framework Programme, during the study, and from British Heart Foundation, during the study, personal royalties from St Paul’s Cardiac Electrophysiology, personal royalties from Elsevier Academic Press, and institutional consultation fees from Sosei Heptares, BioCryst Pharmaceuticals, and Helsinn Healthcare.
Figures
Comment in
-
The fractionated QRS complex for cardiovascular risk assessment.Eur Heart J. 2022 Oct 21;43(40):4192-4194. doi: 10.1093/eurheartj/ehac198. Eur Heart J. 2022. PMID: 35574728 No abstract available.
References
-
- Peterson PN, Greiner MA, Qualls LG, Al-Khatib SM, Curtis JP, Fonarow GC, et al. QRS duration, bundle-branch block morphology, and outcomes among older patients with heart failure receiving cardiac resynchronization therapy. JAMA 2013;310:617–626. - PubMed
-
- Bauer A, Watanabe MA, Barthel P, Schneider R, Ulm K, Schmidt G. QRS duration and late mortality in unselected post-infarction patients of the revascularization era. Eur Heart J 2006;27:427–433. - PubMed
-
- Das MK, Zipes DP. Fragmented QRS: a predictor of mortality and sudden cardiac death. Heart Rhythm 2009;6:S8–S14. - PubMed
-
- Terho HK, Tikkanen JT, Junttila JM, Anttonen O, Kenttä TV, Aro AL, et al. Prevalence and prognostic significance of fragmented QRS complex in middle-aged subjects with and without clinical or electrocardiographic evidence of cardiac disease. Am J Cardiol 2014;114:141–147. - PubMed
-
- Rosengarten JA, Scott PA, Morgan JM. Fragmented QRS for the prediction of sudden cardiac death: a meta-analysis. Europace 2015;17:969–977. - PubMed
