Review
. 2023 Jun;36(6):e4715.
doi: 10.1002/nbm.4715. Epub 2022 Mar 21.

A snapshot of the vast array of diamagnetic CEST MRI contrast agents

Affiliations
Review

A snapshot of the vast array of diamagnetic CEST MRI contrast agents

Dario Livio Longo et al. NMR Biomed. 2023 Jun.

Abstract

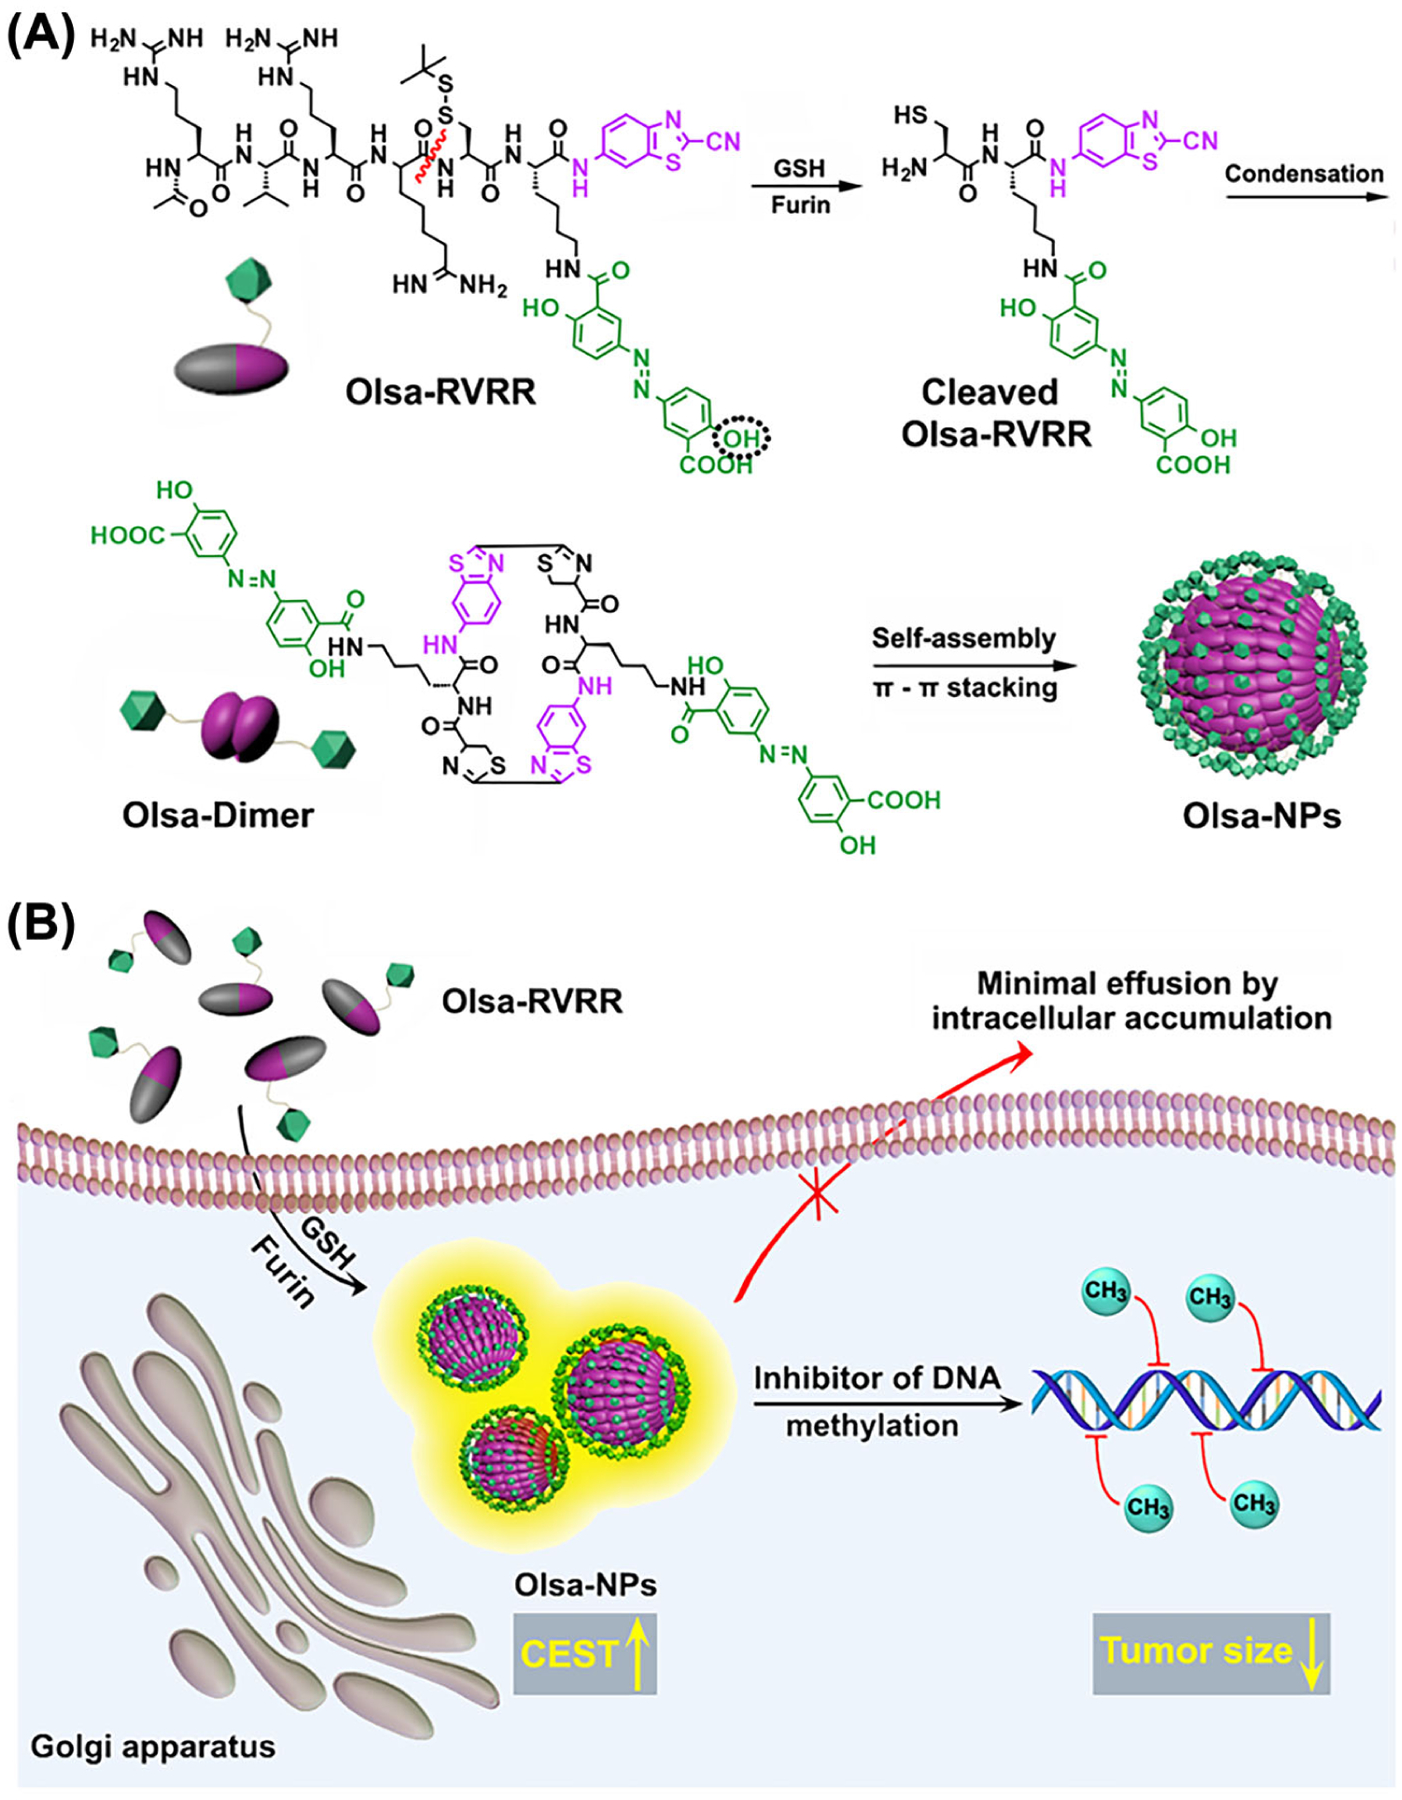
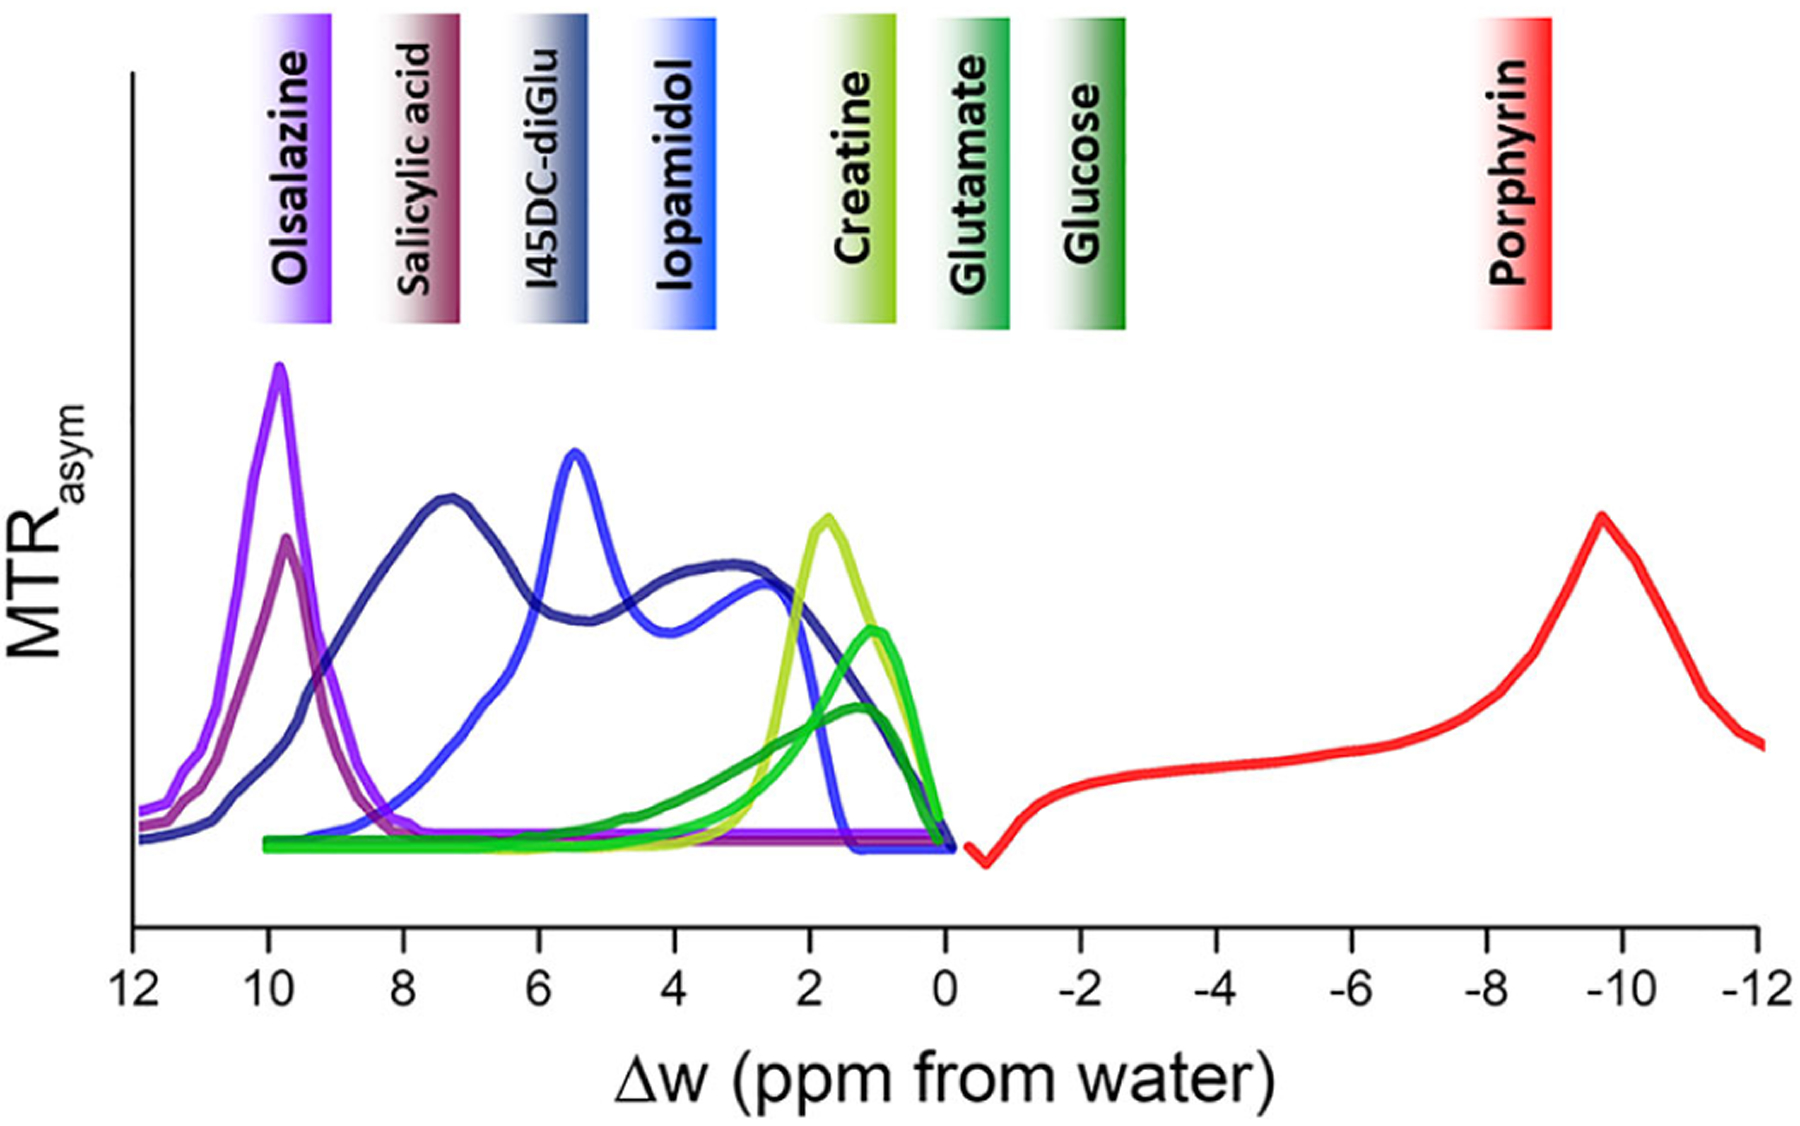
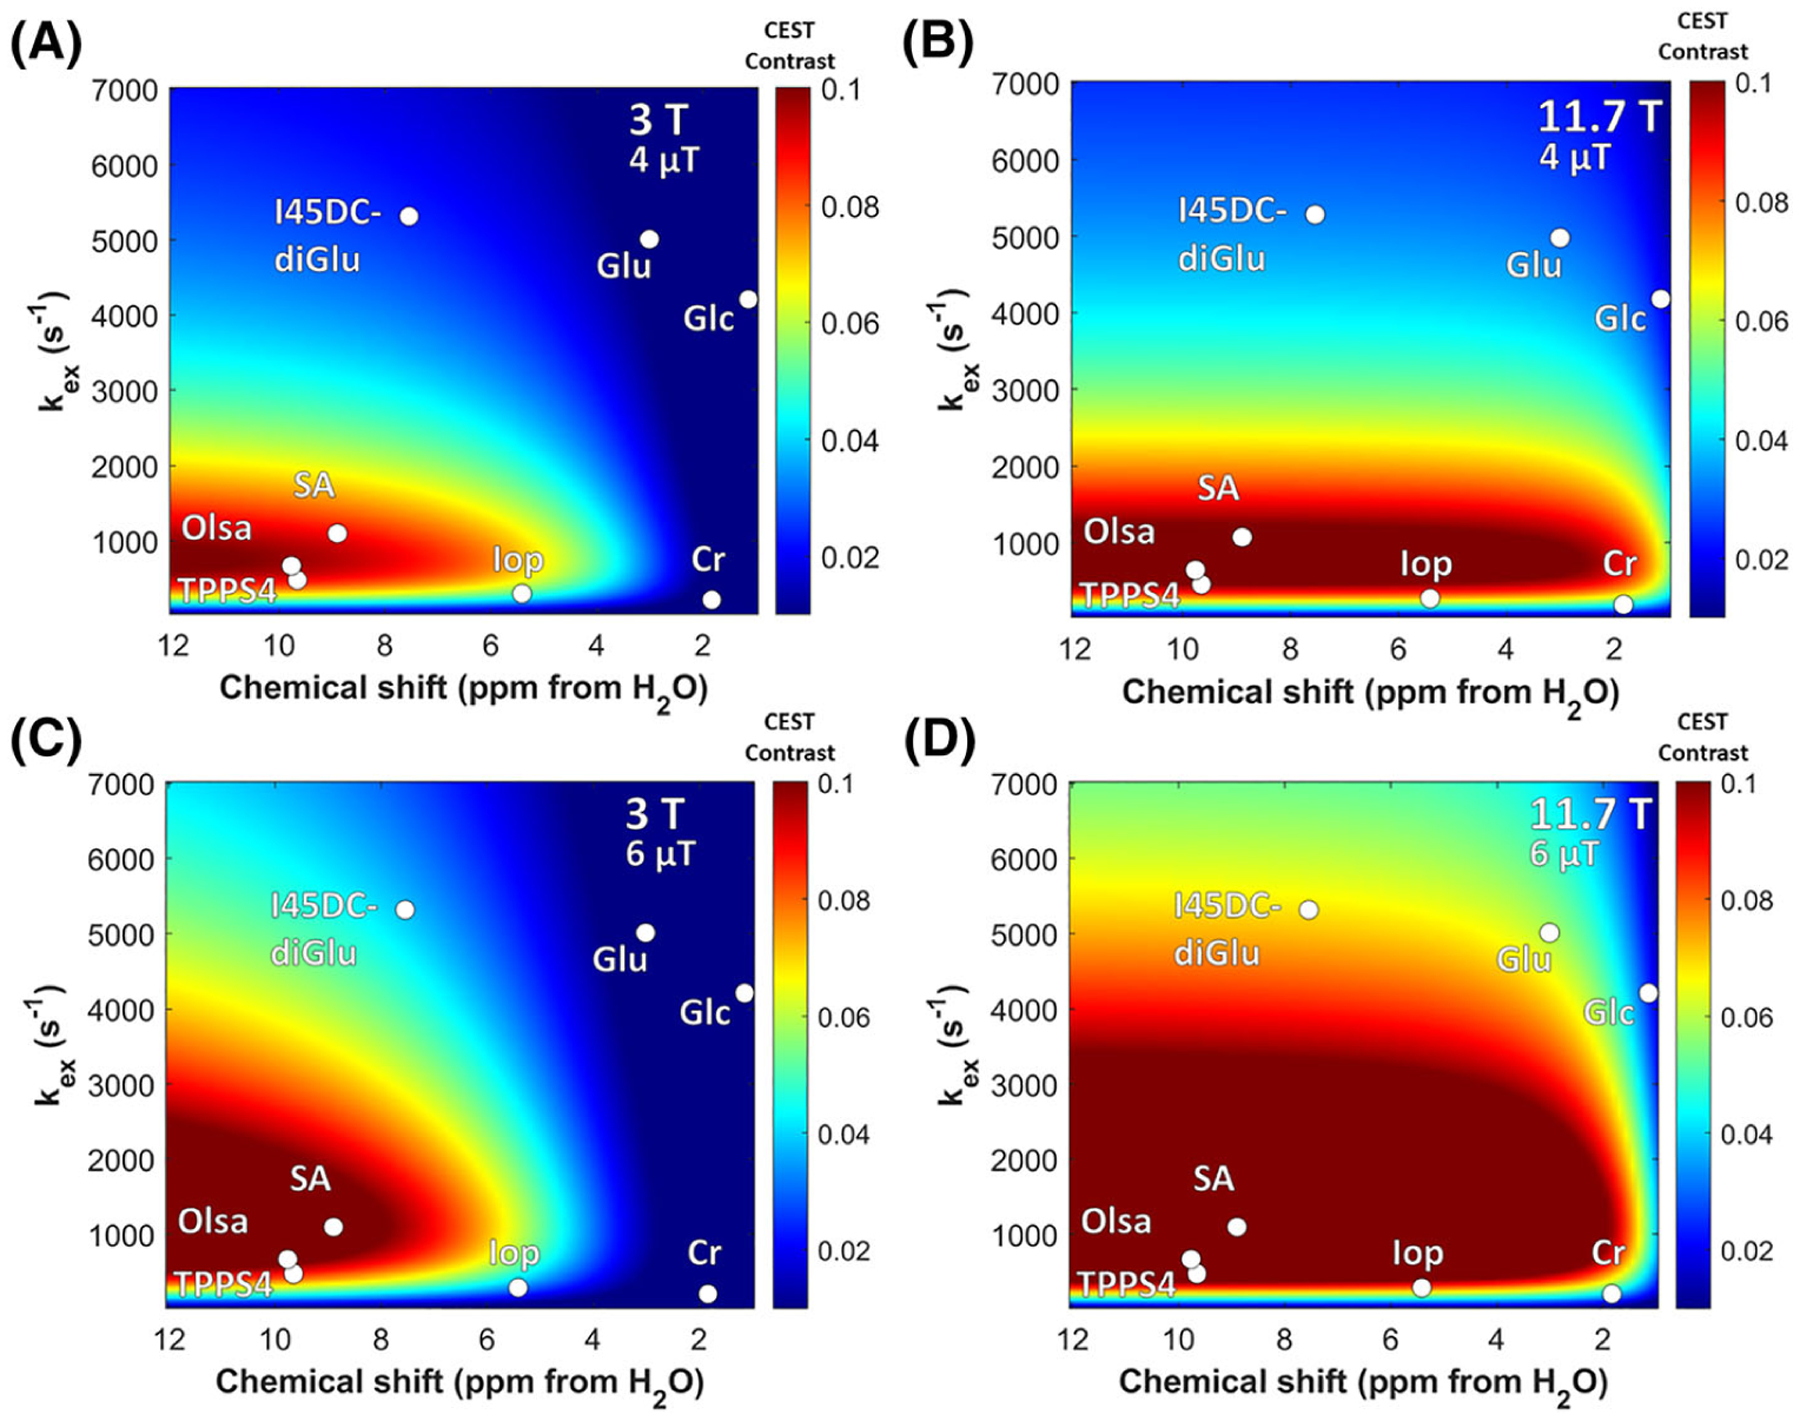
Since the inception of CEST MRI in the 1990s, a number of compounds have been identified as suitable for generating contrast, including paramagnetic lanthanide complexes, hyperpolarized atom cages and, most interesting, diamagnetic compounds. In the past two decades, there has been a major emphasis in this field on the identification and application of diamagnetic compounds that have suitable biosafety profiles for usage in medical applications. Even in the past five years there has been a tremendous growth in their numbers, with more and more emphasis being placed on finding those that can be ultimately used for patient studies on clinical 3 T scanners. At this point, a number of endogenous compounds present in tissue have been identified, and also natural and synthetic organic compounds that can be administered to highlight pathology via CEST imaging. Here we will provide a very extensive snapshot of the types of diamagnetic compound that can generate CEST MRI contrast, together with guidance on their utility on typical preclinical and clinical scanners and a review of the applications that might benefit the most from this new technology.


Figures

FIGURE 1
FIGURE 1
A, Z-spectra (left) and MTRasym (right) as a function of concentration at pH 7.3 for B1 = 1.6 μT. B, Left: GlucoCEST difference map, ΔMTRasym = MTRasym(infusion) − MTRasym(pre-infusion). The intensity of the internal body was thresholded out because it contains moving areas (lungs and heart) that have large magnetic susceptibility differences from surrounding tissues, which complicates difference imaging. Right: the ΔMTRasym profiles of MDA-MB-231 and MCF-7. [Reprinted with permission from Reference 23] C, Top: representative glucoCEST ΔST% maps of 4T1 tumor-bearing mice, before and after treatment. Data are reported as the difference (ΔST%) between the ST effect before and after the intravenous glucose injection. Parametric maps are superimposed on T2w anatomical images, and glucoCEST contrast is shown only in the tumor region. Bottom: graph showing individual GlucoCEST contrast (and mean ± SD) obtained injecting glucose at a 3 g/kg dose via intravenous bolus (n = 6 mice). Data are reported as the variation (ΔST%) between the ST effect post-injection and the ST effect pre-injection. Paired t-test *p = 0.0216. (Reprinted with permission from Reference 26)
FIGURE 2
FIGURE 2
Select salicylate and anthranilate CEST agents. A, Seven of these agents with labile protons resonating between 5 and 12 ppm from water; B, general scaffold for these agents, with MRI properties tolerant to conjugation at R4, R5. (Reprinted from Reference 62)
FIGURE 3
FIGURE 3
Comparison between iopamidol, iobitridol and iopromide ratiometric pH MRI. A, Top: iopamidol chemical structure. Middle: z-spectra for representative pH values of 6, 7 and 8 (B1 = 2.5 μT, TS = 5 s) at room temperature. Bottom: ratiometric CEST analysis is sensitive to pH ranging from 6 to 7.5. (Adapted from Reference .) B, Top: iobitridol chemical structure with a single amide proton group. Middle: CEST spectra of 30 mM iobitridol solution at pH values of 5.5, 6.0 and 7.0. The reduction in MRI signal from bulk water signal upon selective irradiation at 5.6 ppm is pH sensitive (RF saturation power = 3 μT × 5 s, T = 310 K, Bo = 7 T). Bottom: numerically solved pH-dependent chemical exchange rate for labile protons at 5.6 ppm. (Reprinted from Reference .) C, Top: the chemical structure of iopromide. Middle: a CEST spectrum of 200 mM iopromide at pH 6.69 and 37.0 °C with saturation applied at 2 μT for 5 s. Bottom: a log10 ratio of the two CEST effects is linearly correlated with pH from pH 6.3 to pH 7.2. (Reprinted from Reference 73)
FIGURE 4
FIGURE 4
Select azole derivatives analyzed for their CEST properties. (Reprinted from Reference 88)
FIGURE 5
FIGURE 5
Changes in the dynamic CEST signal in PSMA(+) and PSMA(−) tumors. A, T2-weighted image and dynamic CEST maps at 1 ppm after the injection of 375 mg/kg urea–10 kDa dextran (injection volume = 100 μL). B, Mean changes in the CEST signal in PSMA(+) and PSMA(−) tumors in one of the mice for which time dependence was measured. CEST signal enhancement was quantified by ΔMTRasym = MTRasym(t) − MTRasym(t = 0), where the error bars are the standard errors of the CEST signal of all the pixels in each tumor. All CEST images were acquired using a 1.8 μT and 3 s long CW pulse. C, Average CEST signal in the tumor for five mice before (blue) and one hour after (red) the injection of urea-Dex10. The signal difference is shown in black. Error bars are standard deviations of the CEST signal of all five tumors. D, Scatter plots showing the mean changes in CEST signal as quantified by ΔMTRasym(1 h) in each type of tumor (n = 5 and 3 for urea-Dex10 and non-targeted Dex10, respectively). *P < 0.05 (Student’s t-test, two tailed and unpaired). E, In vivo fluorescence image of a representative mouse showing a distinctive tumor uptake of urea-Dex10 at 60 min after injection. F, Sections of PSMA(+) PC3-PIP (top) and PSMA(−) PC3-flu (bottom) tumor stained with anti-PSMA. Images were acquired at ×40 magnification. G, Fluorescence microscopy of nuclei (blue, stained with DAPI) dextran (red, NIR-600 labeled). Scale bar 500 μm for the left three panels and 100 μm for the rightmost panels, which are the zoomed views of the area enclosed in the dashed green box in the image on the left. On the right, a scatter plot shows the comparison of the normalized mean fluorescence intensity of three different fields of view in the tumors. Reproduced from Reference
FIGURE 6
FIGURE 6
Multislice sequence to measure pH in whole organs. A, Two-dimensional multislice tumor pHe map for a breast tumor murine model. B, Three-dimensional pH map rendering. C, Calculated pH gradients along the three main axes inside the left tumor region showing T2-weighted image, superimposed pH map, and pH gradients along the A-axis (red), B-axis (blue) and C-axis (green). (Reprinted with permission from Reference 73)
FIGURE 7
FIGURE 7
Anatomical images of acidic tumor environment and pHe in vivo correlation with lung metastasis. A, Top: anatomical T2w images of TUBO, BALB-neuT, 4T1 and TS/A representative tumors. Bottom: representative tumor pHe maps for TUBO, BALB-neuT, 4T1 and TS/A tumors. B, Acidity score calculated for TUBO, BALB-neuT, 4T1 and TS/A tumors. *P < 0.05; **P < 0.01. C, Correlation between acidity score and number of lung metastases (r2 = 0.91, P < 0.05). (Reprinted with permission from Reference 136)
FIGURE 8
FIGURE 8
CEST-MRI functional information about renal pH homeostasis. A, Barplots of measured CEST-MRI pH values for the whole kidneys. B, Representative pH maps (for baseline, post-3-day and post-1-week groups, respectively) superimposed onto the T2w images, showing neutral pH values for the clamped kidneys. The arrow shows the clamped kidney. (*P < 0.05; ***P < 0.001; t test contralateral versus clamped. ◦◦◦P < 0.001; Bonferroni’s test baseline versus clamped.) (Reprinted with permission from Reference .) C, pH histograms calculated for two representative HP Mut+/− mice and two representative HP Mut−/− mice. For HP Mut+/− mice more than 80% of the detected pixels display a mean pH of 6.50, whereas for HP Mut/ mice (n = 3) an acidic mean pH of 6.10 to 5.83 was observed. D, Time-averaged pH images of Mut+/ and Mut/ controls of HP mice. pH was further lowered to 5.83 for the most severely diseased mice. The pH was distributed over a narrow range of 6.50 ± 0.02 for both RD and HP Mut+/ mice, while this range significantly increased to ±0.30 and ±0.46 along with a decrease in mean pH for HP Mut/ mice. (Reprinted with permission from Reference 142)
FIGURE 9
FIGURE 9
A, Self-assembly of Olsa–RVRR into Olsa–NPs through a series of steps. The red line indicates the site of furin cleavage, and the circled hydroxyl group indicates the exchangeable hydroxyl proton that provides OlsaCEST signal at 9.8 ppm from the water frequency. B, After Olsa–RVRR enters the cytoplasm of high-furin-expressing cells (HCT116 cells in this study), it undergoes reduction by GSH and cleavage of the peptide by furin near the Golgi complex, where cleaved Olsa–RVRR is generated. Amphiphilic oligomers (mostly dimers) are then formed from the click reaction between two cleaved Olsa–RVRR molecules, followed by self-assembly into Olsa–NPs as a result of intermolecular π–π stacking. The intracellular accumulation of Olsa–NPs then serves as a reservoir of Olsa molecule enhancing CEST contrast and inhibiting DNA methylation for tumor therapy. Reprinted from Reference
FIGURE 10
FIGURE 10
CEST MTRasym spectra for common diaCEST agents described in this review
FIGURE 11
FIGURE 11
Simulated CEST contrast as function of labile proton chemical shift Δω and exchange constant kex for the following conditions: A, B0 = 3 T, ω1 = 4 μT; B, B0 = 11.7 T, ω1 = 4 μT; C, B0 = 3 T, ω1 = 6 μT; D, B0 = 11.7 T, ω1 = 6 μT. Simulation parameters: χCA = 10mM, T1w = T1s = 4 s, T2w = T2s = 0.1 s. TPPS4, tetraphenylporphine sulfonate

References

    1. He H, Zhao K, Xiao L, et al. Detection and chiral recognition of α-hydroxyl acid through 1H and CEST NMR spectroscopy using a ytterbium macrocyclic complex. Angew Chem Int Ed. 2019;58(50):18286–18289. - PubMed
    1. Woods M, Woessner DE, Sherry AD. Paramagnetic lanthanide complexes as PARACEST agents for medical imaging. Chem Soc Rev. 2006;35(6): 500–511. - PMC - PubMed
    1. Dorazio SJ, Olatunde AO, Tsitovich PB, Morrow JR. Comparison of divalent transition metal ion paraCEST MRI contrast agents. J Biol Inorg Chem. 2014;19(2):191–205. - PMC - PubMed
    1. Dastrù W, Menchise V, Ferrauto G, et al. Modulation of the prototropic exchange rate in pH-responsive Yb-HPDO3A derivatives as paraCEST agents. ChemistrySelect. 2018;3(22):6035–6041.
    1. Tóth É, Bonnet CS. Responsive ParaCEST contrast agents. Inorganics. 2019;7(5):68.

Publication types