

Effects of resistance training intensity on muscle quantity/quality in middle-aged and older people: a randomized controlled trial
- PMID: 35187867
- PMCID: PMC8977953
- DOI: 10.1002/jcsm.12941
Effects of resistance training intensity on muscle quantity/quality in middle-aged and older people: a randomized controlled trial
Abstract
Background: A sarcopenia diagnosis is confirmed by the presence of low muscle quantity or quality under the 2018 revised definition by the European Working Group on Sarcopenia in Older People 2. Imaging methods [i.e. magnetic resonance imaging (MRI)], dual-energy X-ray absorptiometry (DXA), and bioelectrical impedance analysis are tools to evaluate muscle quantity or quality. The present study aimed to investigate whether and how low-intensity and moderate-intensity resistance training improved both muscle quantity and quality measured by MRI, DXA, and segmental bioelectrical impedance spectroscopy (S-BIS) in middle-aged and older people.
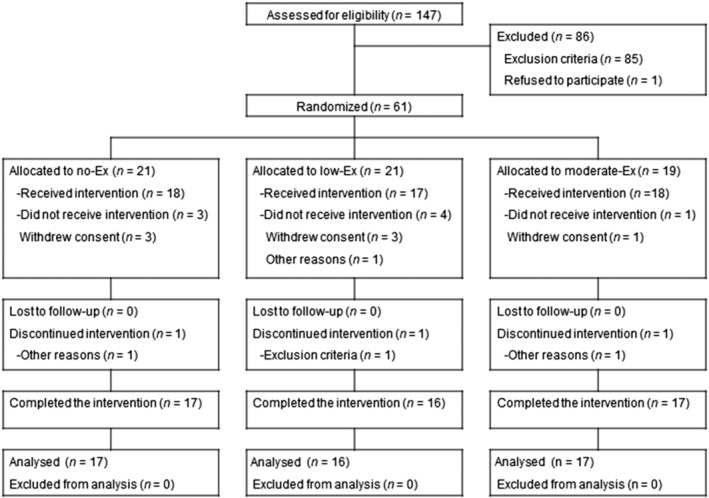
Methods: A single-blind, randomized, controlled trial was conducted. Community-dwelling people aged 50-79 years were randomly allocated to no exercise (no-Ex), low-intensity exercise (low-Ex), and moderate-intensity exercise (moderate-Ex) groups. Participants in the exercise groups performed resistance training for 24 weeks, with loads of 40% and 60% of one repetition maximum in the low-Ex and moderate-Ex groups, respectively. Cross-sectional area (CSA), lean mass, and muscle electrical properties on S-BIS were used to determine the effects of training interventions on muscle quantity and quality of the lower limbs.
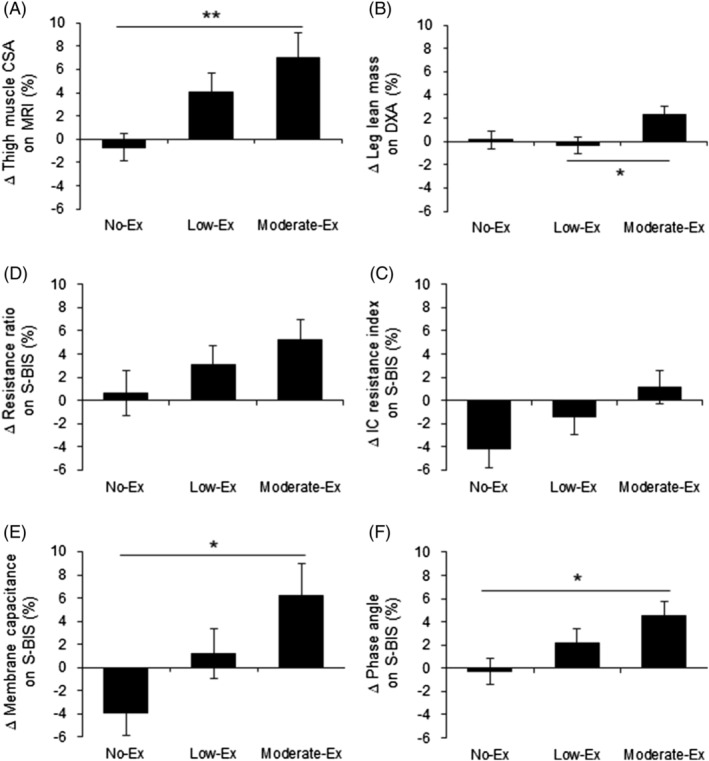
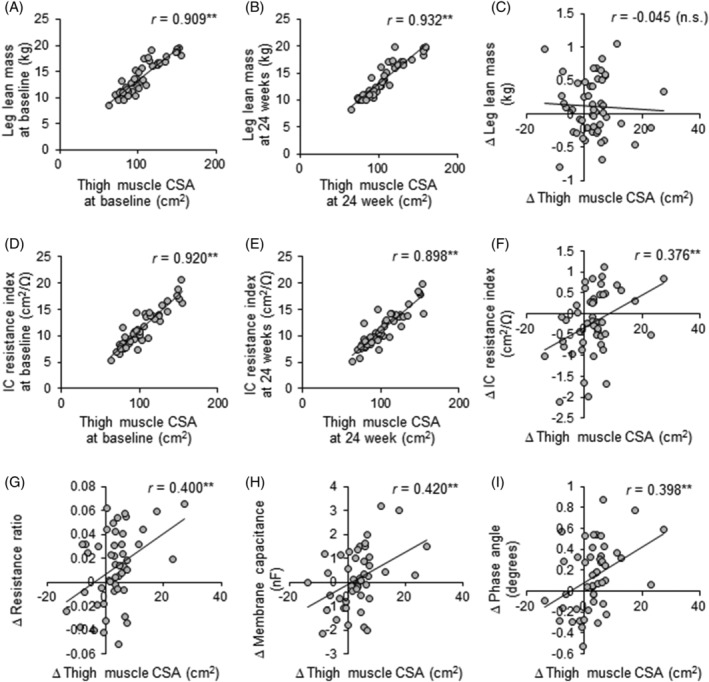
Results: Fifty participants (no-Ex 17, age 63.5 ± 8.5 years, women 47.1%; low-Ex 16, age 63.6 ± 8.1 years, women 50.0%; moderate-Ex 17, age 63.5 ± 8.3 years, women 52.9%) completed the 24 week exercise intervention. For the primary outcome, significant intervention effects were found in thigh muscle CSA on MRI between the moderate-Ex and no-Ex groups (+6.8 cm2 , P < 0.01). Low-Ex for 24 weeks only increased quadriceps CSA (+2.3 cm2 , P < 0.05). The per cent change of thigh muscle CSA (+7.0%, P < 0.01) after 24 week moderate-Ex was higher than that of leg lean mass on DXA (+2.3%, P = 0.088). Moderate-Ex for 24 weeks also improved S-BIS electrical properties related to muscle quantity and quality, including the intracellular resistance index (+0.1 cm2 /Ω, P < 0.05), membrane capacitance (+0.7 nF, P < 0.05), and phase angle (+0.3 deg, P < 0.05); their changes were positively correlated with that of thigh muscle CSA (P < 0.01).
Conclusions: Resistance exercise with moderate intensity improved muscle quantity and quality measured by MRI and S-BIS, whereas that with low intensity only increased muscle quantity in middle-aged and older people. The comparisons among the responses to exercise between the assessment methods indicate the greater value of MRI and S-BIS to measure changes of muscle quantity and quality than of lean mass measured by DXA for assessing the local effects of resistance training.
Keywords: Dual-energy X-ray absorptiometry; Magnetic resonance imaging; Resistance exercise; Segmental bioelectrical impedance spectroscopy.
© 2022 The Authors. Journal of Cachexia, Sarcopenia and Muscle published by John Wiley & Sons Ltd on behalf of Society on Sarcopenia, Cachexia and Wasting Disorders.
Conflict of interest statement
This work was supported by Suntory Wellness Ltd. Y. O., T. I., T. R., and H. S. are employees of Suntory Wellness Ltd., which manufactures and sells health food products. A. M. was an employee of Suntory Global Innovation Center Ltd. Other authors have no conflicts of interest to disclose.
Figures
References
-
- Yamada Y, Masuo Y, Yokoyama K, Hashii Y, Ando S, Okayama Y, et al. Proximal electrode placement improves the estimation of body composition in obese and lean elderly during segmental bioelectrical impedance analysis. Eur J Appl Physiol 2009;107:135–144. - PubMed
-
- Yamada Y, Schoeller DA, Nakamura E, Morimoto T, Kimura M, Oda S. Extracellular water may mask actual muscle atrophy during aging. J Gerontol A Biol Sci Med Sci 2010;65:510–516. - PubMed
Publication types
MeSH terms
LinkOut - more resources
Full Text Sources
Miscellaneous
