. 2022 Feb 21:11:e72837.
doi: 10.7554/eLife.72837.

STAT3-mediated allelic imbalance of novel genetic variant Rs1047643 and B-cell-specific super-enhancer in association with systemic lupus erythematosus

Affiliations

STAT3-mediated allelic imbalance of novel genetic variant Rs1047643 and B-cell-specific super-enhancer in association with systemic lupus erythematosus

Yanfeng Zhang et al. Elife. .

Abstract

Mapping of allelic imbalance (AI) at heterozygous loci has the potential to establish links between genetic risk for disease and biological function. Leveraging multi-omics data for AI analysis and functional annotation, we discovered a novel functional risk variant rs1047643 at 8p23 in association with systemic lupus erythematosus (SLE). This variant displays dynamic AI of chromatin accessibility and allelic expression on FDFT1 gene in B cells with SLE. We further found a B-cell restricted super-enhancer (SE) that physically contacts with this SNP-residing locus, an interaction that also appears specifically in B cells. Quantitative analysis of chromatin accessibility and DNA methylation profiles further demonstrated that the SE exhibits aberrant activity in B cell development with SLE. Functional studies identified that STAT3, a master factor associated with autoimmune diseases, directly regulates both the AI of risk variant and the activity of SE in cultured B cells. Our study reveals that STAT3-mediated SE activity and cis-regulatory effects of SNP rs1047643 at 8p23 locus are associated with B cell deregulation in SLE.

Keywords: STAT3; allelic imbalance; b-lymphocyte; chromatin accessibility; computational biology; genetics; genomics; human; super-enhancer; systemic lupus erythematosus; systems biology.


Conflict of interest statement

YZ, KD, DA No competing interests declared

Figures
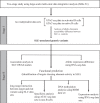
Figure 1.
Figure 1.. Schematic of the study design.
On the basis of the functional genomic data feature, a two-stage study was designed. Summary of data sets is available in Supplementary files 1-2.
Figure 2.
Figure 2.. Change of allelic chromatin accessibility and expression in B cell subtypes from SLE patients and controls.
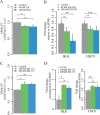
(A) Forest plot showing AI of allelic chromatin state of SNP rs1047643 in both resting naive (rN) and activated (Non-rN) B cells in patients of SLE compared with healthy controls. The p-value per study and combined p-value (summary) are calculated based on the linear regression model and Fisher’s method, respectively. The plot in the right panel displays the 95% of confidence interval of beta-value. (B–C) Boxplots showing allelic expression of SNP rs1047643 in both rN and activated B cells in patients with SLE as compared with healthy individuals. All raw data are available in Figure 2—source data 1.
Figure 2—figure supplement 1.
Figure 2—figure supplement 1.. Change of allelic chromatin accessibility in B cell subtypes from SLE patients and controls.
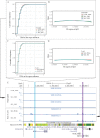
Forest plots showing AI of allelic chromatin state of SNP rs246367 (A) and rs72642993 (B) in both rN and activated (Non-rN) B cells in patients of SLE compared with healthy controls. The plots in the right panel display the 95% of confidence interval of beta-value.
Figure 2—figure supplement 2.
Figure 2—figure supplement 2.. Expression pattern of FDFT1 and BLK across B cell subtypes in patients with SLE and healthy controls.
The data showing expression profiles for FDFT1 (A) and BLK (B) in B cell subtypes were from a case-control study (Accession ID: GSE118254).
Figure 2—figure supplement 3.
Figure 2—figure supplement 3.. Expression pattern of FDFT1 and BLK across B cell subtypes in patients with SLE and healthy controls.
The data showing expression profiles for FDFT1 (A) and BLK (B) in B cell subtypes were from a case-control study (Accession ID: GSE92387).
Figure 3.
Figure 3.. Association analysis and functional prediction of SNP rs1047643.
(A) Association results for the SNP rs1047643 with SLE risk in single marker analyses. MAF, minor allele frequency; OR, odds ratio; CI, confidence interval. Adjusted p-trend: after adjustment for 12 GWAS index SNPs (shown in E) in a logistic regression model. (B) Haplotype analyses of the two SNPs (SNP1: GWAS indexed SNP rs17807624; SNP2: rs1047643) in relation to SLE risk. Baseline (the reference haplotype) represents the alleles associated with a reduced risk in two SNPs. (C) Barplot showing the genomic length of chromHMM-annotated enhancer state on the super-enhancer region (blue highlighted in 3 C) in 43 epigenomes. (D) Plot shows the eQTL result of SNP rs1047643 in whole blood or B cells from three databases (shown in y-axis). (E) Genomic annotations of the SNP rs1047643. The three tracks show locations of 13 GWAS index SNP, gene annotation and 15-state chromatin segments in CD19+ B cells at 8p23 locus, respectively. Vertical blue and purple lines, represents the location of super-enhancer and SNP rs1047643, respectively. (F) Long-range interaction between a super-enhancer and SNP rs1047643. The two tracks show chromatin interactions from two independent studies using whole-genome Hi-C and capture Hi-C technologies, respectively. Orange curves show the interactions between the super-enhancer and the SNP rs1047643. (G) Heatmaps showing the 3D DNA interactions at 8p23.1 locus in eight cell lines. The rectangle represents interactions between the super-enhancer and the SNP rs1047643. All raw data are available in Figure 3—source data 1.
Figure 3—figure supplement 1.
Figure 3—figure supplement 1.. Chromatin interactions with FDFT1 promoter region (marked in green arrow) on 8p23 locus from CHi-C data with duplicates in two types of normal T cells.
Orange arrow represents the location of super-enhancer identified in this study.
Figure 3—figure supplement 2.
Figure 3—figure supplement 2.. Heatmaps of Long-range chromatin interactions from Hi-C data in 8p23 locus at 10 kb (or 20 kb) resolution in a panel of human tissues (n = 9) from the 3D Genome Browser.
The circles shown on heatmaps are the interaction density between SNP rs1047643 and SE region.
Figure 4.
Figure 4.. Aberration of super-enhancer and FDFT1 promoter region in B cell subtypes from SLE patients.
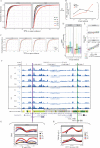
(A) Empirical cumulative distribution of TPM values per 50 bp window across the 7 kb SE region in B cell subsets for disease and control groups. (B) Plots showing the TPM values at the third quartile (Q3) across B cell subtypes as a comparison between SLE and controls. (C) Empirical cumulative distribution of TPM values on the SE region (same as shown in A) in a comparison between two groups across four B cell subtypes. (D) Boxplots showing the TPM values per 50 bp window at the FDFT1 promoter region in B cell subtypes for SLE and controls. The black lines and grey areas represent the linear regression results towards the B cell development from T3 to DN stages, and 95% of CI. (E) Plots showing the correlation between super-enhancer and FDFT1 promoter regions based on mean TPM values with respect to B cell subtypes in SLE and controls. (F) Wiggle plot showing the enrichment of open chromatin states at 8p23.1 locus in B cell subtypes for two individuals (a healthy individual at upper panel, and a patient with SLE at lower panel). Purple and green vertical lines represent the locations for super-enhancer and FDFT1 promoter, respectively. Quantitative comparison of chromatin accessibility states in SE (G) and FDFT1 promoter regions (H) with respect to B cell subtypes. All raw data are available in Figure 4—source data 1.
Figure 4—figure supplement 1.
Figure 4—figure supplement 1.. Genome-wide background analysis of ATAC-seq data.
Left panel: empirical cumulative distribution of TPM values per 50 bp window across randomly selected regions (n = 2,000) in B cell subsets for disease and control groups. Right panel: plots showing the TPM values at the third quartile (Q3) across B cell subtypes as a comparison between SLE and controls.
Figure 4—figure supplement 2.
Figure 4—figure supplement 2.. Aberration of super-enhancer in resting naive B cell subtypes from SLE patients in relation to healthy controls.
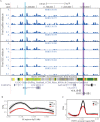
(A) Wiggle plot showing the enrichment of open chromatin states at 8p23.1 locus in resting native B cells from eight individuals. Blue and purple vertical lines represent the locations of SE and FDFT1 promoter, respectively. (B–C) Quantitative comparison of chromatin accessibility states in the SE and FDFT1 promoter regions in naive B cells in a comparison between SLE and controls.
Figure 4—figure supplement 3.
Figure 4—figure supplement 3.. Super-enhancer activity in T and neutrophils from SLE patients and controls.
(A–B) Empirical cumulative distribution of TPM values per 50 bp window and enrichment of ATAC-seq reads (TPM value) across the SE region in neutrophil cell subsets from SLE patients and controls. (C–D) Empirical cumulative distribution of TPM values per 50 bp window and enrichment of ATAC-seq reads (TPM value) across the SE region in two T cell subsets from SLE patients. (E) Wiggle plot showing the enrichment of open chromatin states at 8p23.1 locus in neutrophils and T cells. Blue and purple vertical lines represent the locations of SE and FDFT1 promoter, respectively.
Figure 5.
Figure 5.. Hypomethylation in super-enhancer region in B cell subtypes from SLE patients.
(A) Boxplots showing the CpG methylation levels per 50 bp window in 7 kb SE region in B cell subtypes for SLE and control groups. The black and red lines represent the linear regression results towards the B cell development from rN to DN stages for SLE and controls, respectively. (B) Plots showing the correlation between TPM values (y-axis) and DNA methylation levels (x-axis) averaged over each B cell type in SLE and controls. All raw data are available in Figure 5—source data 1.
Figure 5—figure supplement 1.
Figure 5—figure supplement 1.. DNA methylation comparison across randomly selected regions in B cell subtypes between patients with SLE and controls.
Boxplots showing the CpG methylation levels per 50 bp window in 2000 randomly selected regions in B cell subtypes for SLE and control groups. The black and red lines represent the linear regression results towards the B cell development from rN to DN stages for SLE and controls, respectively.
Figure 6.
Figure 6.. Contribution of STAT3 modulates the enhancer activity and SNP-residing locus in cultured GM11997 cells.
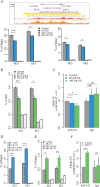
(A) ChIP-qPCR for H3K27ac (left lower panel), H3K4me1 (right lower panel) and pSTAT3 (B) at 8p23 super-enhancer region following 40 μM S3I-201 treatment for 24 hr. Upper panel: UCSC genome browser showing the location of two pairs of qPCR primers (SE5 and SE3) on the SE region (yellow). Two tracks shown below are the enrichment of H3K27ac and H3K4me1 across the SE region. (C) Allelic ChIP-qPCR for pSTAT3 binding on rs1047643 (T vs C alleles) following S3I-201 treatment for 24 hr. (D–E) ChIP-qPCR for H3K27ac (D), and pSTAT3 (E) at 8p23 super-enhancer region following 100 nM ML115 treatment for 6 hr. (F) Allelic ChIP-qPCR for pSTAT3 binding on rs1047643 in cells that have been challenged with ML115 for 6 hr as indicated. Note: the fold changes for the rs1047643-associated BLK and FDFT1 genes in response to small molecules compared to vehicle (0.1% DMSO) as control, which was set as one in all cases, are presented. NS, not significance; *, p < 0.05; **, p < 0.01; ***, p < 0.005.
Figure 6—figure supplement 1.
Figure 6—figure supplement 1.. Quality control of ChIP experiments in GM11997 cells.
Plots showing ChIP-qPCR results for H3K27ac (A and D), H3K4me1 (B and E) and pSTAT3 (C and F) at a negative control (NC) region with the treatment of S3I-201 and ML115, respectively.
Figure 6—figure supplement 2.
Figure 6—figure supplement 2.. Genotyping of SNP rs1047643 in GM11997 genomic DNA using allelic qPCR analysis.
Amplification plots are presented for two alleles.
Figure 6—figure supplement 3.
Figure 6—figure supplement 3.. Validation of STAT3-mediated allelic binding in GM11997 cells.
Plots showing ChIP-qPCR results for pSTAT3 at rs1047643 following 1 μM Cucurbitacin I for 24 hr (A) and 50 ng/ml IL-6 treatment for 1 h (B), respectively. NS, not significance; *, p < 0.05.
Figure 7.
Figure 7.. Expression of two alleles on SNP rs1047643 and its linked genes in cultured cells.
Left panel: allelic RT-qPCR on SNP rs1047643 (T vs C alleles) following S3I-201 (A) and ML115 (C) treatment for 24 hr, respectively. Right panel: RT-qPCR analysis showing the fold changes for the rs1047643-associated BLK and FDFT1 genes in response to different concentrations of S3I-201 (B) and ML115 (D) compared to vehicle (0.1% DMSO) as control, which was set as one in all cases, are presented. *, p < 0.05; **, p < 0.01; ***, p < 0.005.
Figure 7—figure supplement 1.
Figure 7—figure supplement 1.. Expression of two alleles on SNP rs1047643 in B-lymphoblastic cells.
Allelic RT-qPCR in GM11997 cells that have been challenged with S3I-201 for 24 hr (A) and ML115 for 6 hr (B) as indicated, respectively.

References

    1. Avery DT, Deenick EK, Ma CS, Suryani S, Simpson N, Chew GY, Chan TD, Palendira U, Bustamante J, Boisson-Dupuis S, Choo S, Bleasel KE, Peake J, King C, French MA, Engelhard D, Al-Hajjar S, Al-Muhsen S, Magdorf K, Roesler J, Arkwright PD, Hissaria P, Riminton DS, Wong M, Brink R, Fulcher DA, Casanova J-L, Cook MC, Tangye SG. B cell-intrinsic signaling through IL-21 receptor and STAT3 is required for establishing long-lived antibody responses in humans. The Journal of Experimental Medicine. 2010;207:155–171. doi: 10.1084/jem.20091706. - DOI - PMC - PubMed
    1. Beck T, Shorter T, Brookes AJ. GWAS Central: a comprehensive resource for the discovery and comparison of genotype and phenotype data from genome-wide association studies. Nucleic Acids Research. 2020;48:D933–D940. doi: 10.1093/nar/gkz895. - DOI - PMC - PubMed
    1. Bentham J, Morris DL, Graham DSC, Pinder CL, Tombleson P, Behrens TW, Martín J, Fairfax BP, Knight JC, Chen L, Replogle J, Syvänen A-C, Rönnblom L, Graham RR, Wither JE, Rioux JD, Alarcón-Riquelme ME, Vyse TJ. Genetic association analyses implicate aberrant regulation of innate and adaptive immunity genes in the pathogenesis of systemic lupus erythematosus. Nature Genetics. 2015;47:1457–1464. doi: 10.1038/ng.3434. - DOI - PMC - PubMed
    1. Blaskovich MA, Sun J, Cantor A, Turkson J, Jove R, Sebti SM. Discovery of JSI-124 (cucurbitacin I), a selective Janus kinase/signal transducer and activator of transcription 3 signaling pathway inhibitor with potent antitumor activity against human and murine cancer cells in mice. Cancer Research. 2003;63:1270–1279. - PubMed
    1. Buniello A, MacArthur JAL, Cerezo M, Harris LW, Hayhurst J, Malangone C, McMahon A, Morales J, Mountjoy E, Sollis E, Suveges D, Vrousgou O, Whetzel PL, Amode R, Guillen JA, Riat HS, Trevanion SJ, Hall P, Junkins H, Flicek P, Burdett T, Hindorff LA, Cunningham F, Parkinson H. The NHGRI-EBI GWAS Catalog of published genome-wide association studies, targeted arrays and summary statistics 2019. Nucleic Acids Research. 2019;47:D1005–D1012. doi: 10.1093/nar/gky1120. - DOI - PMC - PubMed

Publication types

Substances