. 2022 Feb 21:11:e75132.
doi: 10.7554/eLife.75132.

P2Y1 purinergic receptor identified as a diabetes target in a small-molecule screen to reverse circadian β-cell failure

Affiliations

P2Y1 purinergic receptor identified as a diabetes target in a small-molecule screen to reverse circadian β-cell failure

Biliana Marcheva et al. Elife. .

Abstract

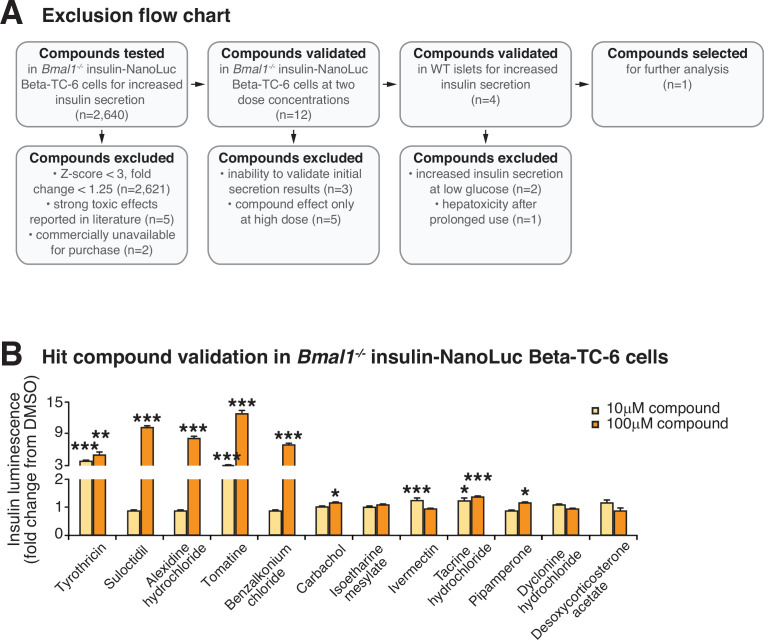
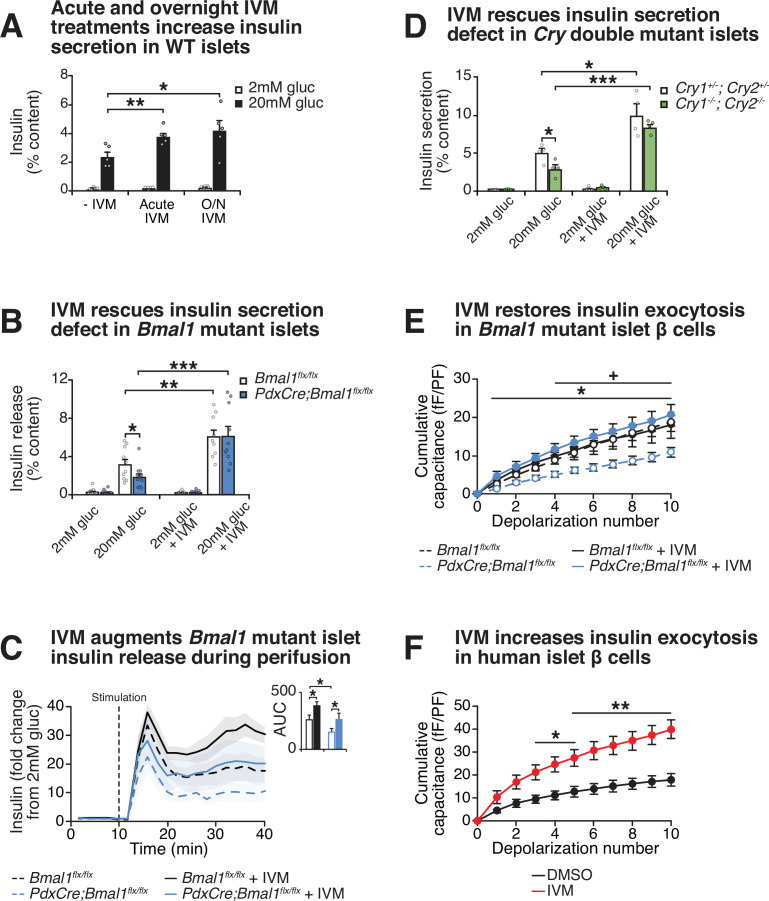
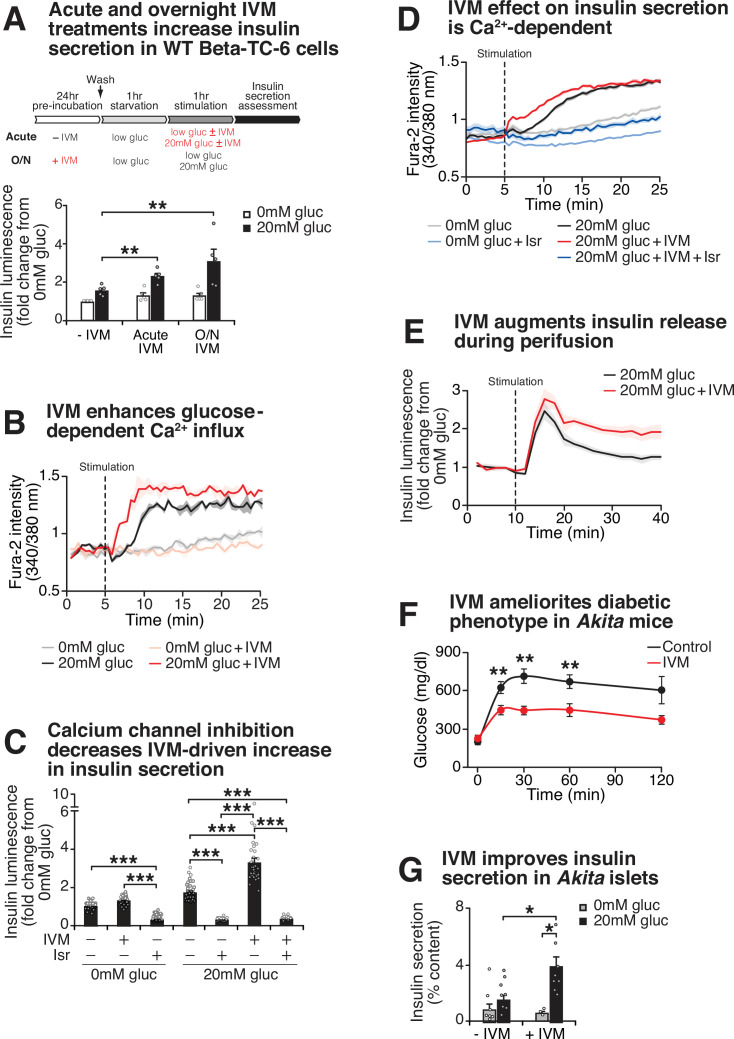
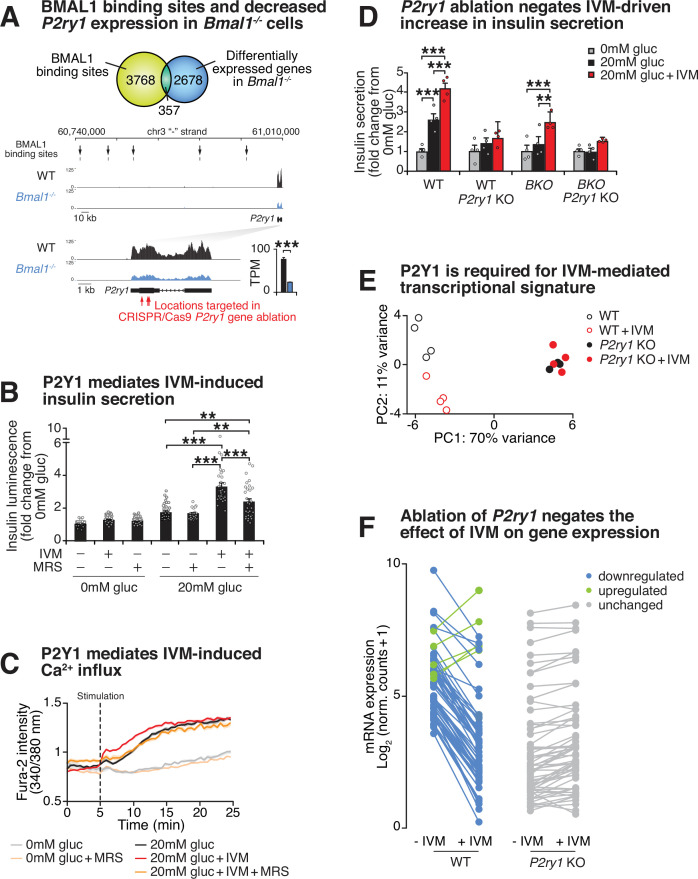
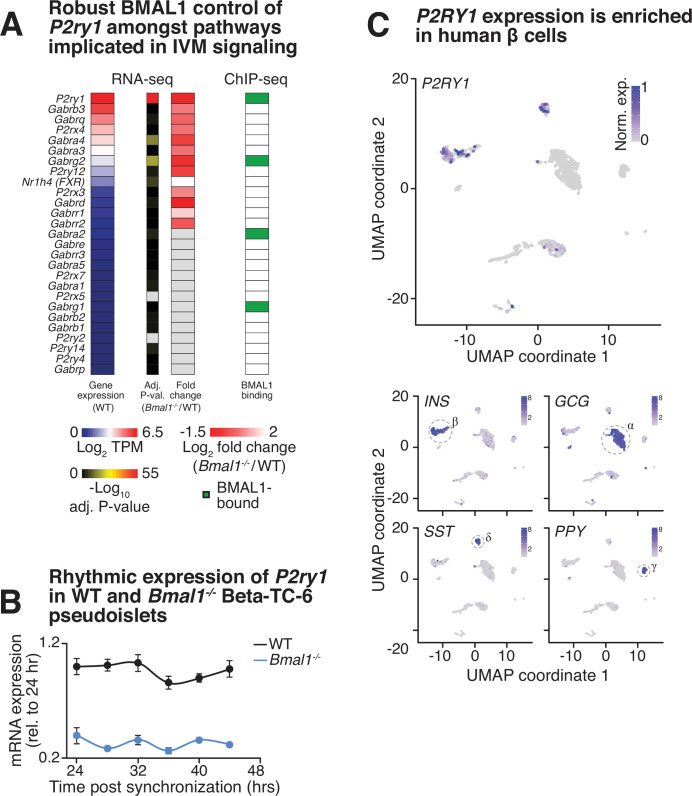
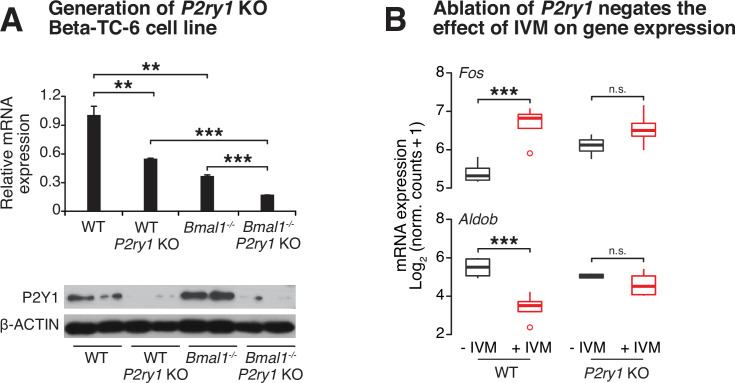
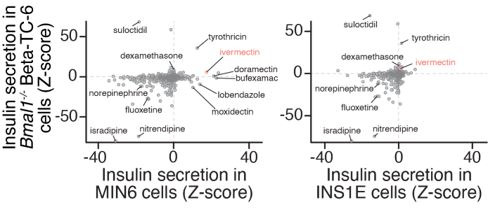
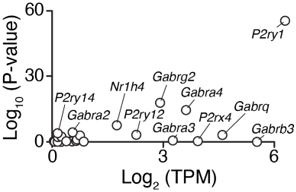
The mammalian circadian clock drives daily oscillations in physiology and behavior through an autoregulatory transcription feedback loop present in central and peripheral cells. Ablation of the core clock within the endocrine pancreas of adult animals impairs the transcription and splicing of genes involved in hormone exocytosis and causes hypoinsulinemic diabetes. Here, we developed a genetically sensitized small-molecule screen to identify druggable proteins and mechanistic pathways involved in circadian β-cell failure. Our approach was to generate β-cells expressing a nanoluciferase reporter within the proinsulin polypeptide to screen 2640 pharmacologically active compounds and identify insulinotropic molecules that bypass the secretory defect in CRISPR-Cas9-targeted clock mutant β-cells. We validated hit compounds in primary mouse islets and identified known modulators of ligand-gated ion channels and G-protein-coupled receptors, including the antihelmintic ivermectin. Single-cell electrophysiology in circadian mutant mouse and human cadaveric islets revealed ivermectin as a glucose-dependent secretagogue. Genetic, genomic, and pharmacological analyses established the P2Y1 receptor as a clock-controlled mediator of the insulinotropic activity of ivermectin. These findings identify the P2Y1 purinergic receptor as a diabetes target based upon a genetically sensitized phenotypic screen.

Keywords: cell biology; circadian clock; diabetes; high-throughput screen; human; insulin; ivermectin; mouse; purinergic receptor.

Plain language summary

Circadian rhythms – ‘inbuilt’ 24-hour cycles – control many aspects of behaviour and physiology. In mammals, they operate in nearly all tissues, including those involved in glucose metabolism. Recent studies have shown that mice with faulty genes involved in circadian rhythms, the core clock genes, can develop diabetes. Diabetes arises when the body struggles to regulate blood sugar levels. In healthy individuals, the hormone insulin produced by beta cells in the pancreas regulates the amount of sugar in the blood. But when beta cells are faulty and do not generate sufficient insulin levels, or when insulin lacks the ability to stimulate cells to take up glucose, diabetes can develop. Marcheva, Weidemann, Taguchi et al. wanted to find out if diabetes caused by impaired clock genes could be treated by targeting pathways regulating the secretion of insulin. To do so, they tested over 2,500 potential drugs on genetically modified beta cells with faulty core clock genes. They further screened the drugs on mice with the same defect in their beta cells. Marcheva et al. identified one potential compound, the anti-parasite drug ivermectin, which was able to restore the secretion of insulin. When ivermectin was applied to both healthy mice and mice with faulty beta cells, the drug improved the control over glucose levels by activating a specific protein receptor that senses molecules important for storing and utilizing energy. The findings reveal new drug targets for treating forms of diabetes associated with deregulation of the pancreatic circadian clock. The drug screening strategy used in the study may also be applied to reveal mechanisms underlying other conditions associated with disrupted circadian clocks, including sleep loss and jetlag.


Conflict of interest statement

BM, BW, AT, KR, MN, YK, CO, JM, HL, PM, JB No competing interests declared, MP Mark Perelis is affiliated with Ionis Pharmaceuticals, Inc The author has no financial interests to declare

Figures

Figure 1.
Figure 1.. High-throughput screen for chemical modulators of insulin secretion in circadian mutant β-cells.
(A) Flow chart of ‘phenotype’-driven cell-based genetic screening platform to identify molecules and pathways that enhance insulin secretion during circadian β-cell failure. (B) Schematic of insulin-NanoLuciferase (NanoLuc) fusion construct, with bioluminescence detected in the supernatant as a proxy for insulin secretion. (C) Correlation between insulin-NanoLuc bioluminescence and insulin values measured by ELISA in response to a range of glucose concentrations (2–20 mM; R2 = 0.8937). (D) Insulin-NanoLuc bioluminescence following 1 hr exposure to 20 mM glucose, 30 mM KCl, and 20 mM glucose plus 2.5 µM forskolin, 500 µM 3-isobutyl-1-methylxanthine (IBMX), or 10 µM phorbol 12-myristate 13-acetate (PMA) in WT and Bmal1-/- insulin-NanoLuc Beta-TC-6 cells (n = 3–10 experimental repeats/condition). (E) Drug screen design. Insulin-NanoLuc-expressing Beta-TC-6 Bmal1-/- cells were plated in nine 384-well plates prior to exposure to 10 µM of each of the 2640 compounds from the Spectrum Collection in combination with 20 mM glucose. Negative (20 mM glucose alone) and positive (20 mM glucose plus 10 µM PMA) controls were included on each plate. (F) Drug screen feasibility test comparing negative (20 mM glucose only) and positive (20 mM glucose plus PMA) controls (n = 3 experimental repeats) (Z'-factor = 0.69). All values represent mean ± SEM. *p<0.05, ***p<0.001.
Figure 2.
Figure 2.. Identification and validation of high-throughput screen lead compounds in murine islets at high and low glucose concentrations.
(A) Significant Z-scores (>3 standard deviations) and fold changes (>1.25-fold increase) for all 2640 screened compounds, with hit compounds indicated in blue. (B) Top 12 hit compounds identified from screen with a fold increase > 1.25 and a Z-score > 3, which were selected for further analysis. Known functions and published molecular pathways targeted by these compounds are indicated. (C) Model of potential mechanisms of action of the top 12 hit compounds to affect insulin secretion in the β-cell. (D) Glucose-responsive insulin secretion by ELISA at 2 mM and 20 mM glucose in WT mouse islets following exposure to four lead candidate compounds (n = 3–11 mice/compound). (E) Ivermectin (IVM) dose-response curve (n = 6–8 experimental repeats/dose), ranging from 0.078 µM to 80 µM IVM, in insulin-NanoLuciferase-expressing Beta-TC-6 cells. Shaded area represents 95% confidence intervals for the LOESS curve. All values represent mean ± SEM. **p<0.01, ***p<0.001.
Figure 2—figure supplement 1.
Figure 2—figure supplement 1.. High-throughput screen for modulators of insulin secretion in circadian mutant β-cells and validation of lead compounds.
(A) Compound exclusion flow chart delineating exclusion criteria and numbers of compounds excluded at each validation step. (B) Hit compound validation at concentrations of 10 and 100 µM in Bmal1-/- insulin-NanoLuciferase cells (n = 3/compound). All values represent mean ± SEM. *p<0.05, **p<0.01, ***p<0.001.
Figure 3.
Figure 3.. Effect of lead compound ivermectin (IVM) on glucose-stimulated insulin exocytosis and calcium flux from WT and circadian mutant β-cells.
(A) Insulin secretion (expressed as % content) assessed by ELISA at 2 mM and 20 mM glucose in WT mouse islets in response to 1 hr 10 µM IVM treatment or 24 hr 10 µM IVM pretreatment (n = 5 mice). Data was analyzed by two-way ANOVA and false discovery rate (FDR) correction for multiple testing. (B) Insulin secretion as assessed by ELISA from islets isolated from 8-month-old pancreas-specific Bmal1 knockout and Bmal1flx/flx mice in the presence or absence of 10 µM IVM (n = 10–11 mice/genotype). (C) Perifusion analysis of insulin secretion in islets from pancreas-specific Bmal1 knockout (PdxCre;Bmal1flx/flx) and Bmal1flx/flx mice in response to 10 µM IVM in the presence of 20 mM glucose (n = 3 mice/genotype). (D) Insulin secretion as assessed by ELISA from islets isolated from 9- to 12-month-old male Cry1-/-;Cry2-/- knockout and Cry1+/-;Cry2+/- heterozygous control mice in the presence or absence of ± µM IVM (n = 4 mice/genotype). (E) Capacitance measurements in β-cells from PdxCre;Bmal1flx/flx and Bmal1flx/flx mouse islets treated with 10 µM IVM (n = 4–5 mice/genotype, 5–16 cells per mouse). Asterisks denote significance between PdxCre;Bmal1flx/flx and PdxCre;Bmal1flx/flx + IVM; plus symbols denote significance between Bmal1flx/flx and PdxCre;Bmal1flx/flx for all depolarization numbers indicated. */+ p<0.05. (F) Capacitance measurements in β-cells from human islets treated with 10 µM IVM (n = 3 donors, 7–11 cells per donor). Capacitance and calcium data were analyzed by two-way repeated-measures ANOVA with Bonferroni correction for multiple testing. All values represent mean ± SEM. *p<0.05, **p<0.01, ***p<0.001.
Figure 3—figure supplement 1.
Figure 3—figure supplement 1.. Ivermectin (IVM) improves insulin exocytosis in diabetic mice.
(A) Insulin-NanoLuciferase (insulin-Nano-Luc) bioluminescence at 0 mM and 20 mM glucose in WT Beta-TC-6 cells in response to 1 hr 10 µM IVM treatment or 24 hr 10 µM IVM pretreatment (n = 5 experiments, 3–24 experimental repeats/experiment). Data was analyzed by two-way ANOVA and false discovery rate (FDR) correction for multiple testing. (B) Ratiometric determination of intracellular Ca2+ using Fura2-AM dye in WT Beta-TC-6 cells stimulated in the presence or absence of 10 µM IVM (n = 3 experimental repeats/condition). (C) Insulin secretion in pseudoislets from WT insulin-NanoLuc-expressing Beta-TC-6 cells in response to 10 µM IVM and 5 µM isradipine (isr) (n = 3–8 experiments, 3–16 experimental repeats/experiment). p-Values were determined by Tukey’s multiple comparison tests following one-way ANOVA. (D) Ratiometric determination of intracellular Ca2+ using Fura2-AM dye in WT Beta-TC-6 cells stimulated with IVM or isr (n = 3–8 experiments, 4–16 experimental repeats/experiment). (E) Perifusion analysis of insulin secretion from WT insulin-NanoLuc pseudoislets in response to 10 µM IVM in the presence of 20 mM glucose (n = 6 experimental repeats/condition). (F) Glucose levels at the indicated time points following an intraperitoneal injection of glucose (2 g/kg body weight) at ZT2 after 14 days of daily intraperitoneal injections with 1.3 mg/kg body weight of IVM (n = 8 mice/genotype). Glucose levels were analyzed by two-way repeated-measures ANOVA with Bonferroni multiple testing. (G) Insulin secretion as assessed by ELISA from islets isolated from 4-month-old Akita mice in the presence or absence of 10 μM IVM (n = 5–6 mice/genotype). All values represent mean ± SEM. **p<0.01, ***p<0.001.
Figure 4.
Figure 4.. Purinergic receptor P2Y1 is required for ivermectin (IVM) to augment insulin exocytosis.
(A) Venn diagram of BMAL1 binding sites identified by ChIP-sequencing overlapping with differentially expressed genes identified by RNA-sequencing in Bmal1-/-β-cell line compared to control cell line (top). Browser tracks and bar graph showing decreased expression of P2ry1 gene in Bmal1-/- cells compared to controls. BMAL1 binding sites upstream of the P2ry1 gene are also indicated (bottom). (B) Bioluminescence from WT insulin-NanoLuciferase pseudoislets in response to 10 µM IVM and/or 10 µM of the P2Y1 antagonist MRS2179 (n = 3–8 experiments, 3–15 experimental repeats/experiment). (C) Ratiometric determination of intracellular Ca2+ using Fura2-AM dye in WT Beta-TC-6 cells stimulated in the presence or absence of 10 µM IVM (n = 3–7 experiments, 4–19 experimental repeats/experiment). (D) Insulin secretion by ELISA in pseudoislets from P2ry1 KOs and control WT and Bmal1-/- Beta-TC-6 cells (n = 4 experiments, two experimental repeats/experiment). p-Values were determined by Tukey’s multiple comparison tests following two-way ANOVA. (E) First two principal components (PC1 and PC2) following unbiased principal component analysis (PCA) of DESeq2 normalized counts in WT, WT + IVM, P2yr1 KO, and P2yr1 KO cells (n = 4 per group). (F) Mean log2-transformed DESeq2-normalized counts in WT, WT + IVM, P2yr1 KO, and P2yr1 KO cells (n = 4 per group) at differentially expressed (1.5-fold, adjusted p-value<0.05) transcripts identified between WT and WT + IVM treated cells. All values represent mean ± SEM. *p<0.05, **p<0.01, ***p<0.001.
Figure 4—figure supplement 1.
Figure 4—figure supplement 1.. Evidence for circadian control of P2ry1.
(A) mRNA abundance (transcripts per million [TPM]) in WT β-cells (left), DESeq2-adjusted p-values from differential expression analysis in Bmal1-/- versus WT β-cells (middle left), fold change in expression in Bmal1-/- versus WT β-cells (middle right), and presence or absence of an annotated BMAL1 binding site near genes of putative ivermectin (IVM) targets (right). (B) Rhythmic expression of P2ry1 gene in synchronized pseudoislets from WT Beta-TC-6 cells as assessed by quantitative real-time PCR (n = 3) (false discovery rate (FDR)-adjusted p-value<0.05). (C) Uniform manifold approximation and projection (UMAP) clustering analysis of single-cell expression values in single human islet cells isolated from type 2 diabetic and healthy subjects highlights distinct transcriptional profiles of β, α, δ, and γ cells marked by high levels of insulin (INS), glucagon (GCG), somatostatin (SST), or pancreatic polypeptide (PPY) mRNA, respectively. P2RY1 expression is enriched in β and δ cells, and grossly excluded from α and γ cells.
Figure 4—figure supplement 2.
Figure 4—figure supplement 2.. Genetic ablation of purinergic receptor P2Y1 in Beta-TC-6 cells blunts effect of ivermectin (IVM) on gene expression.
(A) Quantitative real-time PCR screening for disruption of P2ry1 gene expression (n = 3–4/genotype) (top). Decreased P2Y1 receptor protein expression by Western blot in WT and Bmal1-/- Beta-TC-6 cells after genetic disruption (bottom). (B) Loss of effect of IVM on gene expression in P2ry1 mutant β-cells identified by RNA-sequencing (n = 4/genotype/condition). Dots represent values that exceed 1.5-fold of the interquartile range. All values represent mean ± SEM. *p<0.05, **p<0.01, ***p<0.001. See Figure 4—figure supplement 2—source data 1 and Figure 4—figure supplement 2—source data 2.
Author response image 1.
Author response image 1.. Comparison of our circadian small molecule screen to Burns et al.
, 2015 screen. The hits from each screen were compared by analyzing Z-scores, which reflect the compounds’ insulin-secretory effects on Bmal1-/- Β-TC-6 cells (our screen) versus the cell-types used by Burns et al., wild-type MIN6 (left) and INS1E cells (right), in the presence of glucose.
Author response image 2.
Author response image 2.. Robust differential expression of P2ry1 following BMAL1 ablation.
The P2ry1 transcript is one of the most abundant receptors in the broad class of putative IVM targets and was identified following BMAL1 ablation as one of the most consistently and highly repressed transcripts (Adj. P < 10-55).

Similar articles

Cited by

References

    1. Alvarez-Dominguez JR, Donaghey J, Rasouli N, Kenty JHR, Helman A, Charlton J, Straubhaar JR, Meissner A, Melton DA. Circadian Entrainment Triggers Maturation of Human In Vitro Islets. Cell Stem Cell. 2020;26:108–122. doi: 10.1016/j.stem.2019.11.011. - DOI - PubMed
    1. Arrojo E Drigo R, Roy B, MacDonald PE. Molecular and functional profiling of human islets: from heterogeneity to human phenotypes. Diabetologia. 2020;63:2095–2101. doi: 10.1007/s00125-020-05159-8. - DOI - PubMed
    1. Balasubramanian R, Ruiz de Azua I, Wess J, Jacobson KA. Activation of distinct P2Y receptor subtypes stimulates insulin secretion in MIN6 mouse pancreatic beta cells. Biochemical Pharmacology. 2010;79:1317–1326. doi: 10.1016/j.bcp.2009.12.026. - DOI - PMC - PubMed
    1. Berjukow S, Marksteiner R, Gapp F, Sinnegger MJ, Hering S. Molecular mechanism of calcium channel block by isradipine. Role of a drug-induced inactivated channel conformation. The Journal of Biological Chemistry. 2000;275:22114–22120. doi: 10.1074/jbc.M908836199. - DOI - PubMed
    1. Bierman CW. Adrenergic drugs. Clinical Reviews in Allergy. 1983;1:87–104. doi: 10.1007/BF02991319. - DOI - PubMed

Publication types

MeSH terms

Associated data