. 2022 Mar 8;94(9):3888-3896.
doi: 10.1021/acs.analchem.1c04870. Epub 2022 Feb 21.

Enhanced Top-Down Protein Characterization with Electron Capture Dissociation and Cyclic Ion Mobility Spectrometry

Affiliations

Enhanced Top-Down Protein Characterization with Electron Capture Dissociation and Cyclic Ion Mobility Spectrometry

Jared B Shaw et al. Anal Chem. .

Abstract

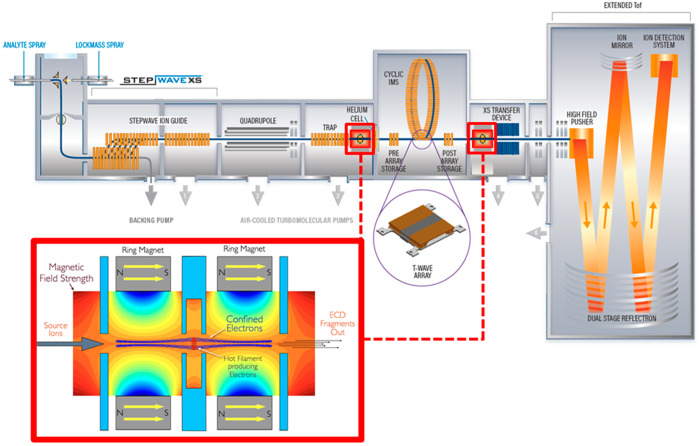
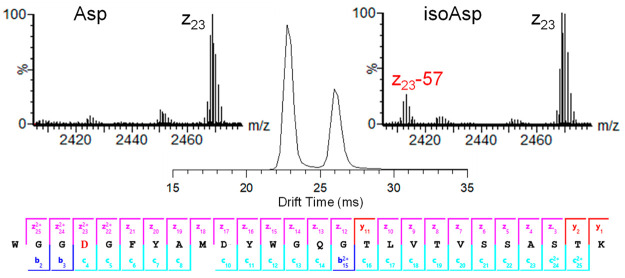
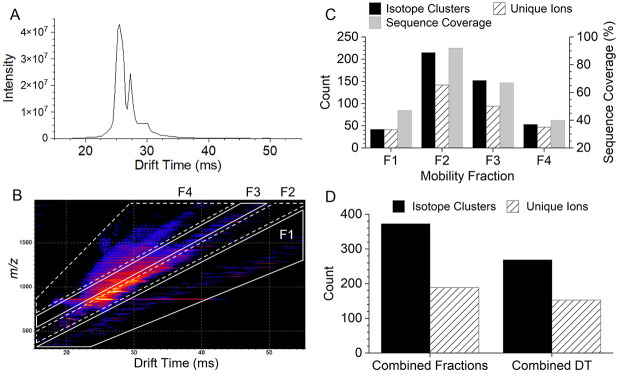
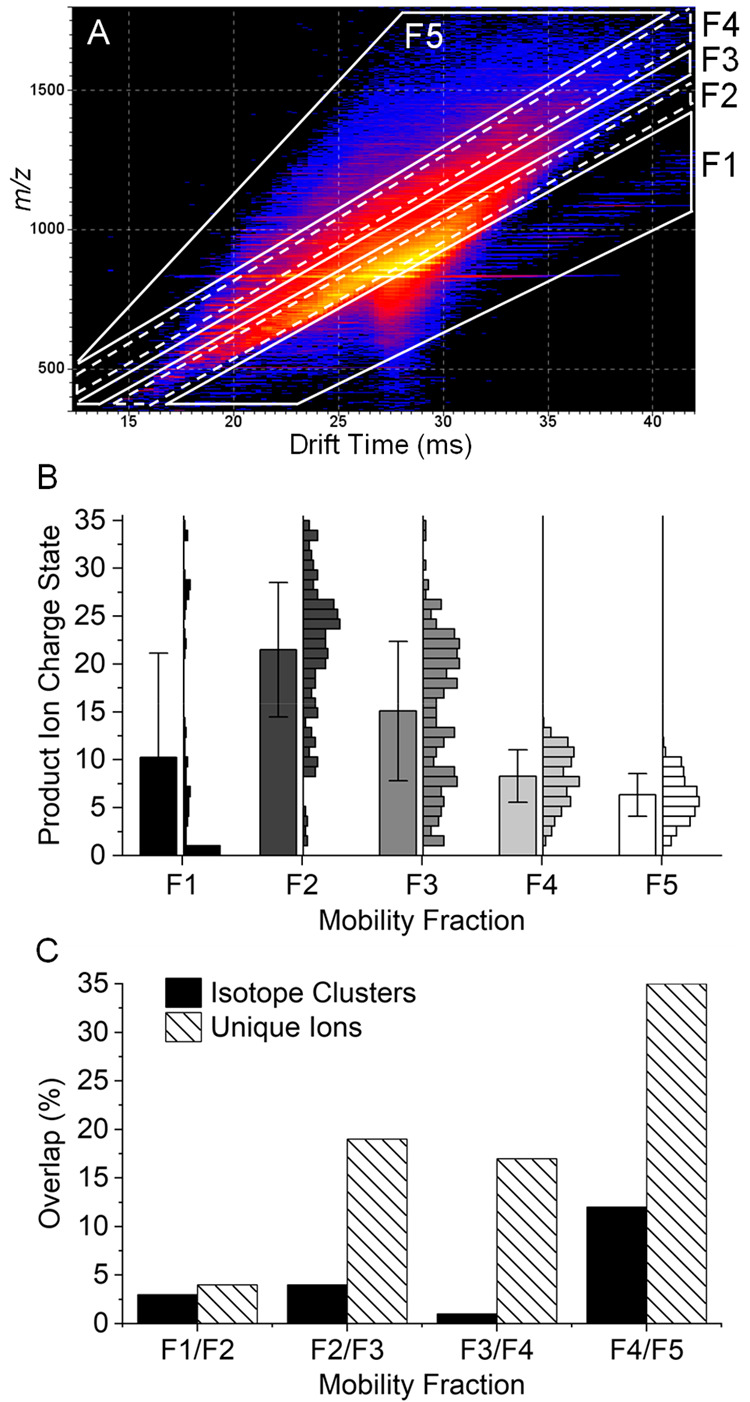
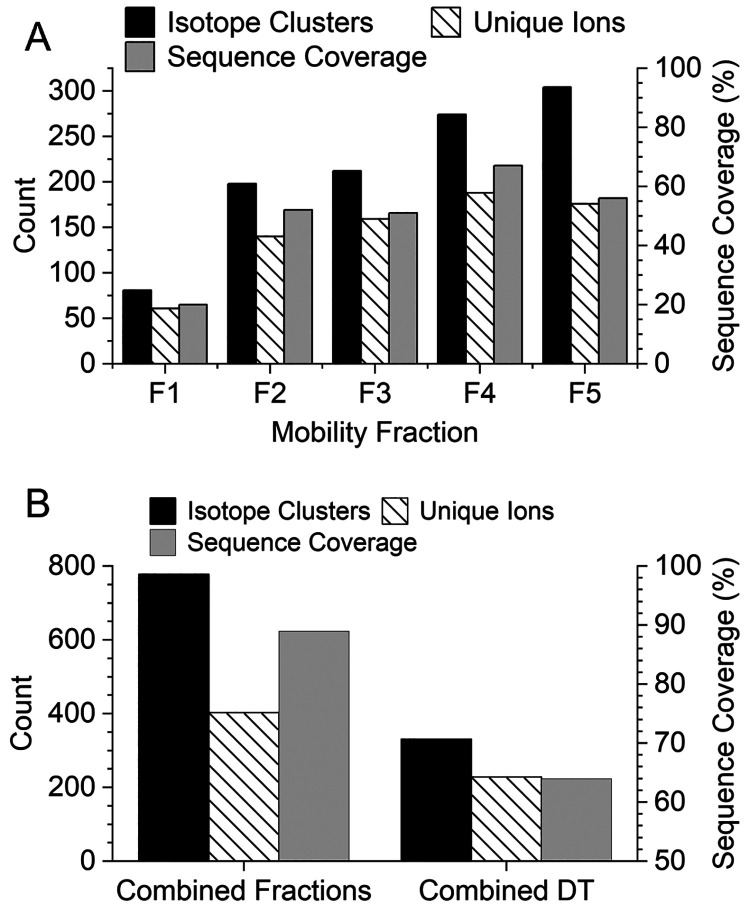
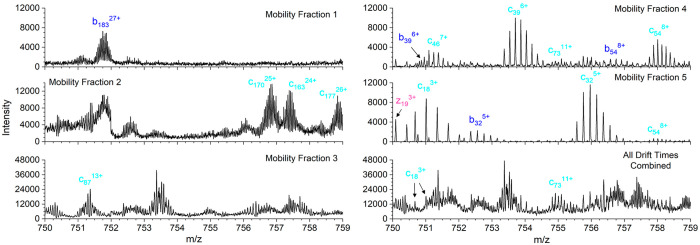
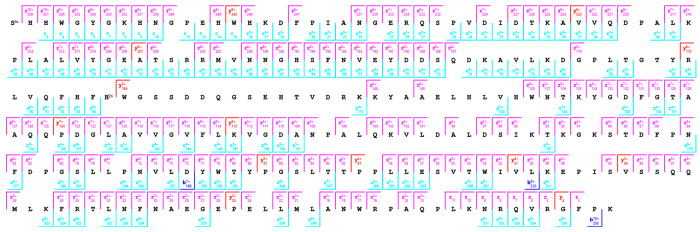
Tandem mass spectrometry of denatured, multiply charged high mass protein precursor ions yield extremely dense spectra with hundreds of broad and overlapping product ion isotopic distributions of differing charge states that yield an elevated baseline of unresolved "noise" centered about the precursor ion. Development of mass analyzers and signal processing methods to increase mass resolving power and manipulation of precursor and product ion charge through solution additives or ion-ion reactions have been thoroughly explored as solutions to spectral congestion. Here, we demonstrate the utility of electron capture dissociation (ECD) coupled with high-resolution cyclic ion mobility spectrometry (cIMS) to greatly increase top-down protein characterization capabilities. Congestion of protein ECD spectra was reduced using cIMS of the ECD product ions and "mobility fractions", that is, extracted mass spectra for segments of the 2D mobiligram (m/z versus drift time). For small proteins, such as ubiquitin (8.6 kDa), where mass resolving power was not the limiting factor for characterization, pre-IMS ECD and mobility fractions did not significantly increase protein sequence coverage, but an increase in the number of identified product ions was observed. However, a dramatic increase in performance, measured by protein sequence coverage, was observed for larger and more highly charged species, such as the +35 charge state of carbonic anhydrase (29 kDa). Pre-IMS ECD combined with mobility fractions yielded a 135% increase in the number of annotated isotope clusters and a 75% increase in unique product ions compared to processing without using the IMS dimension. These results yielded 89% sequence coverage for carbonic anhydrase.


Conflict of interest statement

The authors declare the following competing financial interest(s): J.B.S., J.S.B., and V.G.V. are employed by e-MSion, Inc. who manufactures ExD devices for sale; D.A.C.-S., D.H., J.L.W., and J.I.L. are employed by Waters Corporation who manufactures the SELECT SERIES Cyclic IMS instrumentation for sale.

Figures

Figure 1
Figure 1
Schematic of the Waters SELECT SERIES Cyclic IMS mass spectrometer and the e-MSion, Inc. ExD cell. Instrument configurations include Q-ExD-cIMS-TOF and Q-cIMS-ExD-TOF for pre- and/or post-cIMS ExD.
Figure 2
Figure 2
cIMS separation of a synthetic mixture of trastuzumab heavy chain peptide W99-K124 with Asp and isoAsp at position 102 (i.e., the fourth residue in the peptide sequence). Mass spectrum insets show the z23 ions observed for each mobility peak. The presence of z23–57 ions confirmed the mobility peak at 26 ms is the peptide containing isoAsp.
Figure 3
Figure 3
1D (A) and 2D (B) cIMS mobiligrams for ECD of +10 ubiquitin. The regions mobility fractions used for extraction of mass spectra are outlined in the 2D mobiligram (m/z vs drift time). The number of annotated isotope clusters/unique ions and sequence coverage for each mobility fraction (C). Comparison of the number of isotope clusters (unique clusters for combined fractions), unique ions, and sequence coverage observed from a single mass spectrum from all drift times (DT) combined and the combined results of the four mobility fractions (D).
Figure 4
Figure 4
2D mobiligram (m/z vs drift time) for pre-cIMS ECD of the +35 charge state of bovine carbonic anhydrase II (A) with outlined mobility fractions. Product ions charge state distributions for each mobility fraction with 1 standard deviation error bars (B), and the percent overlap in unique isotope clusters and unique ions observed between adjacent mobility fractions (C).
Figure 5
Figure 5
Number of annotated isotope clusters, unique ions, and sequence coverage observed for each mobility fraction for pre-cIMS ECD of +35 bovine carbonic anhydrase II (A). Comparison of the number of isotope clusters (unique isotope cluster for combined fractions), unique ions, and sequence coverage observed from a single mass spectrum from all drift times (DT) combined and the combined results of the five mobility fractions (B).
Figure 6
Figure 6
Zoomed-in region for the five mobility fractions and combined drift time mass spectra for pre-cIMS ECD of +35 bovine carbonic anhydrase II.
Figure 7
Figure 7
Product ion map for pre-cIMS ECD of the +11 charge state of native bovine carbonic anhydrase II generated from the combined results of five mobility fractions.

References

    1. Kellie J. F.; Tran J. C.; Lee J. E.; Ahlf D. R.; Thomas H. M.; Ntai I.; Catherman A. D.; Durbin K. R.; Zamdborg L.; Vellaichamy A.; Thomas P. M.; Kelleher N. L. Mol. Biosyst. 2010, 6, 1532–1539. 10.1039/c000896f. - DOI - PMC - PubMed
    1. Zhou H.; Ning Z.; Starr A.; Abu-Farha M.; Figeys D. Anal. Chem. 2012, 84, 720–734. 10.1021/ac202882y. - DOI - PubMed
    1. Gregorich Z. R.; Ge Y. PROTEOMICS 2014, 14, 1195–1210. 10.1002/pmic.201300432. - DOI - PMC - PubMed
    1. Meier F.; Beck S.; Grassl N.; Lubeck M.; Park M. A.; Raether O.; Mann M. J. Proteome Res. 2015, 14, 5378–5387. 10.1021/acs.jproteome.5b00932. - DOI - PubMed
    1. Macias L. A.; Santos I. C.; Brodbelt J. S. Anal. Chem. 2020, 92, 227–251. 10.1021/acs.analchem.9b04859. - DOI - PMC - PubMed

Publication types