. 2022 Apr:99:105253.
doi: 10.1016/j.meegid.2022.105253. Epub 2022 Feb 18.

Whole-genome analysis of SARS-CoV-2 in a 2020 infection cluster in a nursing home of Southern Italy

Affiliations

Whole-genome analysis of SARS-CoV-2 in a 2020 infection cluster in a nursing home of Southern Italy

Carmela De Marco et al. Infect Genet Evol. 2022 Apr.

Abstract

Background: Nursing homes have represented important hotspots of viral spread during the initial wave of COVID-19 pandemics. The proximity of patients inside nursing homes allows investigate the dynamics of viral transmission, which may help understand SARS-Cov2 biology and spread.

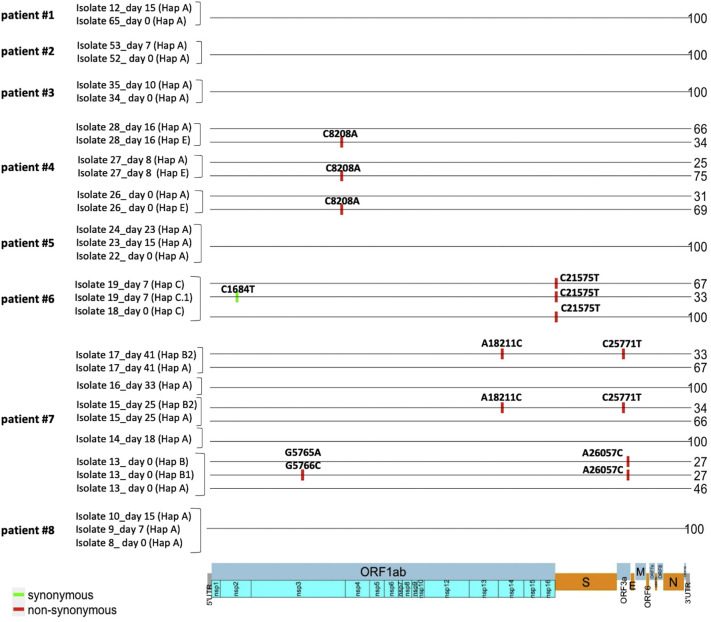
Methods: SARS-CoV-2 viral genomes obtained from 46 patients infected in an outbreak inside a nursing home in Calabria region (South Italy) were analyzed by Next Generation Sequencing. We also investigated the evolution of viral genomes in 8 patients for which multiple swabs were available. Phylogenetic analysis and haplotype reconstruction were carried out with IQ-TREE software and RegressHaplo tool, respectively.

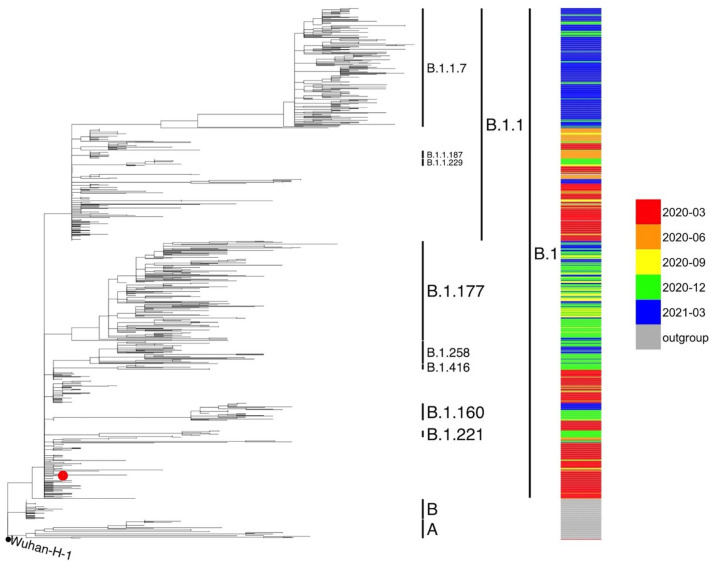
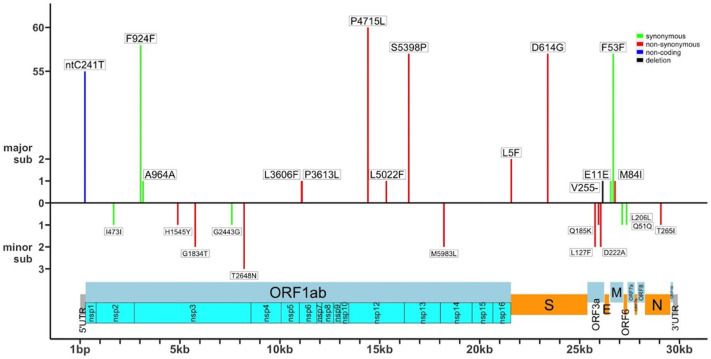
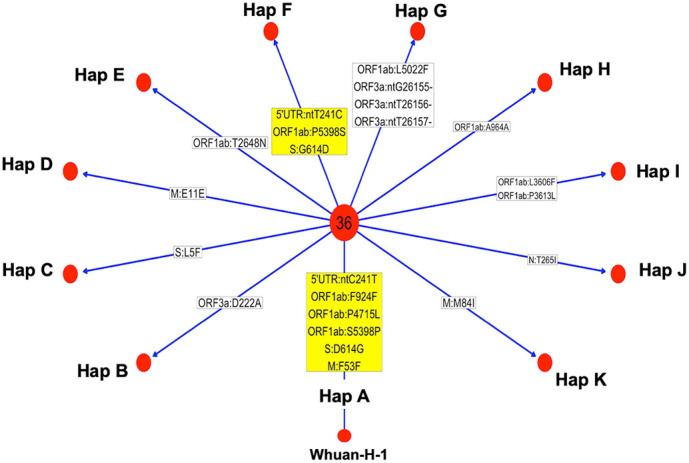
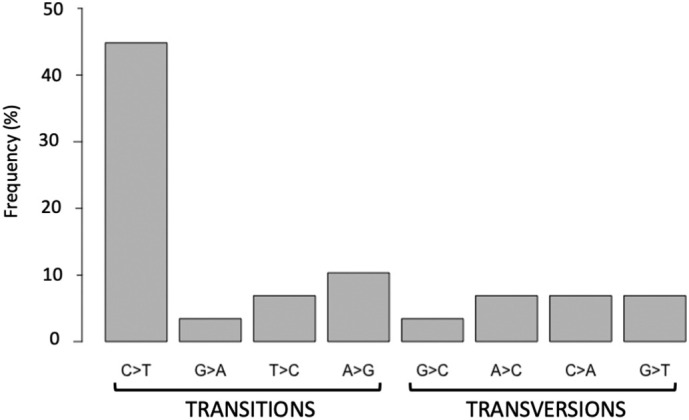
Results: All viral strains isolated from patients infected in the nursing home were classified as B.1 lineage, clade G. Overall, 14 major single nucleotide variations (SNVs) (frequency > 80%) and 12 minor SNVs (frequency comprised between 20% and 80%) were identified with reference to the Wuhan-H-1 sequence (NC_045512.2). All patients presented the same 6 major SNVs: D614G in the S gene; P4715L, ntC3037T (F924F) and S5398P in Orf1ab gene; ntC26681T (F53F) in the M gene; and ntC241T in the non-coding UTR region. However, haplotype reconstruction identified a founder haplotype (Hap A) in 36 patients carrying only the 6 common SNVs indicated above, and 10 other haplotypes (Hap BK) derived from Hap A in the remaining 10 patients. Notably, no significant association between a specific viral haplotype and clinical parameters was found.

Conclusion: The predominant viral strain responsible for the infection in a nursing home in Calabria was the B.1 lineage (clade G). Viral genomes were classified into 11 haplotypes (Hap A in 36 patients, Hap BK in the remaining patients).

Keywords: COVID-19; Haplotypes; NGS; SARS-CoV-2.


Conflict of interest statement

The authors declare that they have no known competing financial interests or personal relationships that could have appeared to influence the work reported in this paper.

Figures

Fig. 1
Fig. 1
Phylogenetic analysis of SARS-CoV-2 genomic sequences collected in the Chiaravalle patients. Multilineage phylogenetic tree reconstructed using 913 SARS-CoV-2 sequences downloaded from GISAID database. The SARS-CoV-2 consensus genomes of the 60 Chiaravalle patients are indicated with a red dot. Inclusion of all 60 consensus genomes led to a cluster of genomes around the founder genome. The reliability of the phylogenetic clustering was evaluated using bootstrap analysis with 1000 replicates. (For interpretation of the references to colour in this figure legend, the reader is referred to the web version of this article.)
Fig. 2
Fig. 2
Distribution of major and minor SNVs along the SARS-CoV-2 genome. The figure shows major SNVs on the top and minor SNVs under the 0-orizzontal axis. SNVs are indicated according to their position in the SARS-CoV-2 genome. SNVs are depicted as follows: synonymous (green), non-synonymous (red), non-coding (blue), small indel (black). Frequencies of |SNVs are reported on the left. (For interpretation of the references to colour in this figure legend, the reader is referred to the web version of this article.)
Fig. 3
Fig. 3
Haplotype identification in the SARS-CoV-2 isolates at baseline. The figure shows SNVs with >50% frequency present in the consensus sequences. Each red dot identifies a specific haplotype (hap A-K). In the center of the figure is shown a hub composes of 36 genomes with the same haplotype. In boxes are shown SNVs (relative to the Wuhan-H-1 sequence) that are characteristic of specific isolates: yellow boxes show major SNVs; white boxes show minor SNVs. (For interpretation of the references to colour in this figure legend, the reader is referred to the web version of this article.)
Fig. 4
Fig. 4
Haplotypes across samples at different time points. The plot shows haplotypes (Hap) across samples obtained at different time points from baseline swab in patients 1, #2, #3, 4, #5, 6, #7 and #8. Haplotypes'code is shown in brackets. The numbers on the right represent the percentage of the viral population characterized by the indicated haplotype.
Supplementary Fig. S1
Classification of variants identified in SARS-CoV-2 samples. The bar graph shows the distribution of transitions and transversions.

References

    1. Benson D.A., et al. GenBank. Nucleic Acids Res. 2015;43(Database issue):D30–D35. - PMC - PubMed
    1. Biswas S.K., Mudi S.R. Spike protein D614G and RdRp P323L: the SARS-CoV-2 mutations associated with severity of COVID-19. Genom. Inform. 2020;18(4) - PMC - PubMed
    1. Capobianchi M.R., et al. Molecular characterization of SARS-CoV-2 from the first case of COVID-19 in Italy. Clin. Microbiol. Infect. 2020;26(7):954–956. - PMC - PubMed
    1. Chen J., et al. Structural basis for helicase-polymerase coupling in the SARS-CoV-2 replication-transcription complex. Cell. 2020;182(6):1560–1573. e13. - PMC - PubMed
    1. Chen M.K., Chevalier J.A., Long E.F. Nursing home staff networks and COVID-19. Proc. Natl. Acad. Sci. U. S. A. 2021;118(1) - PMC - PubMed

Publication types