. 2022 Mar 21;50(5):2681-2699.
doi: 10.1093/nar/gkac079.

NBS1-CtIP-mediated DNA end resection suppresses cGAS binding to micronuclei

Affiliations

NBS1-CtIP-mediated DNA end resection suppresses cGAS binding to micronuclei

Salim Abdisalaam et al. Nucleic Acids Res. .

Abstract

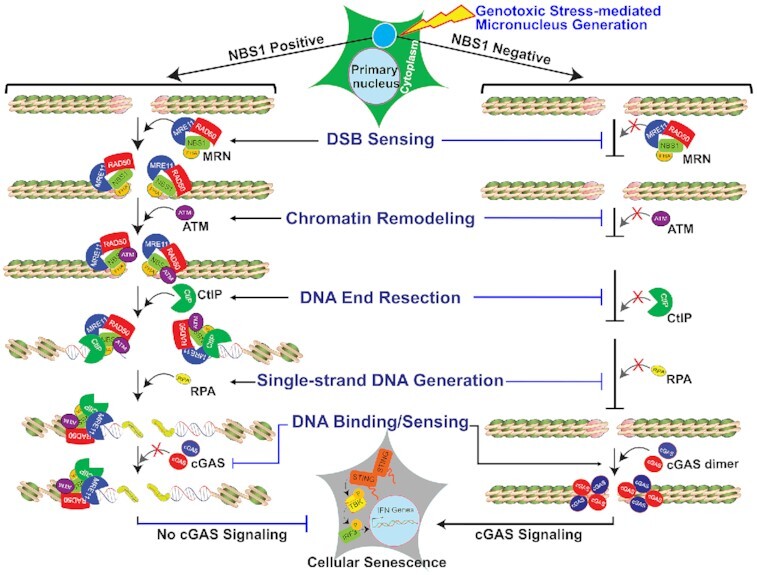
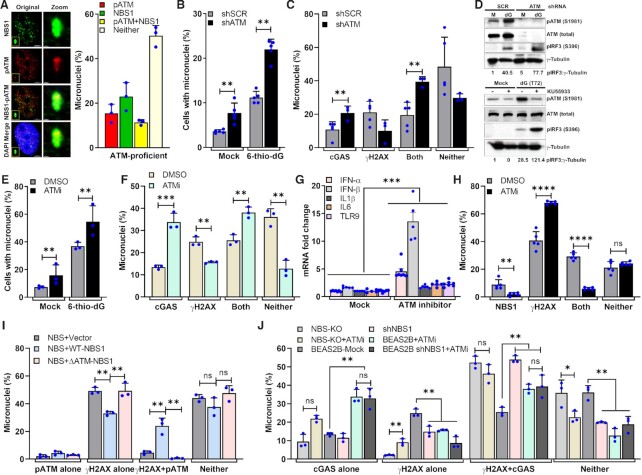
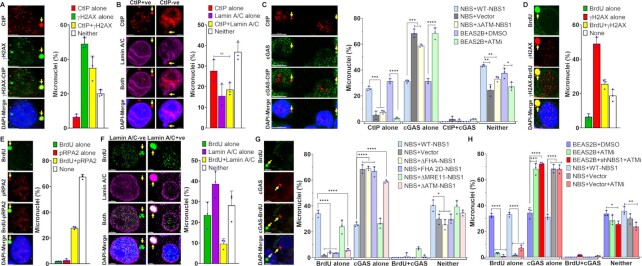
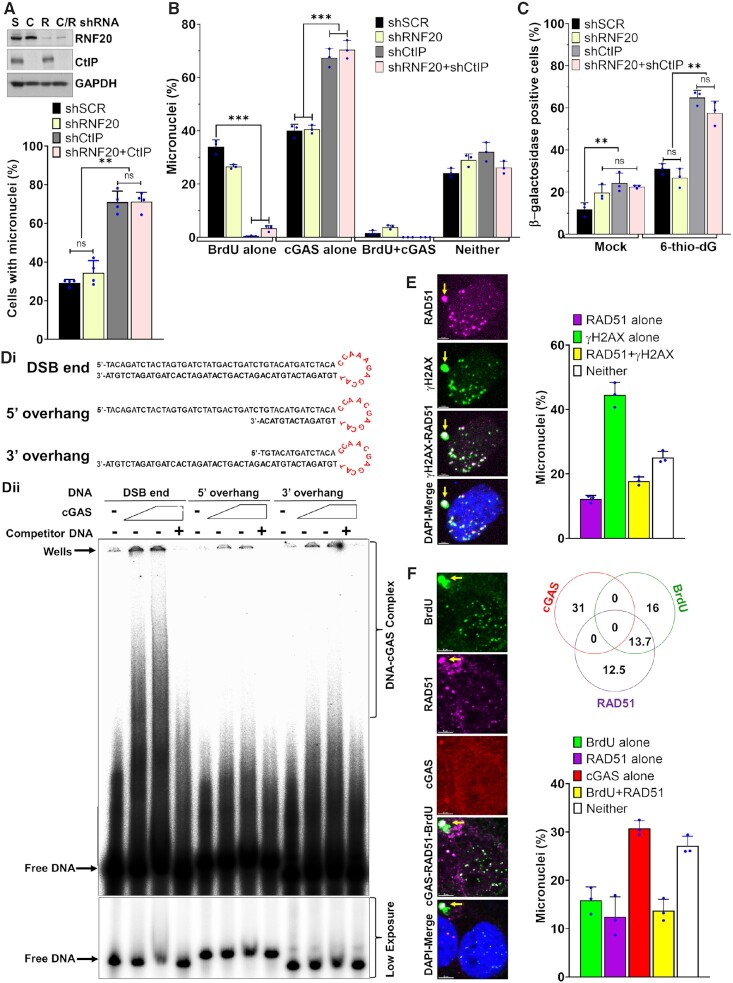
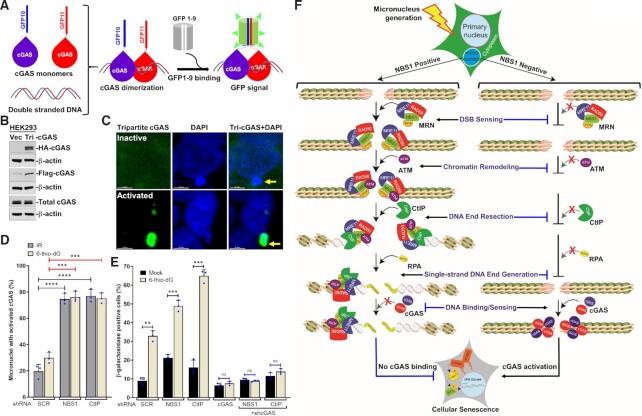
Cyclic guanosine monophosphate-adenosine monophosphate synthase (cGAS) is activated in cells with defective DNA damage repair and signaling (DDR) factors, but a direct role for DDR factors in regulating cGAS activation in response to micronuclear DNA is still poorly understood. Here, we provide novel evidence that Nijmegen breakage syndrome 1 (NBS1) protein, a well-studied DNA double-strand break (DSB) sensor-in coordination with Ataxia Telangiectasia Mutated (ATM), a protein kinase, and Carboxy-terminal binding protein 1 interacting protein (CtIP), a DNA end resection factor-functions as an upstream regulator that prevents cGAS from binding micronuclear DNA. When NBS1 binds to micronuclear DNA via its fork-head-associated domain, it recruits CtIP and ATM via its N- and C-terminal domains, respectively. Subsequently, ATM stabilizes NBS1's interaction with micronuclear DNA, and CtIP converts DSB ends into single-strand DNA ends; these two key events prevent cGAS from binding micronuclear DNA. Additionally, by using a cGAS tripartite system, we show that cells lacking NBS1 not only recruit cGAS to a major fraction of micronuclear DNA but also activate cGAS in response to these micronuclear DNA. Collectively, our results underscore how NBS1 and its binding partners prevent cGAS from binding micronuclear DNA, in addition to their classical functions in DDR signaling.


Figures

Graphical Abstract
Graphical Abstract
Following micronuclei generation in response to genotoxic stress, NBS1 is recruited to micronuclear DNA and that promotes CtIP-mediated end resection, resulting in the inhibition of cGAS binding to the micronuclear DNA.
Figure 1.
Figure 1.
cGAS is recruited to only a sub-population of nuclear envelope–ruptured micronuclei in response to genotoxic stress. (A, B) cGAS is recruited to only a limited number of micronuclei. Bar graphs show percentages of micronuclei-positive cells (A) and the percentage of micronuclei harboring either cGAS alone, γH2AX alone, cGAS and γH2AX or neither (B) at 24–72 h after exposing human bronchial epithelial (BEAS2B) cells to either mock or different DNA damaging agents (APH/CPT/GEM/6-thio-dG); HT1080 + DN-TRF2 cells treated with doxycycline (DN-TRF2); and HT1080 + sgTel-DD-Cas9 cells concomitantly treated with doxycycline and Shield1 (sgTel-DD-Cas9). The bar graph presents the mean and STDEV from three to five independent experiments. Statistical analysis was performed by using Student's t-test. APH–aphidicolin; CPT–camptothecin; GEM–gemcitabine; HU–hydroxyurea; 6-thio-dG–6-thio-2′-deoxyguanine; DN-TRF2–overexpression of doxycycline-inducible dominant negative telomeric-repeat binding factor 2; sgTel-DD-Cas9–CRISPR/Cas9-mediated induction of DNA double-strand breaks in the telomeric-repeat DNA. * P ≤ 0.05; ** P ≤ 0.01; *** P ≤ 0.001; **** P ≤ 0.0001. (C, D) Not all micronuclei (MN) with ruptured nuclear envelopes (NE) recruit cGAS. Representative images show cGAS-negative and Lamin A/C–negative (i), cGAS-negative and Lamin A/C–positive (ii), cGAS-positive and Lamin A/C (NE)–negative (iii) and cGAS-positive and Lamin A/C (weak)–positive (iv) micronuclei (C, left panels). Bar graph shows the frequency of micronuclei harboring either Lamin A/C alone, cGAS alone, cGAS and Lamin A/C or neither in BEAS2B cells treated with 3 μM 6-thio-dG for 72 h (C, right). Representative images show localization of either cGAS or RB1 in micronuclei (D, left). Bar graph shows the frequency of micronuclei harboring either RB1 alone, cGAS alone, cGAS and RB1 or neither in BEAS2B cells treated with 3 μM 6-thio-dG (D, right). Bar graph presents the mean and STDEV from 150–200 cells from three independent experimental groups. (E) A major fraction of γH2AX-positive micronuclei are devoid of a nuclear envelope. Representative images show the presence or absence of γH2AX in Lamin A/C coating–positive and negative micronuclei (left). Bar graph shows the frequency of micronuclei harboring either Lamin A/C alone, γH2AX alone, Lamin A/C and γH2AX, or neither in BEAS2B cells treated with 3 μM 6-thio-dG for 72 h (right). Bar graph presents the mean and STDEV from three independent experimental groups. +ve–positive; -ve–negative. (F) Representative images show the presence or absence of γH2AX in RB1-positive and RB1-negative micronuclei (left). Bar graph shows the percentage of micronuclei harboring either γH2AX alone, RB1 alone, γH2AX and RB1 or neither in BEAS2B cells treated with 3 μM 6-thio-dG for 72 h (right). Bar graph presents the mean and STDEV from three independent experimental groups. (G) Recruitment and phosphorylation of ATM (pATM, S1981) in micronuclei, and a fraction of pATM co-localizes with cGAS. Representative images show co-localization of total ATM (left) and phosphorylated ATM (S1981; middle) with cGAS in micronuclei. Bar graphs show the frequency of micronuclei containing either pATM alone, cGAS alone, pATM and cGAS or neither in BEAS2B cells treated with 3 μM 6-thio-dG. Bar graph presents the mean and STDEV from three independent experimental groups. (H, I) NBS1 is recruited to γH2AX-positive micronuclei but rarely co-localizes with cGAS. Representative images show the presence of NBS1 and γH2AX (H, left) and only cGAS but no NBS1 (I, left) in micronuclei. Bar graphs show the frequency of micronuclei harboring either NBS1 alone, γH2AX alone, NBS1 and γH2AX or neither (H, right) and NBS1 alone, cGAS alone, NBS1 and cGAS or neither (I, right) in BEAS2B cells treated with 3 μM 6-thio-dG for 72 h. Bar graph presents the mean and STDEV from three independent experimental groups.
Figure 2.
Figure 2.
NBS1 deficiency enhances cGAS-positive micronuclei. (A–C) Stable and transient NBS1 knockdown enhances cGAS-positive micronuclei. Representative western blots show stable (top) and doxycycline (lower)-mediated NBS1 depletion in BEAS2B cells (A). Bar graph shows percentages of micronuclei in mock- and 3 μM 6-thio-dG (72 h)–treated BEAS2B cells stably expressing scrambled (SCR), stable (NBS1-S), and doxycycline-inducible (NBS1-I) shNBS1 RNAs (B). Bar graph shows the percentage of micronuclei harboring either cGAS alone, γH2AX alone, cGAS and γH2AX or neither in BEAS2B cells expressing scrambled (SCR), stable, and doxycycline-inducible shNBS1 RNAs at 72 h after 3 μM 6-thio-dG treatment (C). Bar graph presents the mean and STDEV from three independent experiments. Statistical analysis was performed using Student's t-test. (D–G) NBS1 knockdown enhances IRF3 phosphorylation, IL-6 secretion, expression of immune genes and cellular senescence. Representative western blot shows phosphorylation of IRF3 (S396; D), and the bar graph shows the level of IL-6 in the BEAS2B cell culture supernatant (E) in mock-treated cells and at 72 h after 3 μM 6-thio-dG (dG) treatment. Graph shows greater expression of immune pathway genes in shNBS1 RNA cells treated with 3 μM 6-thio-dG than in shSCR RNA cells (F). Bar graph shows the frequency of β-galactosidase staining–positive cells at 10 days after 3 μM 6-thio-dG treatment in shSCR, shNBS1-stable (S) and doxycycline-inducible (I) RNA-expressing BEAS2B cells (G). Bar graph presents the mean and STDEV from three-six independent experiments. Statistical analysis was performed using Student's t-test (E and G) and two-way ANOVA (F). (H, I) Elevated levels of cGAS-positive micronuclei in patient-derived NBS1-mutant (NBS) cells. Representative western blots show expression of NBS1 in NBS cells complemented with NBS1 and vector alone (vec) (H, inset). Bar graph shows the percentage of micronuclei in mock- and 5 μM 6-thio-dG (72 h)–treated NBS1-mutant (NBS + Vec) and NBS cells complemented with WT NBS1 (NBS + NBS1; H). Bar graph shows the percentage of micronuclei harboring either cGAS alone, γH2AX alone, cGAS and γH2AX or neither in NBS1-mutant (NBS + Vector) and NBS cells complemented with WT NBS1 (NBS + NBS1) at 72 h after 5 μM 6-thio-dG treatment. Bar graphs present the mean and STDEV from three independent experiments. Statistical analysis was performed using Student's t-test. (J, K) NBS1 deficiency enhances IRF3 phosphorylation and exacerbates premature senescence. Representative western blots show increased activation of IRF3 (S396) in NBS cells relative to NBS cells complemented with NBS1 at indicated times after 6-thio-dG treatment (J). NBS cells show higher levels of β-galactosidase staining than NBS + NBS1 cells 7 days after 5 μM 6-thio-dG treatment (K). Bar graph presents the mean and STDEV from 12–15 different fields from three independent experiments. Statistical analysis was performed using Student's t-test. * P ≤ 0.05; ** P ≤ 0.01; *** P ≤ 0.001; **** P ≤ 0.0001.
Figure 3.
Figure 3.
ATM- and CtIP-binding domains of NBS1 are critical for regulating cGAS binding to micronuclear DNA. (A, B) Schematics of different NBS1 mutant constructs used in this study (A). Representative western blot shows stable expression of different NBS1 mutants in patient-derived NBS cells (B). FHA–fork head-associated domain; BRCT–BRCA1/2 C-terminus domain; AIM–ATM-MRE11 interaction domain; FL-WT–full length wild-type; Vec–vector alone; ΔFHA–delta FHA; ΔMR–delta MRE11 and 2D-FHA–2D. (C) ΔFHA- and FHA-2D-mutant NBS1 not only failed to bind to micronuclei but also failed to recruit CtIP to micronuclei; ΔMRE11-NBS1 does not cause the translocation of MRE11 from the cytoplasm to the nuclear compartment, and ΔATM-NBS1 does not phosphorylate ATM in micronuclei. Representative confocal images show recruitment of NBS1 and its binding partners to micronuclei in NBS cells stably expressing WT- and ΔFHA-, FHA-2D-, ΔMRE11- and ΔATM- mutant-NBS1. Exponentially growing cells were exposed to 2.5 Gy ionizing radiation (IR) and subjected to immunostaining with indicated antibodies at 24 h after IR. (D) NBS cells stably expressing ΔFHA-, FHA-2D-, ΔMRE11- and ΔATM-mutant NBS1, but not WT-NBS1, are sensitive to ionizing radiation. Exponentially growing cells were exposed to 2.5 Gy ionizing radiation and allowed to form colonies for 10 days. Colonies were stained with Crystal violet solution, and the surviving fraction was calculated in three independent experiments. (E–G) Defects in the FHA and ATM-binding domains of NBS1 cause increased numbers of cGAS-positive micronuclei and senescent cells. Bar graph shows percentages of micronuclei in NBS cells stably expressing FHA-2D-, ΔFHA-, ΔMRE11- and ΔATM-NBS1 mutants at 72 h after mock- and 5 μM 6-thio-dG treatment (E). Bar graph shows the percentage of micronuclei harboring either cGAS alone, γH2AX alone, cGAS and γH2AX or neither in NBS cells stably expressing FHA-2D-, ΔFHA-, ΔMRE11- and ΔATM-NBS1 mutants at 72 h after 5 μM 6-thio-dG treatment (F). NBS cells stably expressing FHA-2D-, ΔFHA- and ΔATM-NBS1 mutants show higher levels of β-galactosidase staining than NBS + WT-NBS1 cells 7 days after 5 μM 6-thio-dG treatment (G). Bar graph presents the mean and STDEV from three independent experiments. Statistical analysis was performed using two-way ANOVA (E and F) and Student's t-test (G). (H, I) NBS1 is rarely recruited to micronuclei in the absence of MDC1: Representative images show the presence of NBS1 and γH2AX in the same micronucleus of MDC1 wild type (WT) but not in MDC1 knockout (KO) cells (H, left). Bar graph shows the frequency of micronuclei harboring either NBS1 alone, γH2AX alone, NBS1 and γH2AX or neither (H, right). Representative images show the presence of cGAS and γH2AX in the same micronucleus of MDC1 WT and in MDC1 KO cells (I, left) and the bar graph shows the frequency of micronuclei harboring either γH2AX alone, cGAS alone, γH2AX and cGAS or neither (I) in MDC1 WT and KO mouse embryonic fibroblasts 24 h after 2.5 Gy ionizing radiation. Bar graph presents the mean and STDEV from three independent experimental groups. * P ≤ 0.05; ** P ≤ 0.01; *** P ≤ 0.001; **** P ≤ 0.0001.
Figure 4.
Figure 4.
NBS1-mediated ATM recruitment to micronuclear DNA attenuates cGAS binding. (A) NBS1 co-localizes with phosphorylated ATM in micronuclei. Representative images show co-localization of NBS1 and phosphorylated ATM (S1981; left). Bar graph shows the frequency of micronuclei harboring either NBS1 alone, pATM alone, NBS1 and pATM or neither in BEAS2B cells treated with 6-thio-dG (72 h). Bar graph presents the mean and STDEV from three independent experiments. (B–D) ATM knockdown increases cGAS-positive micronuclei. Bar graph shows the frequency of micronuclei formation in mock- and 3 μM 6-thio-dG–treated shSCR and shATM cells (B). Bar graph shows the frequency of micronuclei harboring either cGAS alone, γH2AX alone, cGAS and γH2AX or neither in SCR shRNA- and ATM shRNA-expressing cells 72 h after 3 μM 6-thio-dG treatment (C). Bar graph presents the mean and STDEV from three independent experimental groups. Statistical analysis was performed using Student's t-test. ** P ≤ 0.01; *** P ≤ 0.001; **** P ≤ 0.0001. Representative western blot shows higher levels of IRF3 phosphorylation in shRNA-mediated ATM knockdown HeLa cells than in SCR shRNA-expressing HeLa cells (D, top) and in ATM inhibitor (KU55933)-treated cells than in DMSO-treated BEAS2B cells (D, bottom) exposed to 3 μM 6-thio-dG (dG) for 72 h. (E–G) Inhibition of ATM kinase activity enhances cGAS recruitment to micronuclear DNA. Bar graphs show the frequency of micronuclei formation (E), elevated levels of cGAS-positive micronuclei (F) and expression of IFN-α, IFN-β, IL1-α, IL6 and TLR9 (G) in cells treated with ATM kinase inhibitor (KU55933) as compared with DMSO-treated cells. Bar graph presents the mean and STDEV from three independent experiments. Statistical analysis was performed using Student's t-test. (H) Inhibiting ATM kinase activity reduces NBS1 recruitment to micronuclei. Bar graph shows the percentage of micronuclei containing either γH2AX alone, NBS1 alone, γH2AX and NBS1 or neither in DMSO- and ATM inhibitor (KU55933)-treated BEAS2B cells exposed to 3 μM 6-thio-dG for 72 h. Bar graph presents the mean and STDEV from three independent experiments. Statistical analysis was performed using Student's t-test. (I) Number of phosphorylated ATM–positive micronuclei is attenuated in NBS + Vector and NBS+ΔATM NBS1 cells. Bar graph shows the frequency of micronuclei harboring either pATM alone, γH2AX alone, pATM and γH2AX or neither in NBS + Vector, NBS + WT-NBS1 and NBS+ΔATM-NBS1 cells at 24 h after exposure to 2.5 Gy IR. Bar graph presents the mean and STDEV from three independent experiments. Statistical analysis was performed using Student's t-test. (J) Loss of both NBS1 and ATM functions is epistatic with respect to cGAS accumulation at micronuclei. Bar graph shows the percentage of micronuclei containing either cGAS alone, γH2AX alone, cGAS+γH2AX or neither in DMSO- and ATM inhibitor (KU55933)-treated BEAS2B + shNBS1 and NBS cells at 24 h after exposure to 2.5 Gy IR. Bar graph presents the mean and STDEV from three independent experiments. Statistical analysis was performed using Student's t-test. * P ≤ 0.05; ** P ≤ 0.01; *** P ≤ 0.001; **** P ≤ 0.0001.
Figure 5.
Figure 5.
CtIP-positive and end-resected micronuclear DNA are defective in cGAS binding. (A–C) CtIP is recruited to micronuclei but does not co-localize with cGAS. Representative images show co-localization of CtIP with γH2AX (A, left), Lamin A/C (B, left) and cGAS (C, left) in the micronuclei. Bar graphs show the frequency of micronuclei harboring either CtIP alone, γH2AX alone, CtIP and γH2AX or neither (A, graph) and CtIP alone, Lamin A/C alone, CtIP and Lamin A/C or neither (B, graph) in BEAS2B cells at 24 h after exposure to 2.5 Gy IR. Bar graph shows the frequency of micronuclei harboring either CtIP alone, cGAS alone, CtIP and cGAS or neither in NBS + Vector, NBS + WT NBS1, NBS+ΔATM NBS1, BEAS2B + DMSO and BEAS2B + ATM inhibitor (10 μM KU55933) cells at 24 h after exposure to 2.5 Gy IR (C, graph). Bar graphs present the mean and STDEV from three independent experiments. (D–G) Most micronuclear DNA with end-resected ssDNA are negative for cGAS. Representative images show co-localization of end-resected ssDNA marker (BrdU) with γH2AX (D, left), pRPA2 (E, left), Lamin A/C (F, left) and cGAS (G, left) in the micronuclear DNA. Bar graphs show the frequency of micronuclear DNA harboring either BrdU alone, γH2AX alone, BrdU and γH2AX or neither (D, graph); BrdU alone, pRPA2 alone, BrdU and pRPA2 or neither (E, graph); BrdU alone, Lamin A/C alone, BrdU and Lamin A/C or neither (F, graph) in BEAS2B cells at 24 h after exposure to 2.5 Gy IR. Bar graph shows the frequency of micronuclei harboring either BrdU alone, cGAS alone, BrdU and cGAS or neither in NBS and NBS cells stably expressing ΔFHA-, FHA-2D-, ΔMRE11- and ΔATM-NBS1 mutants (G, graph). Bar graphs present the mean and STDEV from three independent experiments. Statistical analysis was performed using Student's t-test. (H) Inhibition of ATM kinase activity limits micronuclear DNA end resection, and this is epistatic with NBS1. Bar graphs show the frequency of micronuclei harboring either BrdU alone, cGAS alone, BrdU and cGAS or neither in BEAS2B-shSCR + DMSO, BEAS2B-shSCR + ATM inhibitor, BEAS2B-shNBS1 + ATM inhibitor, NBS-WT NBS1 + DMSO, NBS-Vector + DMSO and NBS-Vector + ATM inhibitor cells at 24 h after exposure to 2.5 Gy IR. Bar graphs present the mean and STDEV from three independent experiments. Statistical analysis was performed using Student's t-test. * P ≤ 0.05; ** P ≤ 0.01; *** P ≤ 0.001; **** P ≤ 0.0001.
Figure 6.
Figure 6.
CtIP-mediated end resection attenuates cGAS binding to micronuclear DNA. (A–C) Downregulation of CtIP enhances cGAS-positive micronuclei. Representative western blots show expression of CtIP and RNF20 in BEAS2B cells stably expressing shSCR (S), shCtIP (C), shRNF20 (R) and shCtIP + shRNF20 (C/R) (A, top). Bar graphs show percentages of cells with micronuclei (A); percentages of micronuclei harboring either cGAS alone, BrdU alone, cGAS and BrdU or neither (B) in BEAS2B cells stably expressing scrambled (SCR), shRNF20, shCtIP and shRNF20 and shCtIP at 24 h after exposure to 2.5 Gy IR. Bar graph shows percentages of β-galactosidase–positive cells expressing scrambled (SCR), shRNF20, shCtIP and shRNF20 and shCtIP RNAs at 10 days after exposure to 2.5 Gy IR (C). Bar graph presents the mean and STDEV of three independent experiments. Statistical analysis was performed using two-way ANOVA. (D) cGAS binds with double-stranded but not end-resected DNA substrates. Schematic shows the three different DNA structures used for the in vitro cGAS binding assay (i). Representative phosphor-image shows cGAS binding with double-stranded but not with end-resected DNA substrates (ii). 5–10 μM cGAS was incubated with 50 fmol 32P–labeled DNA substrates in the presence or absence of 100 bp cold double-stranded DNA (competitor). DNA protein complex was resolved onto 5% native polyacrylamide gel electrophoresis, and the signal was detected by phosphor-imaging. (E) RAD51 is recruited to micronuclear DNA, and it co-localizes with γH2AX. Representative images show co-localization of RAD51 and γH2AX in the same micronuclei (left) and the bar graph shows the percentages of either RAD51 alone, γH2AX alone, RAD51 and γH2AX or neither in HT1080 cells at 24 h after exposure to 2.5 Gy IR. Data in the bar graph represent mean and STDEV from three independent experiments. (F) RAD51 and cGAS do not co-localize in the same micronuclei. Representative images show localization of cGAS, RAD51 and BrdU signal in the micronuclei of BEAS2B cells at 24 h after exposure to 2.5 Gy IR. Venn diagram and the bar graph show the percentages of micronuclei with indicated markers. Data in the Venn diagram and the bar graph represent mean and STDEV from three independent experiments. * P ≤ 0.05; ** P ≤ 0.01; *** P ≤ 0.001.
Figure 7.
Figure 7.
cGAS is activated in response to a major fraction of micronuclear DNA in NBS1- and CtIP-depleted cells. (A) Schematics show tripartite cGAS system consisting of G10-Flag-cGAS, cGAS-HA-G11 and GFP1-9 for detecting activated cGAS in cells. The principle is that when two different molecules of cGAS, i.e., G10-Flag-cGAS and cGAS-HA-G11, dimerize on double-stranded DNA, that binds to GFP1-9, which results in a functional GFP. (B) Western blots show detection of G10-Flag-cGAS and cGAS-HA-G11 expression in HEK 293 cells. Cells were infected with lentiviral particles carrying G10-Flag-cGAS, cGAS-HA-G11 and GFP1-9, then were selected with Puromycin, G418 and hygromycin. Total cell lysate was probed with anti-HA, anti-Flag-HRP, cGAS and β-actin antibodies. (C, D) cGAS is activated in a major fraction of micronuclear DNA in NBS1 and CtIP knockdown cells. Representative images show GFP fluorescence signal in the micronuclei triggered by the dimerized (i.e. activated) cGAS (C). Bar graph shows the percentages of activated cGAS-positive micronuclei in shSCR, shNBS1 and shCtIP cells at 24 h after 2.5 Gy ionizing radiation (IR) and at 72 h after 1 μM 6-thio-dG treatment (D). HEK293 cells stably expressing tripartite cGAS were transfected with shSCR, shNBS1 and shCtIP RNAs and treated with either 2.5 Gy IR or 1 μM 6-thio-dG, and the GFP signal in the micronuclei was analyzed at indicated times after the treatment. Bar graph presents the mean and STDEV from 300–400 cells in three independent experimental groups. Statistical analysis was performed using Student's t-test. (E) Co-depleting cGAS and NBS1, and cGAS and CtIP abrogates cellular senescence. Bar graph shows percentages of β-gal–positive cells expressing SCR, NBS1 alone, CtIP alone, cGAS alone, NBS1+cGAS and CtIP+cGAS shRNAs at 10 days after 3 μM 6-thio-dG (6-dG) treatment. Bar graph presents the mean and STDEV of three independent experiments. Statistical analysis was performed using Student's t-test. * P ≤ 0.05; ** P ≤ 0.01; *** P ≤ 0.001; **** P ≤ 0.0001. (F) Model depicting the mechanism of NBS1-mediated regulation of cGAS binding to micronuclei and the subsequent activation of immune signaling, which culminates in cellular senescence.

References

    1. Li X.D., Wu J., Gao D., Wang H., Sun L., Chen Z.J.. Pivotal roles of cGAS-cGAMP signaling in antiviral defense and immune adjuvant effects. Science. 2013; 341:1390–1394. - PMC - PubMed
    1. Sun L., Wu J., Du F., Chen X., Chen Z.J.. Cyclic GMP-AMP synthase is a cytosolic DNA sensor that activates the type i interferon pathway. Science. 2013; 339:786–791. - PMC - PubMed
    1. Wu J., Sun L., Chen X., Du F., Shi H., Chen C., Chen Z.J.. Cyclic GMP-AMP is an endogenous second messenger in innate immune signaling by cytosolic DNA. Science. 2013; 339:826–830. - PMC - PubMed
    1. Bartsch K., Knittler K., Borowski C., Rudnik S., Damme M., Aden K., Spehlmann M.E., Frey N., Saftig P., Chalaris A.et al. .. Absence of RNase H2 triggers generation of immunogenic micronuclei removed by autophagy. Hum. Mol. Genet. 2017; 26:3960–3972. - PubMed
    1. Dou Z., Ghosh K., Vizioli M.G., Zhu J., Sen P., Wangensteen K.J., Simithy J., Lan Y., Lin Y., Zhou Z.et al. .. Cytoplasmic chromatin triggers inflammation in senescence and cancer. Nature. 2017; 550:402–406. - PMC - PubMed

Publication types

MeSH terms