. 2022 Feb 21;21(1):58.
doi: 10.1186/s12936-022-04072-2.

Inferring person-to-person networks of Plasmodium falciparum transmission: are analyses of routine surveillance data up to the task?

Affiliations

Inferring person-to-person networks of Plasmodium falciparum transmission: are analyses of routine surveillance data up to the task?

John H Huber et al. Malar J. .

Abstract

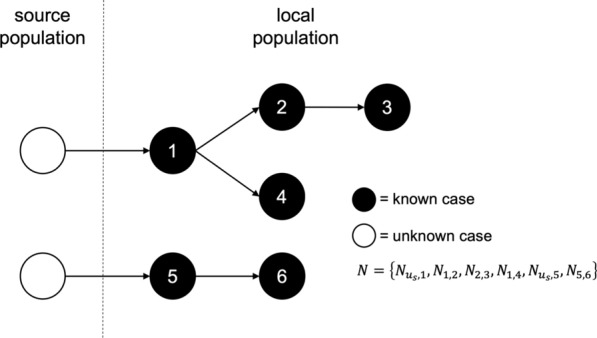
Background: Inference of person-to-person transmission networks using surveillance data is increasingly used to estimate spatiotemporal patterns of pathogen transmission. Several data types can be used to inform transmission network inferences, yet the sensitivity of those inferences to different data types is not routinely evaluated.

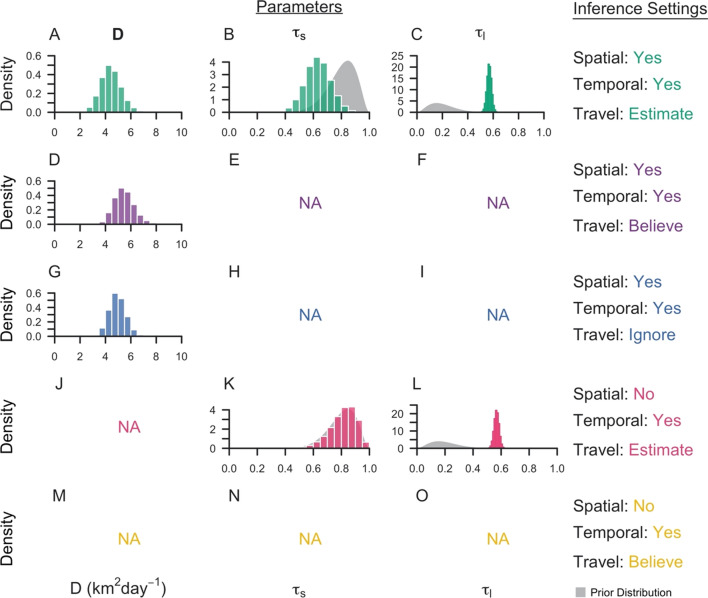
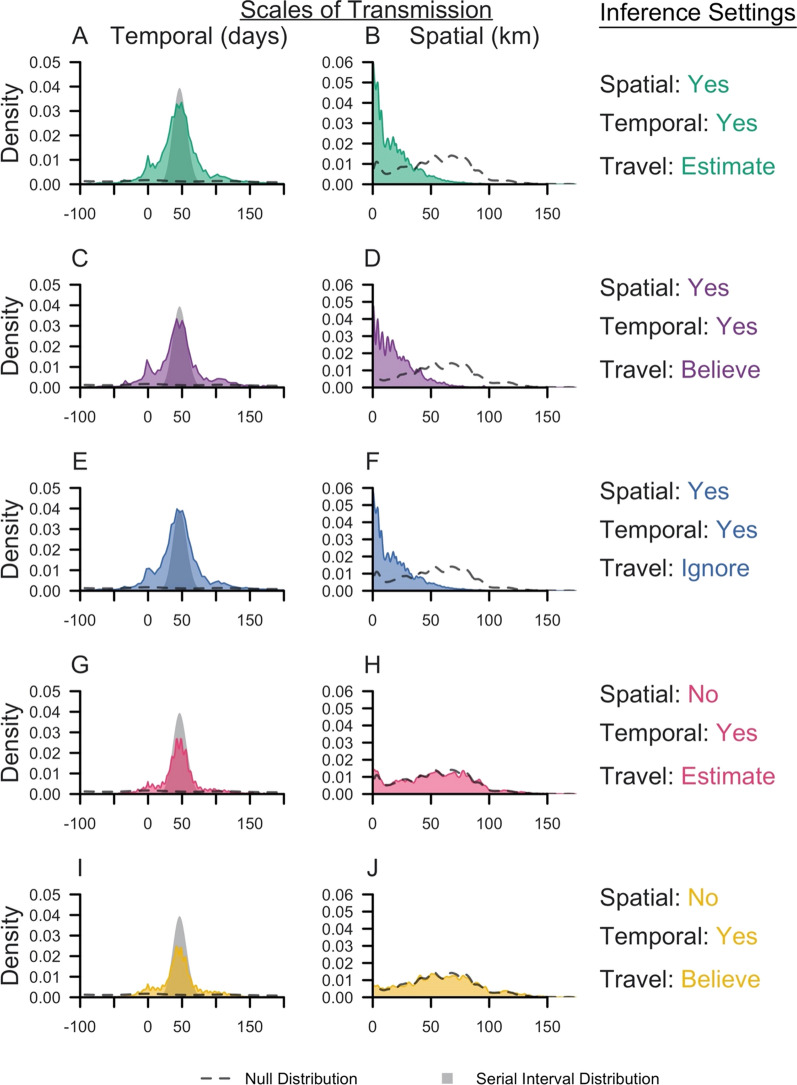
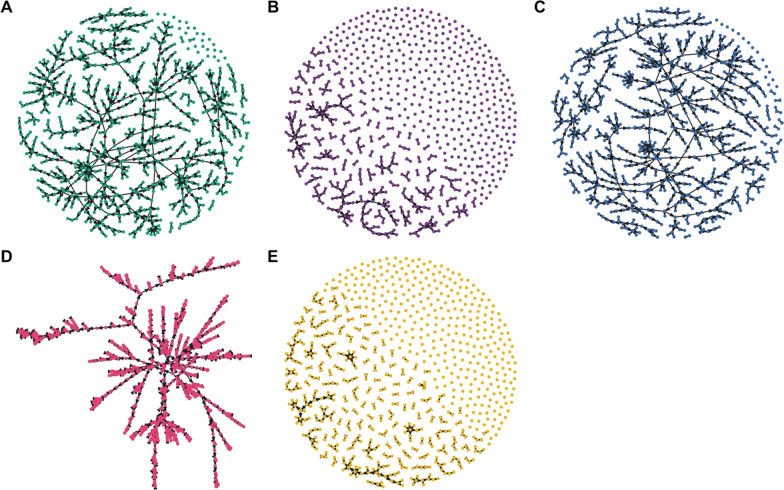
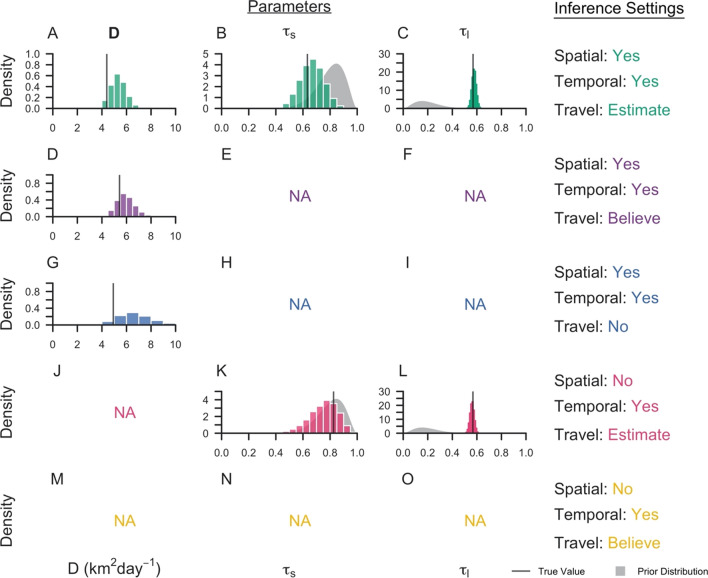
Methods: The influence of different combinations of spatial, temporal, and travel-history data on transmission network inferences for Plasmodium falciparum malaria were evaluated.

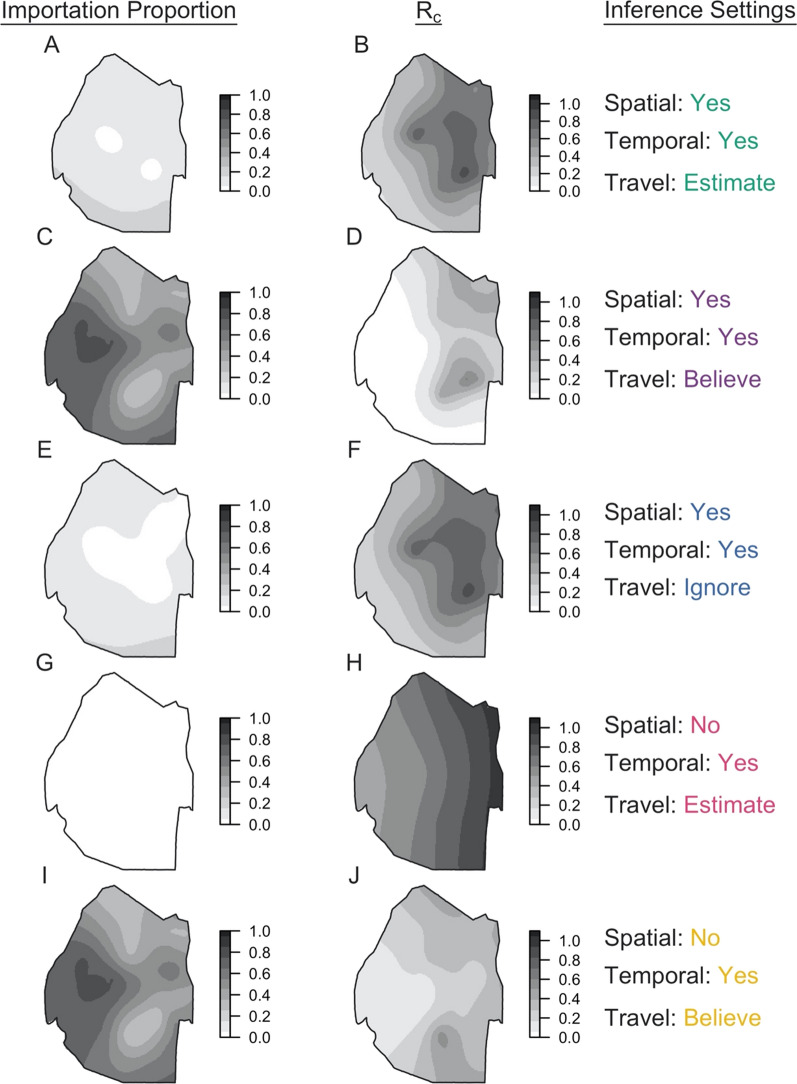
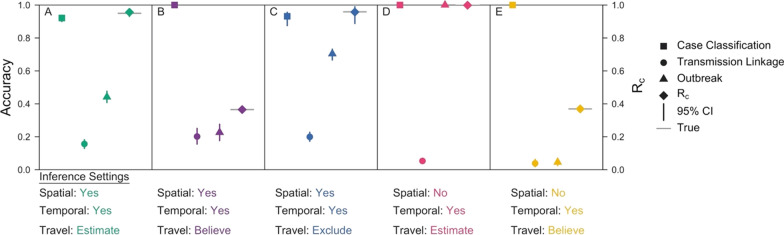
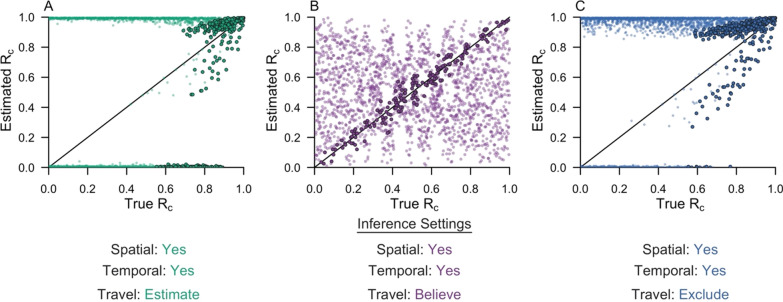
Results: The information content of these data types may be limited for inferring person-to-person transmission networks and may lead to an overestimate of transmission. Only when outbreaks were temporally focal or travel histories were accurate was the algorithm able to accurately estimate the reproduction number under control, Rc. Applying this approach to data from Eswatini indicated that inferences of Rc and spatiotemporal patterns therein depend upon the choice of data types and assumptions about travel-history data.

Conclusions: These results suggest that transmission network inferences made with routine malaria surveillance data should be interpreted with caution.


Conflict of interest statement

The authors declare that they have no competing interests.

Figures

Fig. 1
Fig. 1
Schematic of a hypothetical transmission network A hypothetical transmission network is presented along with the corresponding notation. In the schematic, white circles denote unobserved cases, and black circle denote observed cases. Arrows represent transmission between two cases
Fig. 2
Fig. 2
Marginal posterior distributions of parameters from Eswatini surveillance data. Histograms represent the marginal posterior distribution of each parameter, colour-coded by the inference settings used. D is the diffusion coefficient with units sq km day−1, τs is the probability that an imported case reports travel, and τl is the probability that a locally acquired case reports travel. Grey shapes represent the prior distributions placed on each parameter. Inference settings in which a given parameter was not estimated are indicated by NA
Fig. 3
Fig. 3
Spatial and temporal scales of transmission in Eswatini. Kernel density plots of the spatial (km) and temporal (days) scales of transmission are reported and colour-coded for each inference setting. Dashed lines indicate the corresponding null distribution, generated from all random pairs of cases in the Eswatini surveillance data set. The null distribution was different if we believed the travel history, because classification of cases on the basis of travel history reduced the pairs of cases that could be randomly sampled. The grey shape is the serial interval distribution used in the likelihood
Fig. 4
Fig. 4
Spatial distribution of importation and transmission risk in Eswatini. Maps of the proportion of cases that are imported and the reproduction number under control (Rc) were generated for each inference setting using a generalized additive model with a Gaussian process basis function setting using the mgcv package in R [50, 51]. In each plot, darker colours indicate greater importation or transmission risk
Fig. 5
Fig. 5
Maximum a posteriori transmission networks in Eswatini. The maximum a posteriori transmission networks (i.e., the transmission network in the posterior distribution with the highest likelihood) is shown for each inference setting: A spatial and temporal data while estimating the accuracy of the travel history; B spatial and temporal data while believing the travel history; C spatial and temporal data alone; D temporal data while estimating the accuracy of the travel history; and E temporal data while believing the travel history. In each transmission network, circles represent nodes, and arrows represent directed edges
Fig. 6
Fig. 6
Marginal posterior distributions for parameters inferred from simulated data. The marginal posterior distributions are reported for each inference setting from its respective simulated data set. Each line denotes the true value of the parameter, and the grey shapes represent the prior distributions of the parameters. Inference settings in which a given parameter was not estimated are indicated by NA
Fig. 7
Fig. 7
Inference accuracies for validation exercises. Accuracy metrics are reported for each inference setting applied to its respective simulated data set. Case Classification, represented by squares, refers to the proportion of cases that are correctly classified as imported or locally acquired. Transmission Linkage, denoted by circles, is the proportion of locally acquired cases for which the true parent is correctly identified. Outbreak, represented by triangles, is the proportion of locally acquired cases for which the inferred parent belongs to the correct outbreak. Bars denote the 95% credible intervals, and the grey line is the true Rc value of the network
Fig. 8
Fig. 8
Comparison of Rc estimates across inference settings. The inference algorithm was applied to 2,000 simulated data sets. The estimated Rc is compared to the true Rc for each of the inference settings: A spatial and temporal data while estimating the accuracy of the travel history; B spatial and temporal data while believing the travel history; and C spatial and temporal data alone. Each point represents a simulated data set. The darker, accented points are simulated data sets with epidemiological features that improved performance. In A and C, the darker, accented points were simulated data sets where the mean temporal interval between imported infections was greater than two times the mean serial interval. In B, the darker, accented points were simulated data sets where the proportion of cases reporting travel was within 0.05 of the proportion of imported cases

References

    1. Wallinga J, Teunis P. Different epidemic curves for severe acute respiratory syndrome reveal similar impacts of control measures. Am J Epidemiol. 2004;160:509–516. - PMC - PubMed
    1. White LF, Archer B, Pagano M. Estimating the reproductive number in the presence of spatial heterogeneity of transmission patterns. Int J Health Geogr. 2013;12:35. - PMC - PubMed
    1. Métras R, Baguelin M, Edmunds WJ, Thompson PN, Kemp A, Pfeiffer DU, et al. Transmission potential of Rift Valley Fever virus over thecourse of the 2010 epidemic in South Africa. Emerg Infect Dis. 2013;19:916–924. - PMC - PubMed
    1. Backer JA, Wallinga J. Spatiotemporal analysis of the 2014 Ebola epidemic in West Africa. PLoS Comput Biol. 2016;12:e1005210. - PMC - PubMed
    1. Salje H, Cummings DAT, Lessler J. Estimating infectious disease transmission distances using the overall distribution of cases. Epidemics. 2016;17:10–18. - PMC - PubMed