Investigating strategies to increase general education teachers' adherence to evidence-based social-emotional behavior practices: A meta-analysis of the single-case literature
- PMID: 35190070
- PMCID: PMC11155481
- DOI: 10.1016/j.jsp.2021.11.005
Investigating strategies to increase general education teachers' adherence to evidence-based social-emotional behavior practices: A meta-analysis of the single-case literature
Abstract
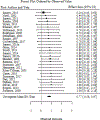
Educational researchers have produced a variety of evidence-based practices (EBP) to address social, emotional, and behavioral (SEB) needs among students. Yet, these practices are often insufficiently adopted and implemented with fidelity by teachers to produce the beneficial outcomes associated with the EBP, leaving students at risk for developing SEB problems. If ignored, SEB problems can lead to other negative outcomes, such as academic failure. Therefore, implementation strategies (i.e., methods and procedures designed to promote implementation outcomes) are needed to improve teachers' uptake and delivery of EBPs with fidelity. This meta-analysis sought to examine the types and magnitude of effect of implementation strategies that have been designed and tested to improve teacher adherence to SEB EBPs. Included studies (a) used single case experimental designs, (b) employed at least one implementation strategy, (c) targeted general education teachers, and (d) evaluated adherence as a core dimension of fidelity related to the delivery of EBPs. In total, this study included 28 articles and evaluated 122 effect sizes. A total of 15 unique implementation strategies were categorized. Results indicated that, on average, implementation strategies were associated with increases in teacher adherence to EBPs above baseline and group-based pre-implementation trainings alone (g = 2.32, tau = 0.77). Moderator analysis also indicated that larger effects were associated with implementation strategies that used a greater number of unique behavior change techniques (p < .001). Implications and future directions for research and practice regarding use of implementation strategies for general education teachers are discussed.
Keywords: Behavior change; Implementation strategies; Mechanism; School-based; Single case; meta-analysis.
Published by Elsevier Ltd.
Figures


References
-
- Aarons GA, Ehrhart MG, & Farahnak LR, & Hurlburt M (2015). Leadership and organizational change for implementation (LOCI): A randomized mixed-method pilot study of a leadership and organization development intervention for evidence-based practice implementation. Implementation Science, 10(1), Article 11. 10.1186/s13012-014-0192-y - DOI - PMC - PubMed
-
- Ajzen I (1991). The theory of planned behavior. Organizational Behavior and Human Decision Processes, 50(2), 179–211. 10.1016/0749-5978(91)90020-T - DOI
Publication types
MeSH terms
Grants and funding
LinkOut - more resources
Full Text Sources

