. 2022 Feb;6(2):118-128.
doi: 10.1038/s41551-021-00842-6. Epub 2022 Feb 21.

Rapid manufacturing of non-activated potent CAR T cells

Affiliations

Rapid manufacturing of non-activated potent CAR T cells

Saba Ghassemi et al. Nat Biomed Eng. 2022 Feb.

Abstract

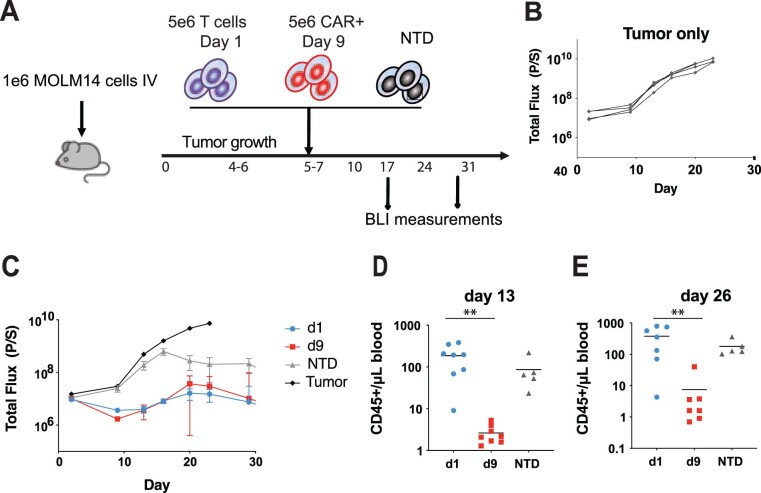
Chimaeric antigen receptor (CAR) T cells can generate durable clinical responses in B-cell haematologic malignancies. The manufacturing of these T cells typically involves their activation, followed by viral transduction and expansion ex vivo for at least 6 days. However, the activation and expansion of CAR T cells leads to their progressive differentiation and the associated loss of anti-leukaemic activity. Here we show that functional CAR T cells can be generated within 24 hours from T cells derived from peripheral blood without the need for T-cell activation or ex vivo expansion, and that the efficiency of viral transduction in this process is substantially influenced by the formulation of the medium and the surface area-to-volume ratio of the culture vessel. In mouse xenograft models of human leukaemias, the rapidly generated non-activated CAR T cells exhibited higher anti-leukaemic in vivo activity per cell than the corresponding activated CAR T cells produced using the standard protocol. The rapid manufacturing of CAR T cells may reduce production costs and broaden their applicability.


Conflict of interest statement

M.C.M. is an inventor on patent applications related to CAR technology (US patents 9,481,728 and 9,499,629 B2) and has received licencing royalties from the Novartis corporation. S.G. and M.C.M. are inventors on a patent application related to methods of manufacturing non-activated CAR T cells (provisional patent PCT/US2020/027734). The other authors declare no competing interests.

Figures

Fig. 1
Fig. 1. Lentiviral vectors transduce non-activated T-cell subsets with a preference for memory subsets.
a, Transduction efficiency of freshly isolated human T cells that were either cultured in IL-7 (10 ng ml−1) and IL-15 (10 ng ml−1) or activated with beads coated with anti-CD3/CD28 and transduced with lentiviral vector encoding iRFP for 5 d. The mean of each group is indicated by the solid black line. The two groups were compared using a two-tailed unpaired Mann–Whitney test; P = 0.0079. b,c, Freshly isolated human T cells were cultured in IL-7 and IL-15, and transduced with lentiviral vector encoding iRFP for the indicated time periods. b, iRFP+ cells were quantified by flow cytometry. Ctrl, control. c, Similar transduction efficiencies were obtained in an independent experiment from six different donors. Data are the mean ± s.e.m. d, Representative flow cytometric analysis of non-activated T cells transduced as in a. Naive, central memory (Tcm), effector memory (Tem) and total effector (Tte) T-cell subsets were identified following gating on live singlets of CD3+CD4+ (top) and CD3+CD8+ (bottom) T cells using CD45RO and CCR7 expression. b,d, The percentages of transduced cells (pink boxes) are indicated. e, Similar transduction efficiencies were obtained in an independent experiment from six different donors. CD4+ versus CD8+ cells, P = 0.0308; two-tailed paired t-test (left). CD8+ naive-like T cells versus Tcm, Tem and Tte cells, P = 0.0133, 0.0204 and 0.0427, respectively (right); and CD4+ naive-like T cells versus Tcm and Tem cells, P = 0.0423 and 0.0208, respectively (middle); paired one-way analysis of variance. *P < 0.05; **P < 0.01.
Fig. 2
Fig. 2. CAR lentivirus mediates pseudotransduction in non-activated T cells.
a, Freshly isolated human T cells were cultured in IL-7 and IL-15, and transduced with lentiviral vector encoding CAR19. The gene transduction efficiency was measured after immunostaining with an anti-idiotype antibody for the indicated time periods. Representative flow cytometry plots of CAR expression from six separate experiments with independent donors are shown. b,c, T cells that had been previously stimulated with anti-CD3/CD28 microbeads (b) as well as non-activated T cells (c) were transduced with CAR lentivirus and co-cultured with integrase (middle) or RT (right) inhibitor for 4 d. The CAR+ cells were quantified by flow cytometry. ac, The percentages of transduced cells (pink boxes) are indicated. d, Non-activated T cells were transduced with iRFP lentivirus and co-cultured with integrase (middle) or RT (right) inhibitor as in b,c. iRFP+ cells were quantified by flow cytometry.
Fig. 3
Fig. 3. Non-activated T cells expressing CAR19 control leukaemia in xenograft models of ALL.
a, Schematic of the generation of non-activated CART19 cells in less than 24 h. Freshly isolated human T cells were transduced with CAR19 lentiviral vector for 20 h in the presence of IL-7 and IL-15. The cells were then washed and injected into mice. b, Schematic showing how CART19 cells are generated using standard approaches. After overnight stimulation with anti-CD3/CD28 beads, T cells are transduced with CAR19 lentiviral vector and expanded for 9 d. The cells are then washed, de-beaded and injected into mice. c, Schematic of the xenograft model with CART19 cell treatment in NSG mice. IV, intravenously. d, Total BLI in mice treated with 3 × 106 non-activated T cells transduced as in a (d1; left) and mice treated with 3 × 106 CAR+ T cells previously stimulated with anti-CD3/CD28 microbeads and expanded over 9 d as in b (d9; middle) and NTD (right) control non-activated T cells (3 × 106 cells per treatment; n = 10 mice per group). e, Representative BLI in mice treated with 3 × 106 CAR T cells stimulated with anti-CD3/CD28 microbeads and expanded over 9 d from three additional donors. f,g, Absolute CD45+ T-cell counts, measured using a TruCount assay, of peripheral blood collected from the mice in d on d27 (f) and d55 (g) following T-cell transfer. The mean of each group is indicated by the solid black line. Groups were compared using a two-tailed unpaired Mann–Whitney test; **P = 0.02; ****P < 0.0001. h, Overall survival of the mice in each group. P < 0.0001 for d1 versus NTD and d9 versus NTD; two-sided log-rank test. Source data
Fig. 4
Fig. 4. The transducing conditions can enhance the transduction efficiency in non-activated T cells.
a, Freshly isolated human T cells were either serum starved by washing and resuspending in serum-free medium or maintained in complete medium for 3–6 h. The cells were then transduced with a lentiviral vector encoding iRFP for 24 h in the presence of IL-7 and IL-15 in complete medium and maintained in culture for 5 d before determining the iRFP+ cell frequency. Each dot represents the transduction frequency, determined by flow cytometry, from an independent experiment using six different donors. ***P = 0.0002. b, Relative fold change in transduction of iRFP+ cells transduced in the presence of 50 µM dNs normalized to iRFP+ cells transduced in complete medium without dNs. Data are the mean ± s.d. of six experiments performed with different donors. *P = 0.0312. In a and b, a two-tailed paired t-test was used. c, T-cells transduction with iRFP lentiviral vector was performed in one (control; left), two (middle) or four (right) wells, with the total culture volume kept constant. The cells were then maintained in culture for 5 d in IL-7 and IL-15-containing medium before determining the iRFP+ cell frequency by flow cytometry. Results are representative of three independent experiments using three different donors. d, Freshly isolated human T cells were transduced with a lentiviral vector encoding iRFP in optimized conditions as described in ac (serum starvation, dNs and optimized geometry). The T cells were then maintained in culture for 5 d, followed by flow cytometric analysis for iRFP expression. Results are representative of the best transduction achieved using this process. c,d, The percentages of transduced cells (pink boxes) are indicated. e, Schematic of the generation of non-activated CART19 cells in 24 h. f, Frequency of CAR T cells, estimated by qPCR analysis of the vector copy number, in peripheral blood collected 3 weeks following the adoptive transfer of T cells. The results are expressed as a percentage of human cells by normalization to the CDKN1A gene, which has two copies in the human diploid genome. Each symbol represents a separate donor.
Fig. 5
Fig. 5. Non-activated CART19 cells induce potent and durable remission of ALL at low doses.
a, Schematic of the xenograft model and CART19 cell treatment in NSG mice. bd, Serial quantification of disease burden by bioluminescence imaging. b, Total BLI in mice treated with NTD control non-activated T cells. c, Total BLI in mice treated with a single high (2 × 106; left), medium (0.7 × 106; middle) or low (0.2 × 106; right) dose of non-activated T cells (d1) transduced as in Fig. 4e. d, Total BLI in mice treated with 3 × 106 CAR T cells stimulated with anti-CD3/CD28 microbeads and expanded over 9 d. For bd, there were eight mice in each group. e, Time to initial anti-leukaemic response (that is, first reduction in bioluminescence) after infusion of non-activated CART19 cells relative to the T-cell dose. Data are mean ± s.d. f, Absolute CD45+ T-cell counts, measured using a TruCount assay, of peripheral blood collected from the mice in bd on d10 following the T-cell transfer. *P = 0.0255; **P = 0.0011; ***P = 0.0002. g, Vector copy number, measured by qPCR and normalized to the DNA concentration, in peripheral blood collected on d10 following the T-cell transfer. *P = 0.0286. h, Absolute CD45+ T-cell counts, measured using a TruCount assay, of peripheral blood collected from the mice shown in bd on d30 following the T cell transfer measured by a TruCount assay. ***P = 0.0002. fh, The mean of each group is indicated by the solid black line. Groups were compared using a two-tailed unpaired Mann–Whitney test. Source data
Fig. 6
Fig. 6. Non-activated CAR T cells generated from patient samples show potent efficacy in vivo.
ad, Serial quantification of disease burden by bioluminescence imaging. Total BLI in mice treated with 3 × 106 non-activated T cells (d1) transduced as in Fig. 4e (a; n = 7), CAR T cells stimulated with anti-CD3/CD28 microbeads and expanded over 9 d (d9; b; n = 10) or NTD control non-activated T cells (c; n = 10) as well as the total BLI of untreated mice (tumour only; d). In a and b, the dashed line is the baseline BLI. e, BLI measurement of the disease burden of the mice from the d1 and d9 groups (from a and b) in relation to the absolute CD45+ T-cell counts in their peripheral blood on d49. fh, Absolute CD45+ T-cell counts, measured using a TruCount assay, of peripheral blood collected from the mice in ac on d16 (f), d23 (g) and d49 (h) following the T-cell transfer. The mean of each group is indicated by the solid black line. Groups were compared using a two-tailed unpaired Mann–Whitney test. ***P = 0.0001; **P = 0.002. Source data
Extended Data Fig. 1
Extended Data Fig. 1. Non-activated T cells expressing a CD33-specific CAR exhibit an antileukemic effect in vivo in the Aml xenograft model.
a, Schematic of the xenograft model and CART33 cell treatment in NSG mice. b, c, Serial quantification of disease burden by bioluminescence imaging. b, Total bioluminescence flux in mice with no treatment. c, Total bioluminescence flux in mice treated with 5×10⁶ non-activated T cells transduced as in panel (a) (d1), 5×10⁶ CAR + T cells stimulated with anti- CD3/CD28 microbeads and expanded over 9 days (d9), and 5×10⁶ non-transduced (NTD) control non-activated T cells (n = 10 per group). d, e, Absolute peripheral blood CD45+ T cell counts in blood collected from mice shown in panels (c) at d, 13 days (P = 0.0065), and e, 26 days (P = 0.0012) following T cell transfer measured by a TruCount assay. The mean of each group is indicated by the solid black line. Groups were compared using the two-tailed, unpaired Mann–Whitney test. Source data

References

    1. Salter AI, Pont MJ, Riddell SR. Chimeric antigen receptor-modified T cells: CD19 and the road beyond. Blood. 2018;131:2621–2629. doi: 10.1182/blood-2018-01-785840. - DOI - PMC - PubMed
    1. Brudno JN, et al. T cells genetically modified to express an anti-B-cell maturation antigen chimeric antigen receptor cause remissions of poor-prognosis relapsed multiple myeloma. J. Clin. Oncol. 2018;36:2267–2280. doi: 10.1200/JCO.2018.77.8084. - DOI - PMC - PubMed
    1. Cohen AD, et al. B cell maturation antigen-specific CAR T cells are clinically active in multiple myeloma. J. Clin. Investig. 2019;129:2210–2221. doi: 10.1172/JCI126397. - DOI - PMC - PubMed
    1. D’Angelo SP, et al. Antitumor activity associated with prolonged persistence of adoptively transferred NY-ESO-1 (c259)T cells in synovial sarcoma. Cancer Discov. 2018;8:944–957. doi: 10.1158/2159-8290.CD-17-1417. - DOI - PMC - PubMed
    1. Raje N, et al. Anti-BCMA CAR T-cell therapy bb2121 in relapsed or refractory multiple myeloma. N. Engl. J. Med. 2019;380:1726–1737. doi: 10.1056/NEJMoa1817226. - DOI - PMC - PubMed

Publication types

Substances