. 2022 Sep;43(9):2325-2339.
doi: 10.1038/s41401-022-00865-y. Epub 2022 Feb 21.

Puerarin-V prevents the progression of hypoxia- and monocrotaline-induced pulmonary hypertension in rodent models

Affiliations

Puerarin-V prevents the progression of hypoxia- and monocrotaline-induced pulmonary hypertension in rodent models

Di Chen et al. Acta Pharmacol Sin. 2022 Sep.

Abstract

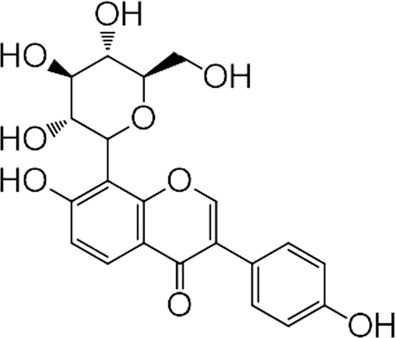
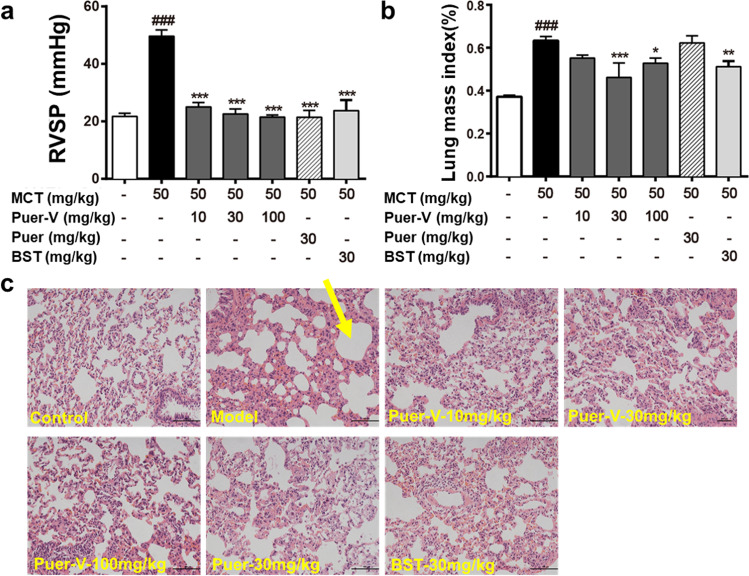
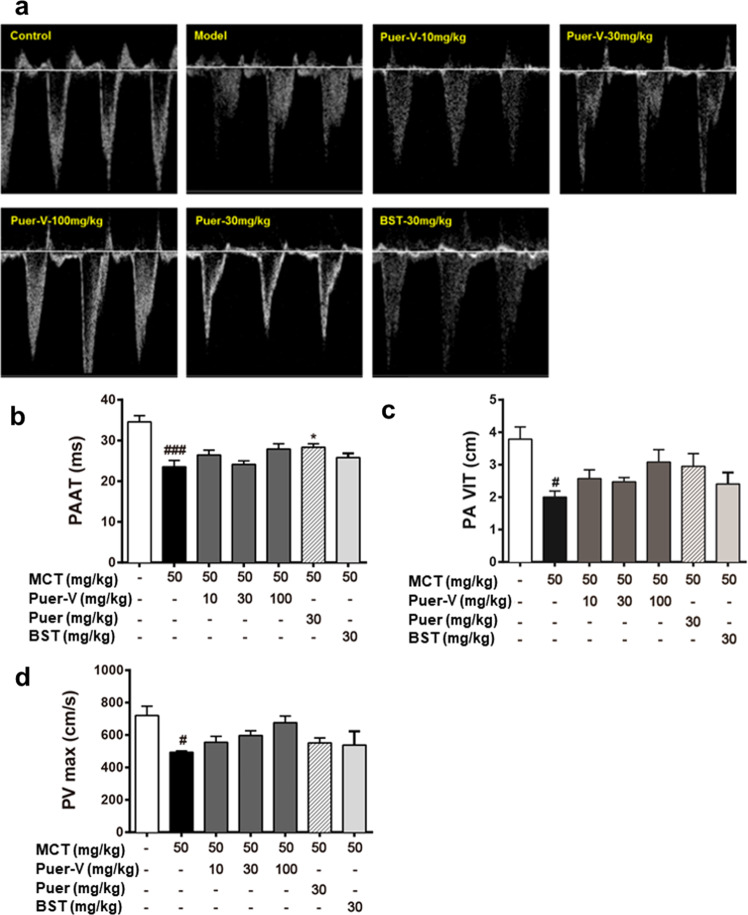
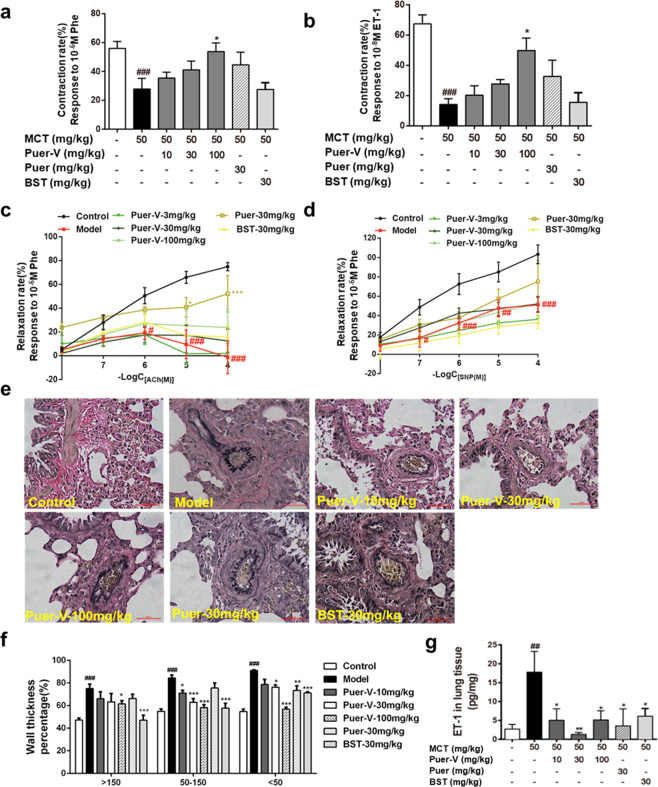
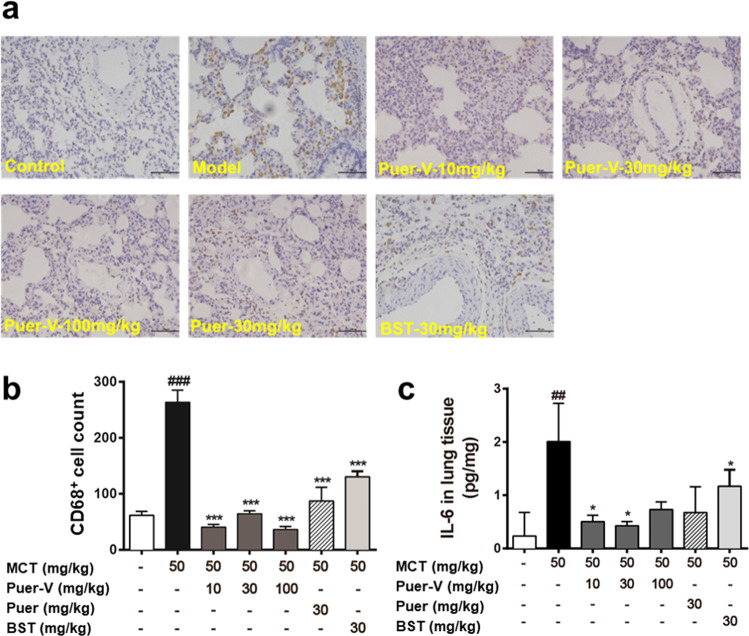
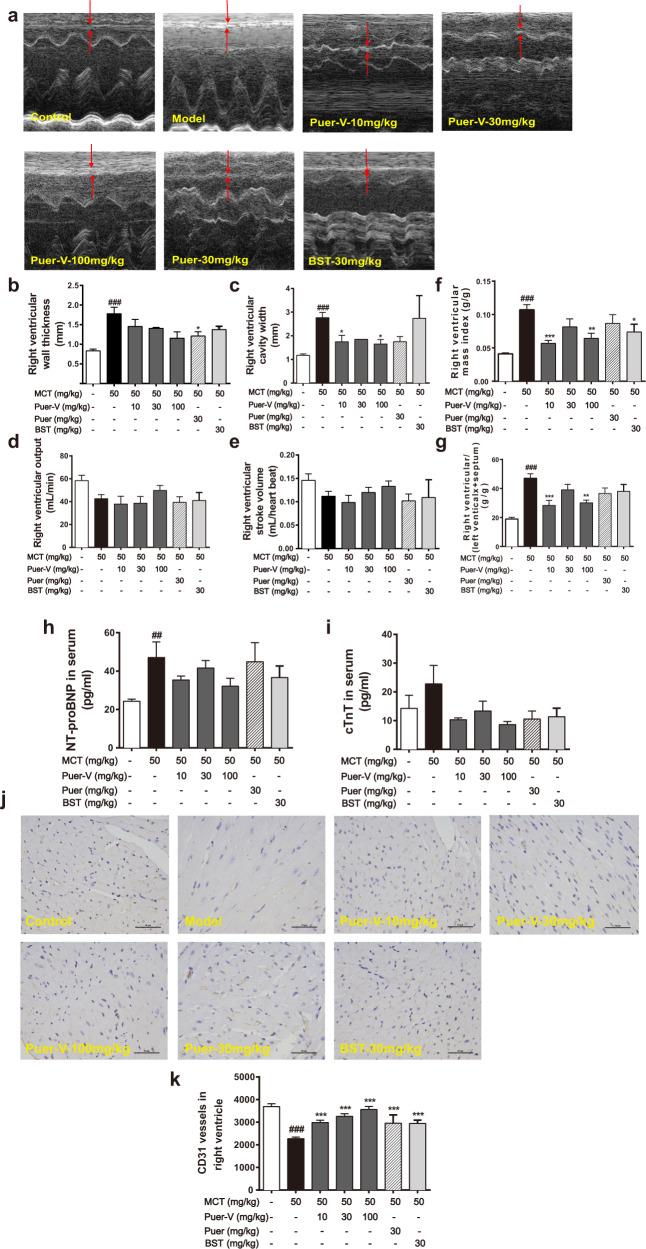
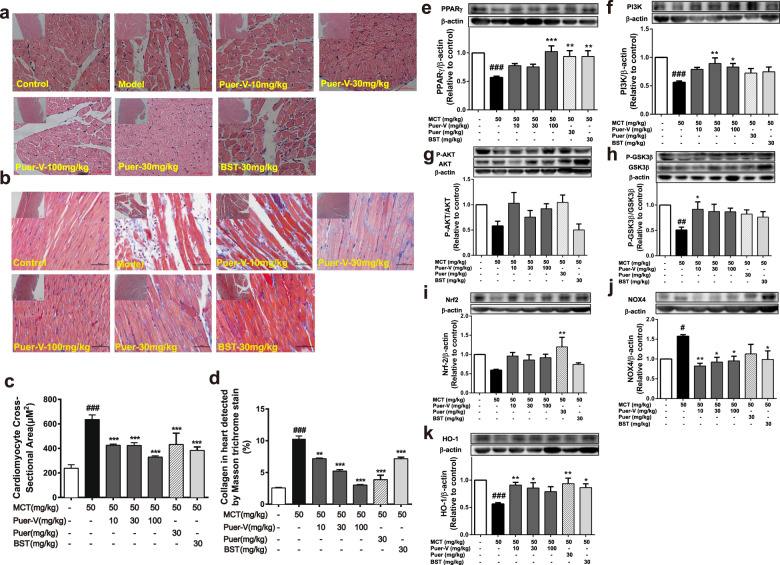
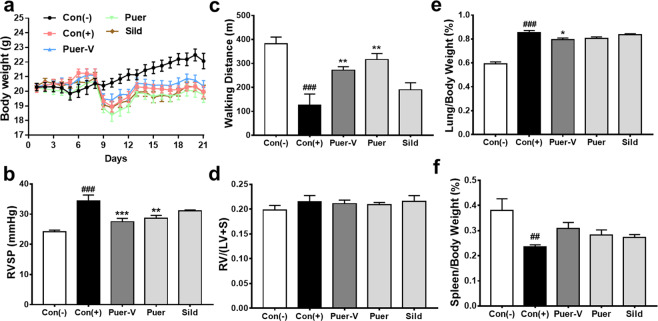
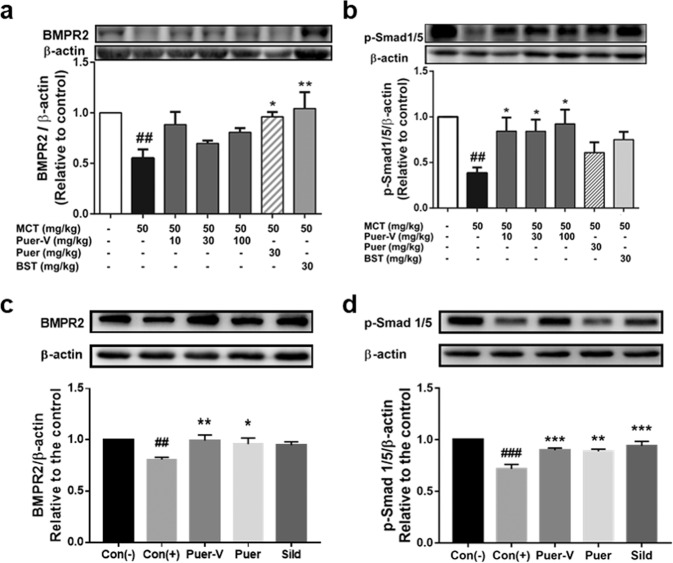
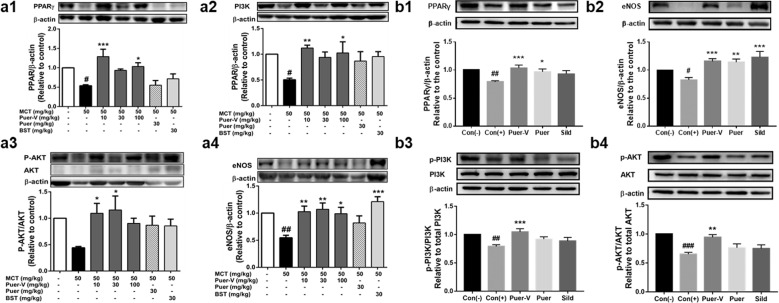
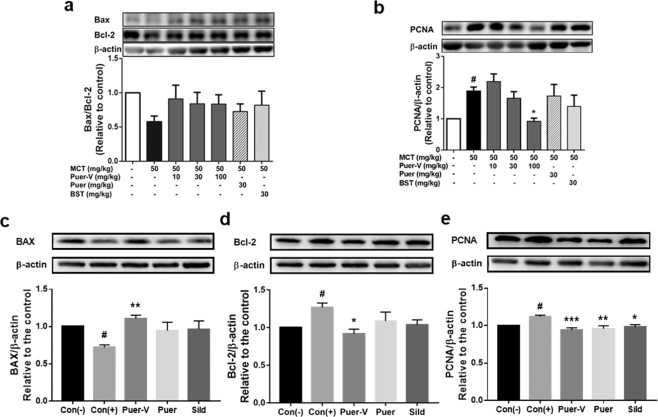
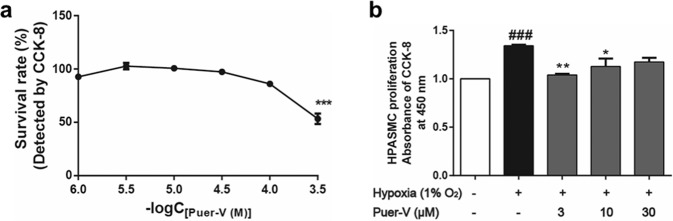
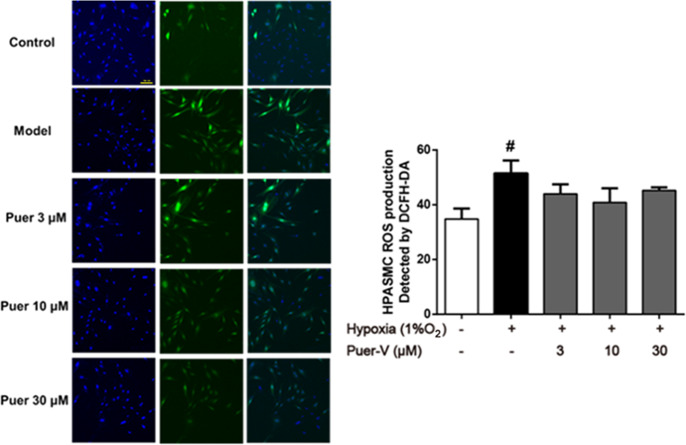
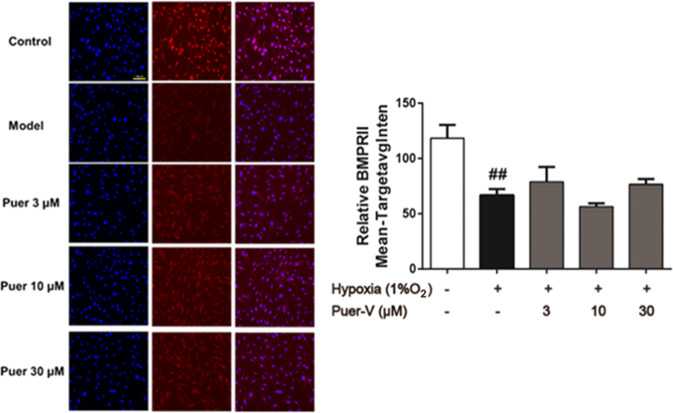
Pulmonary hypertension (PH) is a cardiopulmonary disease characterized by a progressive increase in pulmonary vascular resistance. One of the initial pathogenic factors of PH is pulmonary arterial remodeling under various stimuli. Current marketed drugs against PH mainly relieve symptoms without significant improvement in overall prognosis. Discovering and developing new therapeutic drugs that interfere with vascular remodeling is in urgent need. Puerarin is an isoflavone compound extracted from the root of Kudzu vine, which is widely used in the treatment of cardiovascular diseases. In the present study, we evaluated the efficacy of puerarin in the treatment of experimental PH. PH was induced in rats by a single injection of MCT (50 mg/kg, sc), and in mice by exposure to hypoxia (10% O2) for 14 days. After MCT injection the rats were administered puerarin (10, 30, 100 mg · kg-1 · d-1, i.g.) for 28 days, whereas hypoxia-treated mice were pre-administered puerarin (60 mg · kg-1 · d-1, i.g.) for 7 days. We showed that puerarin administration exerted significant protective effects in both experimental PH rodent models, evidenced by significantly reduced right ventricular systolic pressure (RVSP) and lung injury, improved pulmonary artery blood flow as well as pulmonary vasodilation and contraction function, inhibited inflammatory responses in lung tissues, improved resistance to apoptosis and abnormal proliferation in lung tissues, attenuated right ventricular injury and remodeling, and maintained normal function of the right ventricle. We revealed that MCT and hypoxia treatment significantly downregulated BMPR2/Smad signaling in the lung tissues and PPARγ/PI3K/Akt signaling in the lung tissues and right ventricles, which were restored by puerarin administration. In addition, we showed that a novel crystal type V (Puer-V) exerted better therapeutic effects than the crude form of puerarin (Puer). Furthermore, Puer-V was more efficient than bosentan (a positive control drug) in alleviating the abnormal structural changes and dysfunction of lung tissues and right ventricles. In conclusion, this study provides experimental evidence for developing Puer-V as a novel therapeutic drug to treat PH.

Keywords: Puer-V; puerarin; pulmonary arterial remodeling; pulmonary hypertension; right ventricular remodeling; vascular function.


Conflict of interest statement

The authors declare no competing interests.

Figures

Fig. 1
Fig. 1. The chemical structure of puerarin.
Puerarin: 7,4-dihydroxy-8-β-D-glucosyl isoflavone; C21H20O9, Mw, 416.38.
Fig. 2
Fig. 2. Effects of Puer-V on RVSP and lung injury in rats with MCT-induced PAH.
a RVSP of rats in different groups. b The weight ratio of the lung to the whole body. The results are presented as the mean ± SEM, ###P < 0.001 vs. the control group, *P < 0.05, **P < 0.01, ***P < 0.001 vs. the model group. n = 15. c Representative photos of lung tissues stained by H&E (×200). The yellow arrow indicates the area of edema.
Fig. 3
Fig. 3. The influence of Puer-V on the pulmonary artery blood flow of the rats with PAH.
a Representative pictures of pulmonary blood flow. b PAAT, c PA VIT, and d PVmax of the rats in each group. The results are presented as the mean ± SEM, #P < 0.05, ###P < 0.001 vs. the control group, *P < 0.05 vs. the model group, n = 3.
Fig. 4
Fig. 4. The influence of Puer-V on pulmonary vascular compliance.
a Contraction rate response to 1 μM Phe, b contraction rate response to 0.01 μM ET-1, c relaxation induced by ACh in pulmonary arteries preconstricted by 1 μM Phe, d relaxation induced by SNP in pulmonary arteries preconstricted by 1 μM Phe. e EVG staining of pulmonary arteries (400×) and f quantitative results of the wall thickness percentage. g The level of ET-1 in lung tissues of the rats with PAH. The results are presented as the mean ± SEM, #P < 0.05, ##P < 0.01, ###P < 0.001 vs. the control group, *P < 0.05, **P < 0.01, ***P < 0.001 vs. the model group. n = 6.
Fig. 5
Fig. 5. The influence of Puer-V on the inflammatory response in lung tissues.
Immunohistochemistry for CD68 on lung sections. The photos were obtained from an optical microscope (a) (200×), and quantification of CD68 positive cells was performed by ImageJ (b). The influence of Puer-V on IL-6 (c) in lung tissues of the rats with PAH. The results are presented as the mean ± SEM, ##P < 0.01, ###P < 0.001 vs. the control group, *P < 0.05, ***P < 0.001 vs. the model group, n = 6.
Fig. 6
Fig. 6. Effects of Puer-V on right ventricular function and myocardial damage in the rats with MCT-induced PAH.
a Representative images of M-mode recording through the right ventricle. b Right ventricle wall thickness, c right ventricle cavity width, d right ventricular output and e right ventricular stroke volume of rats in each group. The weight ratio of f the right ventricle to the whole body and g the right ventricular hypertrophy index of rats in each group. Detection of NT-pro BNP (h) and cTnT (i) levels in serum (n = 6). The influence of Puer-V on the microvessel density of the right ventricle was detected by CD31 staining, and photos (j) were obtained from optical microscope (×400) and analyzed by ImageJ (k). The results are presented as the mean ± SEM, ##P < 0.01, ###P < 0.001 vs. the control group, *P < 0.05, **P < 0.01, ***P < 0.001 vs. the model group, n = 4.
Fig. 7
Fig. 7. Effects of Puer-V on right ventricular remodeling.
The shape of right ventricular cardiomyocytes was detected by H&E staining, and photos were obtained with an optical microscope (a) and analyzed by ImageJ (c). The influence of Puer-V on collagen deposition in the right ventricle was detected by Masson staining. Photos were obtained with an optical microscope (b) and analyzed by ImageJ (d). (Small images magnified ×100; large images magnified ×400). ek The influence of Puer-V on PPARγ/PI3K/Akt pathway and oxidative pathway in the right ventricle of the rats with MCT-induced PAH. Densitometric analysis of the relative expression level of each protein compared to β-actin is shown in the lower panel, and representative pictures are shown in the upper panel. The results are presented as the mean ± SEM, #P < 0.05, ##P < 0.01, ###P < 0.001 vs. the control group, *P < 0.05, **P < 0.01, ***P < 0.001 vs. the model group, n = 4.
Fig. 8
Fig. 8. Efficacy of Puer-V on the mice with HPH.
a Body weight change of mice in different groups during the experiment. The influence of Puer-V on b RVSP, c walking distance, d right ventricular hypertrophy index, e lung index and f spleen index. The results are presented as the mean ± SEM, ##P < 0.01, ###P < 0.001 vs. the control group, *P < 0.05, **P < 0.01, ***P < 0.001 vs. the model group, n = 6.
Fig. 9
Fig. 9. Effects of Puer-V on the BMPR2/Smad pathway in lung tissues of the rats with PAH and mice with HPH.
Densitometric analysis of the relative expression level of each protein compared to β-actin is shown in the lower panel, and representative pictures are shown in the upper panel: a BMPR2 and b p-Smad1/5 in lung tissues of the rats with PAH, c BMPR2 and d p-Smad1/5 in lung tissues of mice with HPH. The results are presented as the mean ± SEM, ##P < 0.01, ###P < 0.001 vs. the control group, *P < 0.05, **P < 0.01, ***P < 0.001 vs. the model group, n = 4.
Fig. 10
Fig. 10. Effects of Puer-V on the PPARγ/PI3K/Akt pathway in lung tissues of the rats with PAH and mice with HPH.
Densitometric analysis of the relative expression level of each protein compared to β-actin is shown in the lower panel, and representative pictures are shown in the upper panel: a1 PPARγ, a2 PI3K, a3 p-Akt/Akt, and a4 eNOS in lung tissues of the rats with PAH. b1 PPARγ, b2 eNOS, b3 p-PI3K/PI3K, and b4 p-Akt/Akt in lung tissues of mice with HPH. The results are presented as the mean ± SEM. #P < 0.05, ##P < 0.01 vs. the control group, *P < 0.05, **P < 0.01, ***P < 0.001 vs. the model group, n = 4.
Fig. 11
Fig. 11. Effects of Puer-V on apoptosis and proliferation in lung tissues of the rats with PAH and mice with HPH.
Densitometric analysis of the relative expression level of each protein compared to β-actin is shown in the lower panel, and representative pictures are shown in the upper panel: a Bax, Bcl-2 and b PCNA in lung tissues of the rats with PAH. c Bax, d Bcl-2, and e PCNA in lung tissues of mice with HPH. The results are presented as the mean ± SEM, #P < 0.05 vs. the control group, *P < 0.05, **P < 0.01, ***P < 0.001 vs. the model group, n = 4.
Fig. 12
Fig. 12. Effects of Puer-V on the proliferation of HPASMCs induced by hypoxia.
a The cytotoxicity of Puer-V on HPASMCs. b The effect of Puer-V on the proliferation of HPASMCs induced by hypoxia (1% O2). Values are expressed as the mean ± SEM, ***P < 0.001 vs. the vehicle group for figure a. ###P < 0.001 vs. the normoxia group, *P < 0.05, **P < 0.01 vs. the hypoxia group for figure b, n = 6.
Fig. 13
Fig. 13. Effects of Puer-V on ROS formation in HPASMCs induced by hypoxia.
Representative images (magnified ×200) produced by the HCS system are shown in the left panel. Quantitative results of fluorescence intensity are shown in the right panel. Values are expressed as the mean ± SEM. #P < 0.05 vs. the control group. n = 3.
Fig. 14
Fig. 14. Effects of Puer-V on BMPR2 expression in HPASMCs induced by hypoxia.
Representative images (magnified ×200) produced by the HCS system are shown in the left panel. Quantitative results of fluorescence intensity are shown in the right panel. Values are expressed as the mean ± SEM, n = 3. ##P < 0.01 vs. the control group. n = 3.

References

    1. Rosenkranz S, Howard LS, Gomberg-Maitland M, Hoeper MM. Systemic consequences of pulmonary hypertension and right-sided heart failure. Circulation. 2020;141:678–93.. doi: 10.1161/CIRCULATIONAHA.116.022362. - DOI - PubMed
    1. Simonneau G, Montani D, Celermajer DS, Denton CP, Gatzoulis MA, Krowka M. Haemodynamic definitions and updated clinical classification of pulmonary hypertension. Eur Respir J. 2019;53:1801913. doi: 10.1183/13993003.01913-2018. - DOI - PMC - PubMed
    1. Poch D, Mandel J. Pulmonary hypertension. Ann Intern Med. 2021;174:ITC49–ITC64. doi: 10.7326/AITC202104200. - DOI - PubMed
    1. Lau EMT, Giannoulatou E, Celermajer DS, Humbert M. Epidemiology and treatment of pulmonary arterial hypertension. Nat Rev Cardiol. 2017;14:603–14. doi: 10.1038/nrcardio.2017.84. - DOI - PubMed
    1. Vazquez-Garza E, Bernal-Ramirez J, Jerjes-Sanchez C, Lozano O, Acuna-Morin E, Vanoye-Tamez M, et al. Resveratrol prevents right ventricle remodeling and dysfunction in monocrotaline-induced pulmonary arterial hypertension with a limited improvement in the lung vasculature. Oxid Med Cell Longev. 2020;2020:1841527. doi: 10.1155/2020/1841527. - DOI - PMC - PubMed