. 2022 Apr;28(4):766-779.
doi: 10.1038/s41591-022-01680-y. Epub 2022 Feb 21.

Ulcerative colitis is characterized by a plasmablast-skewed humoral response associated with disease activity

Affiliations

Ulcerative colitis is characterized by a plasmablast-skewed humoral response associated with disease activity

Mathieu Uzzan et al. Nat Med. 2022 Apr.

Abstract

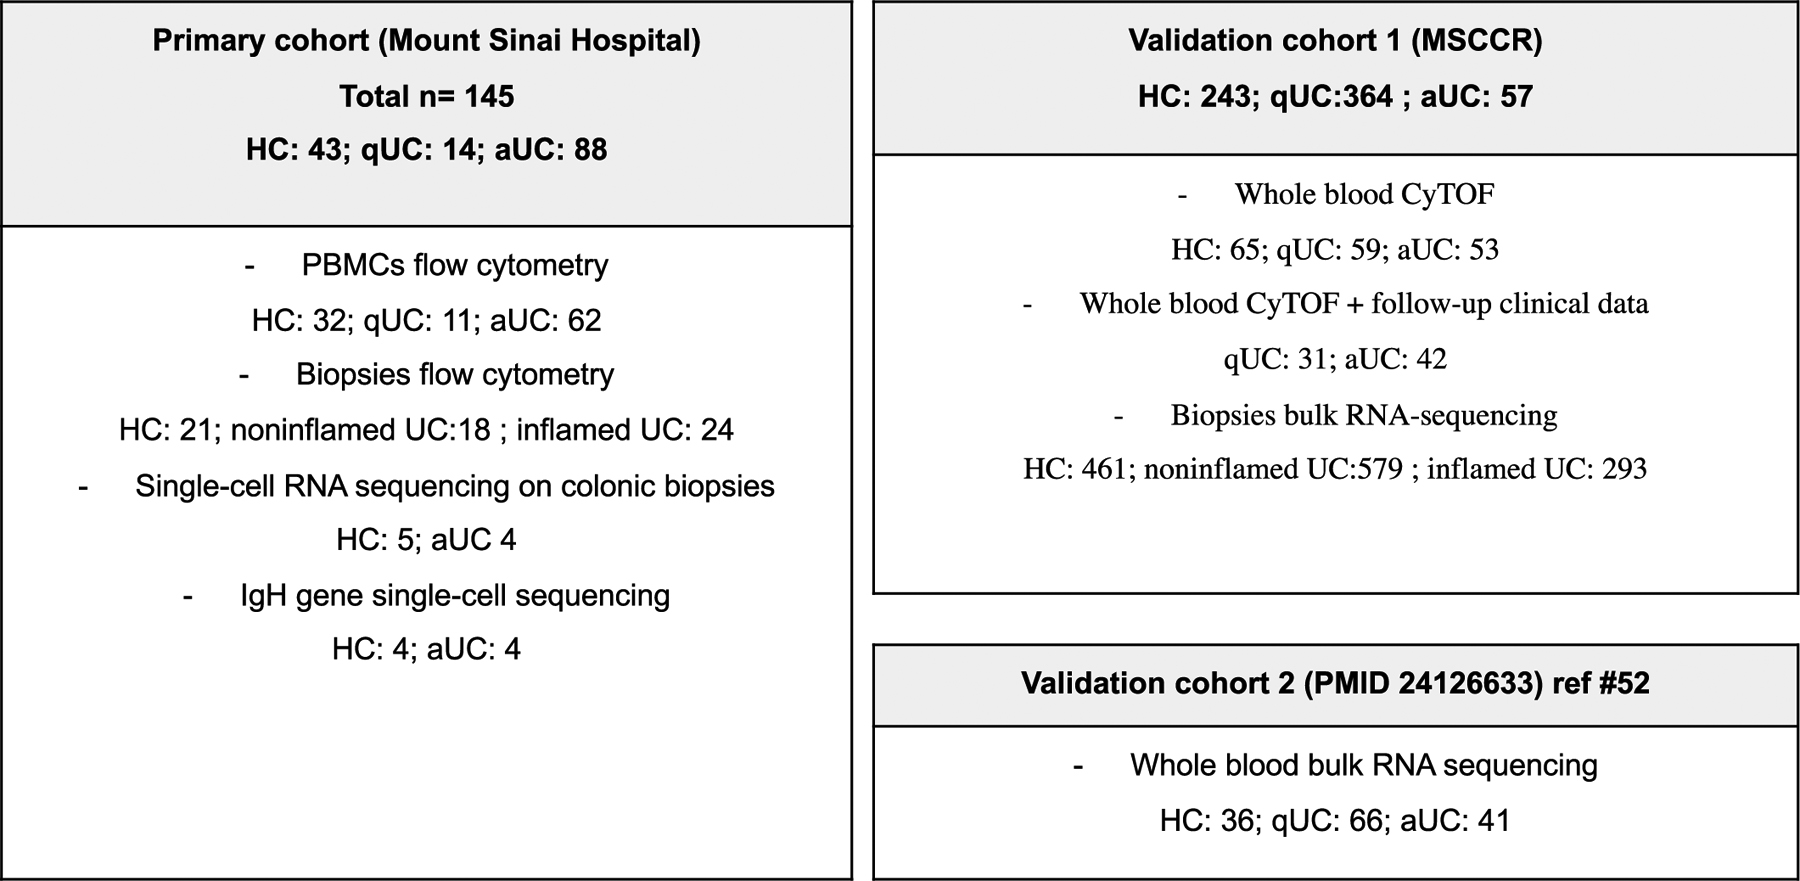
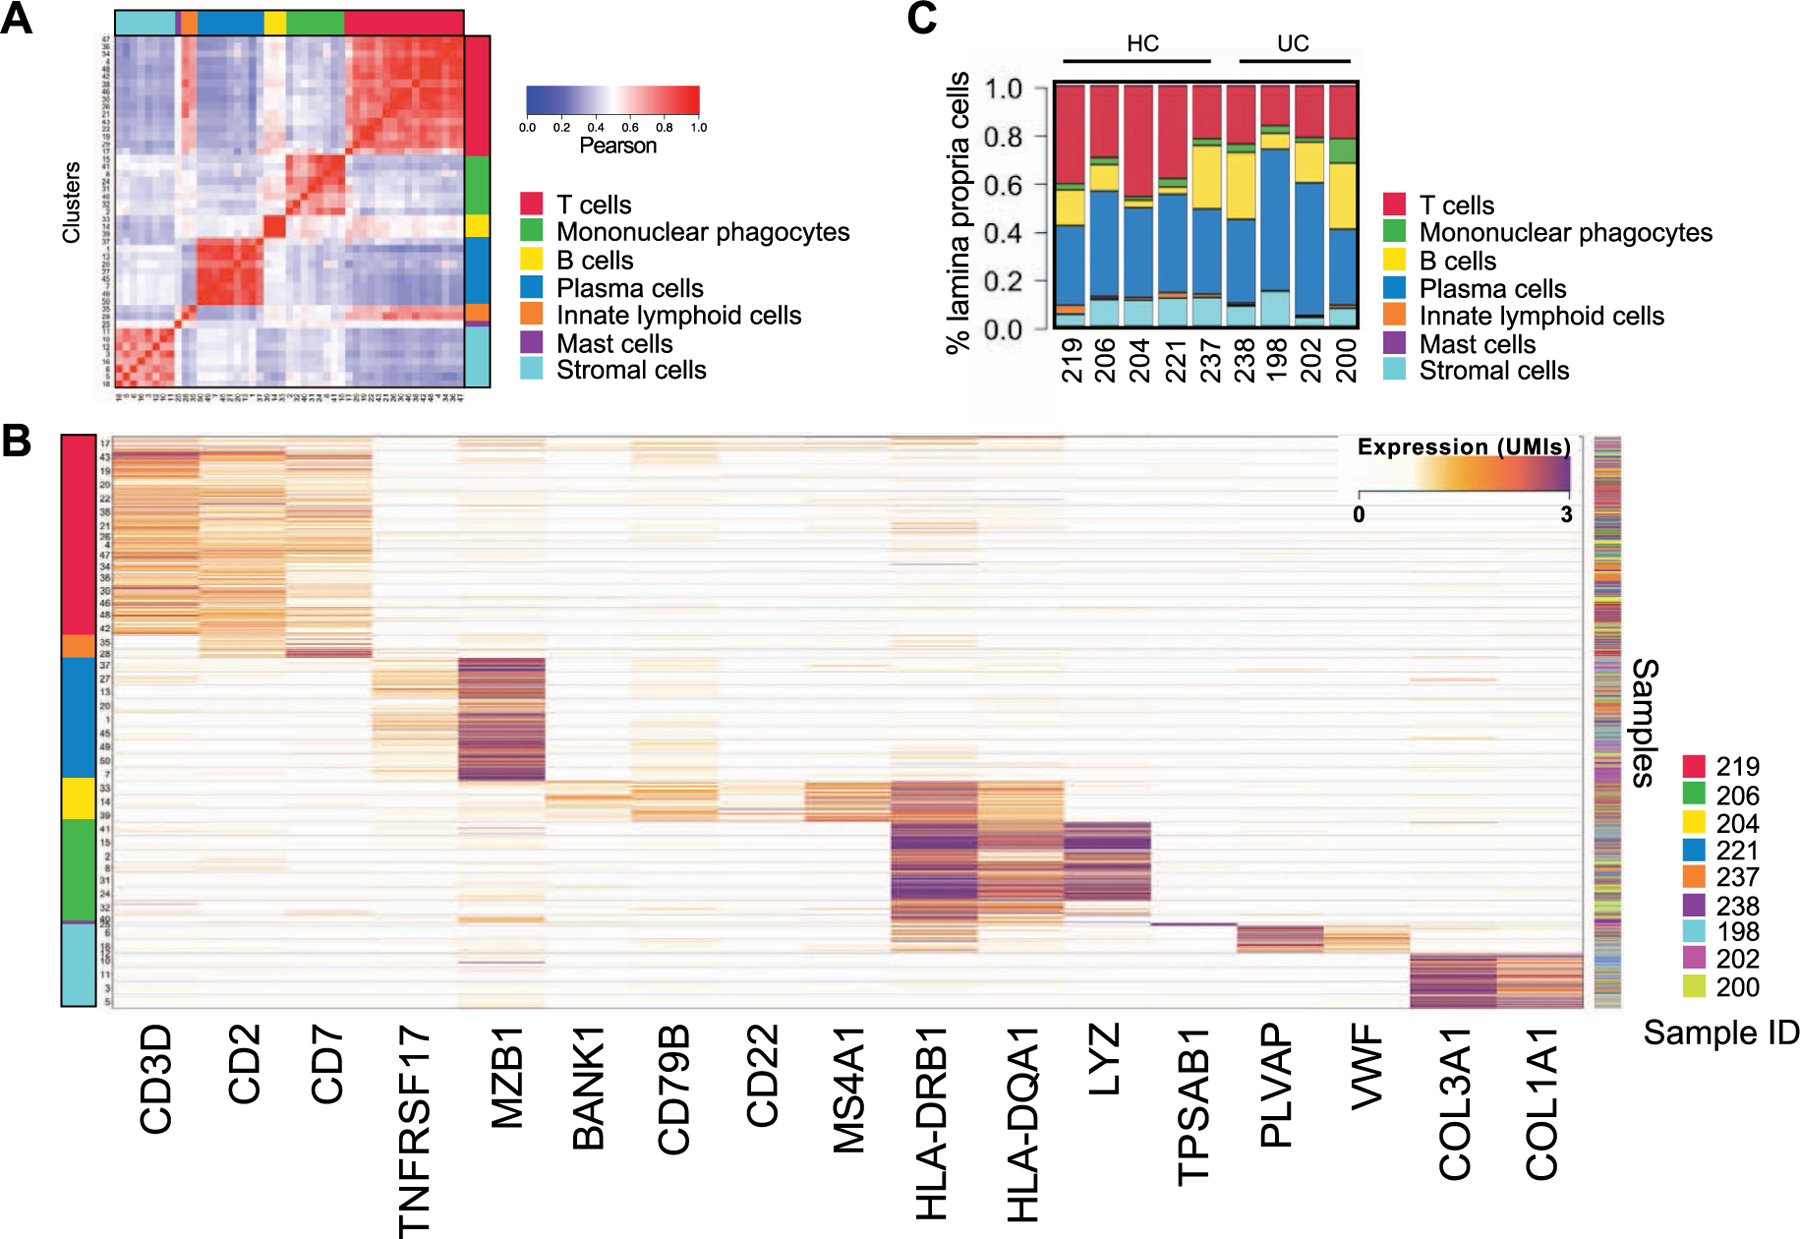
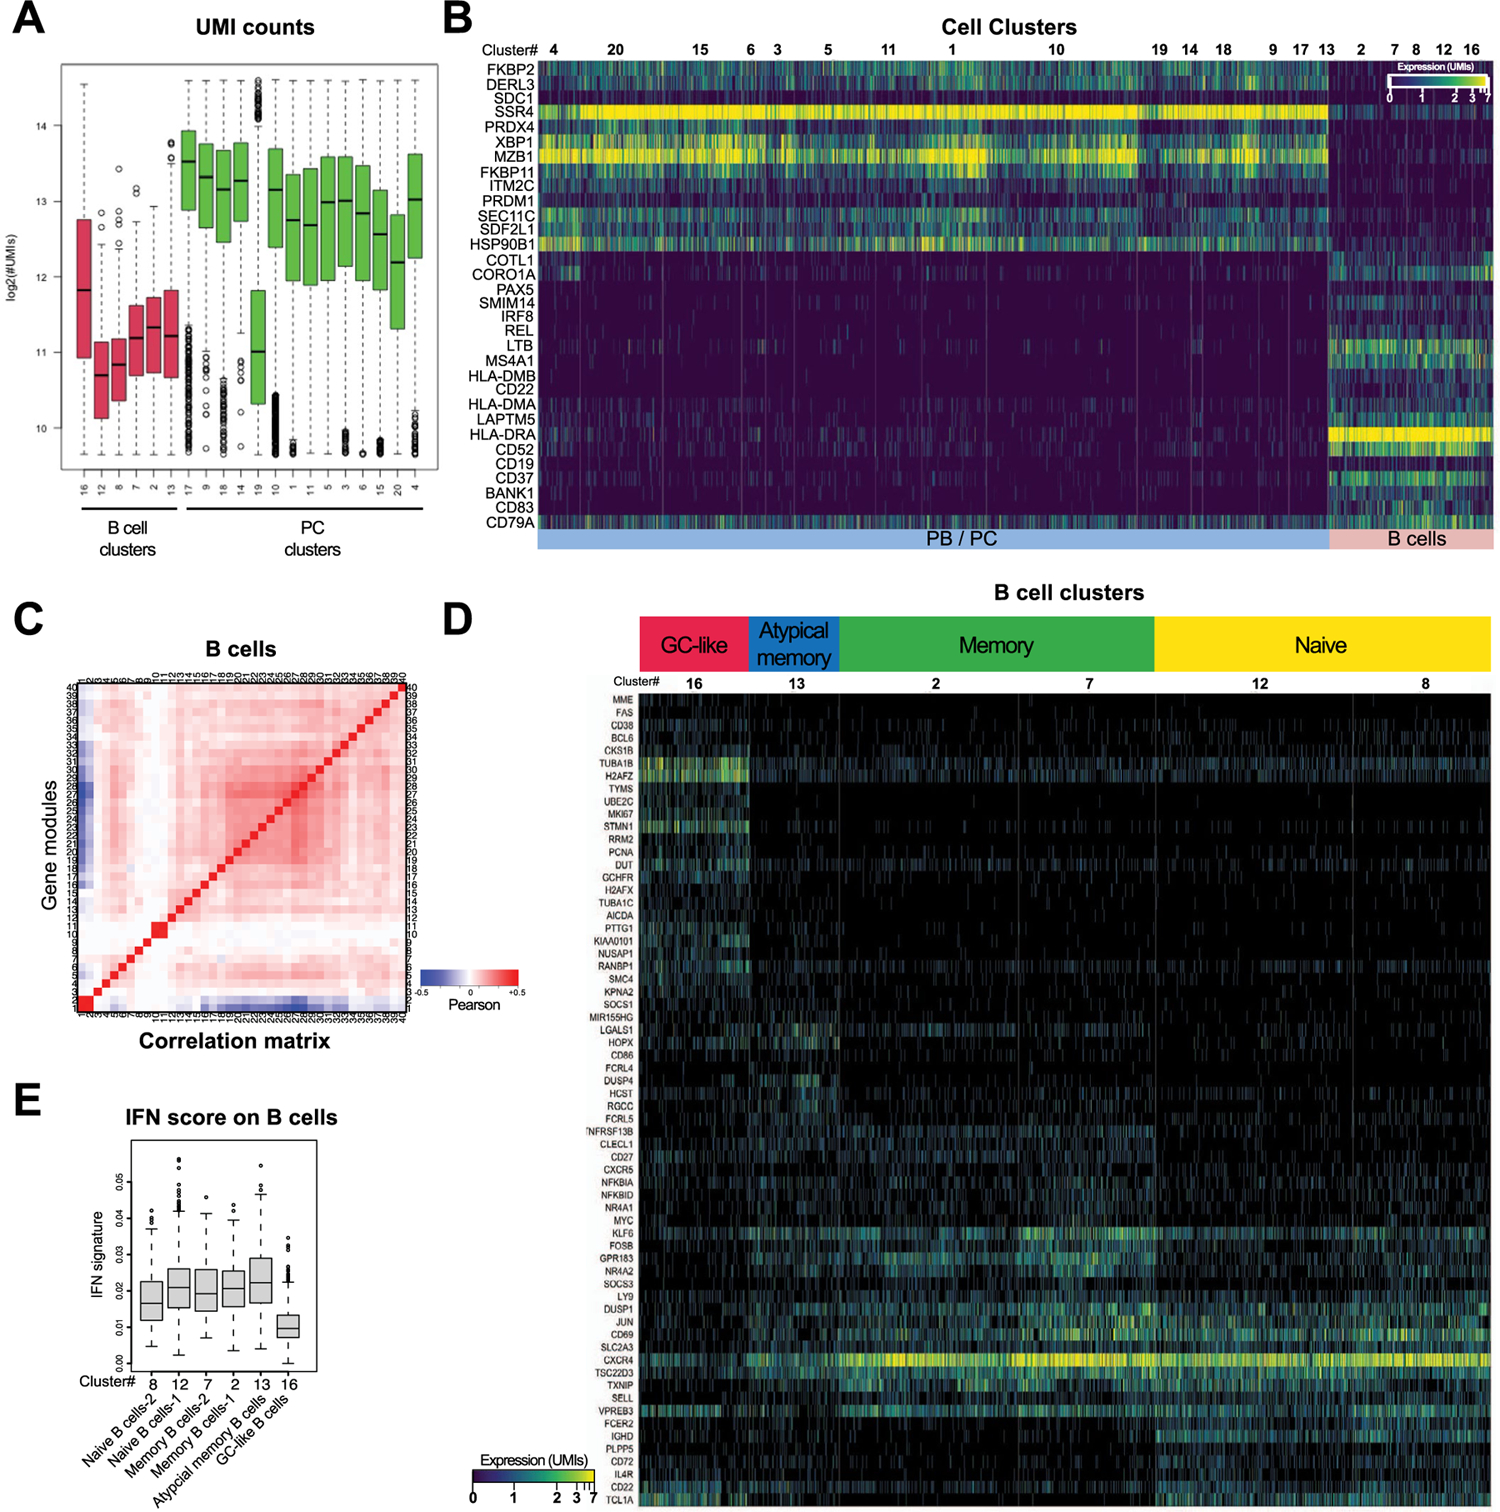
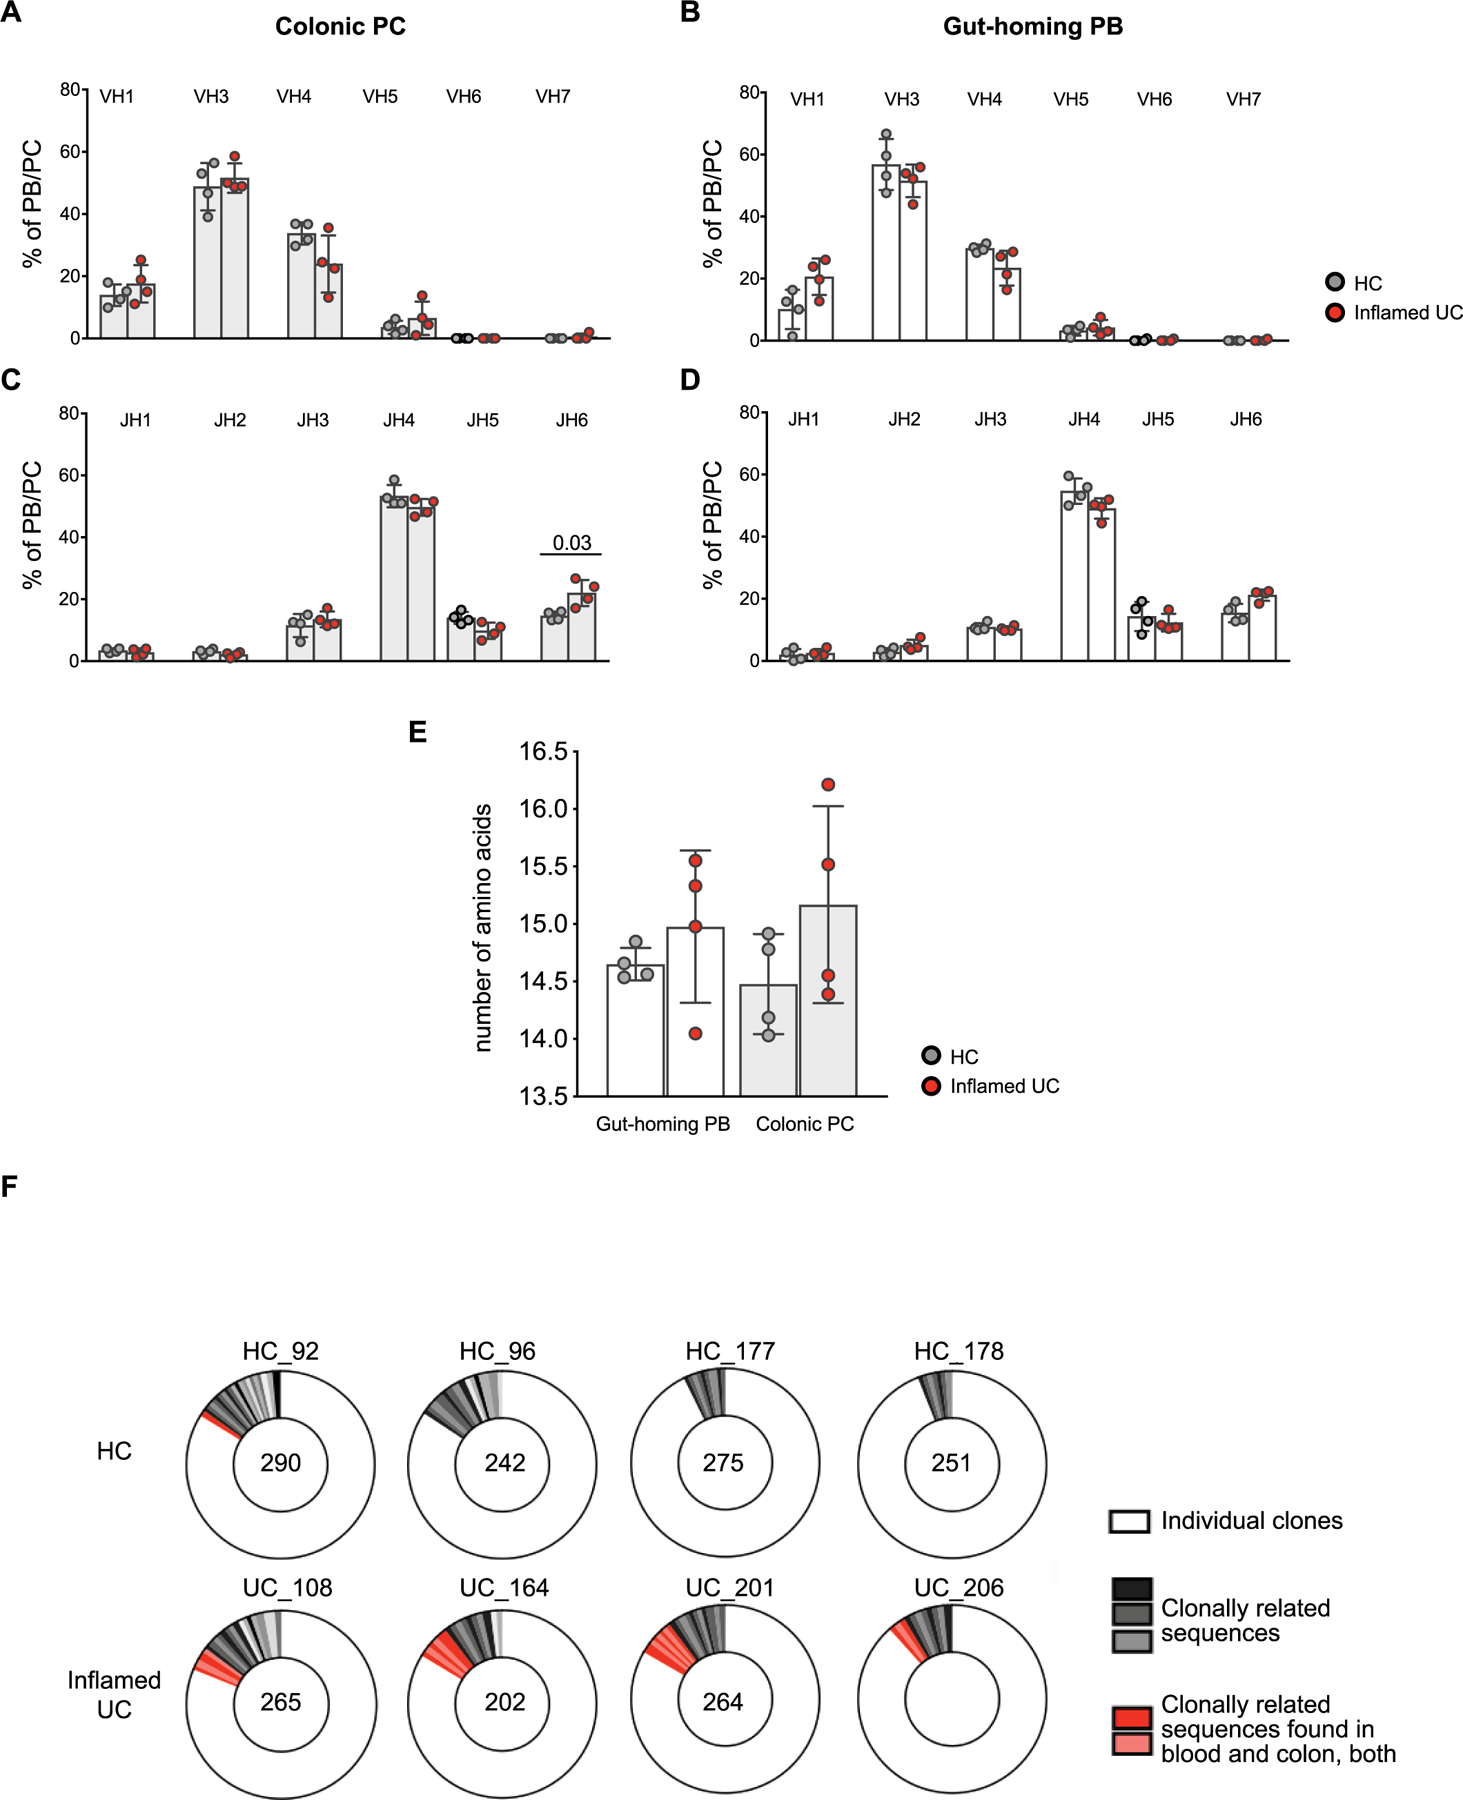
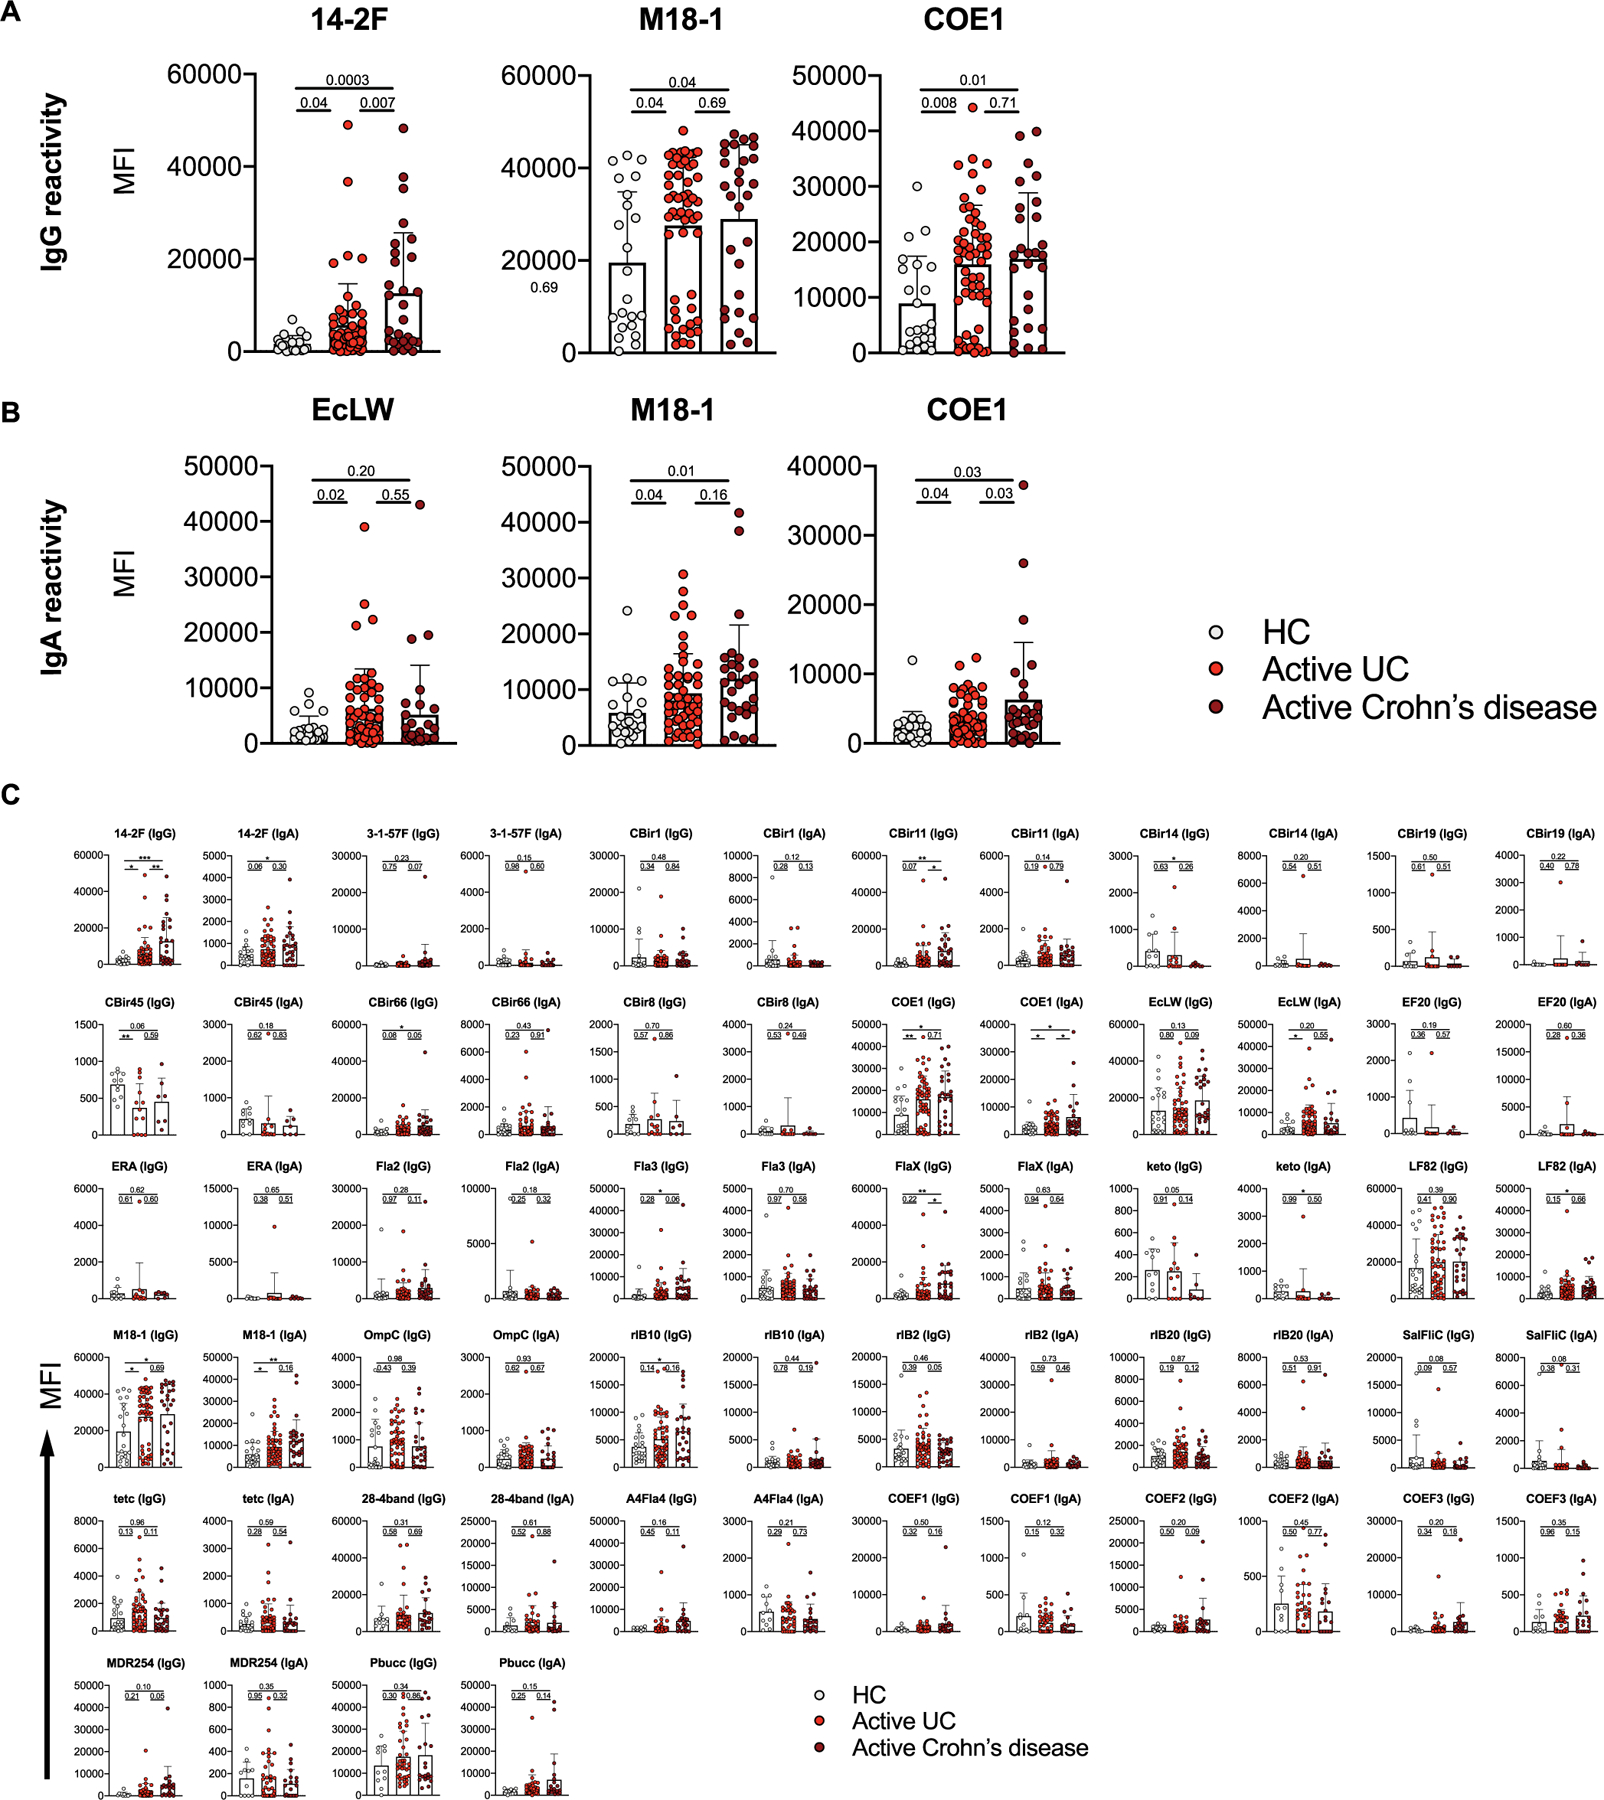
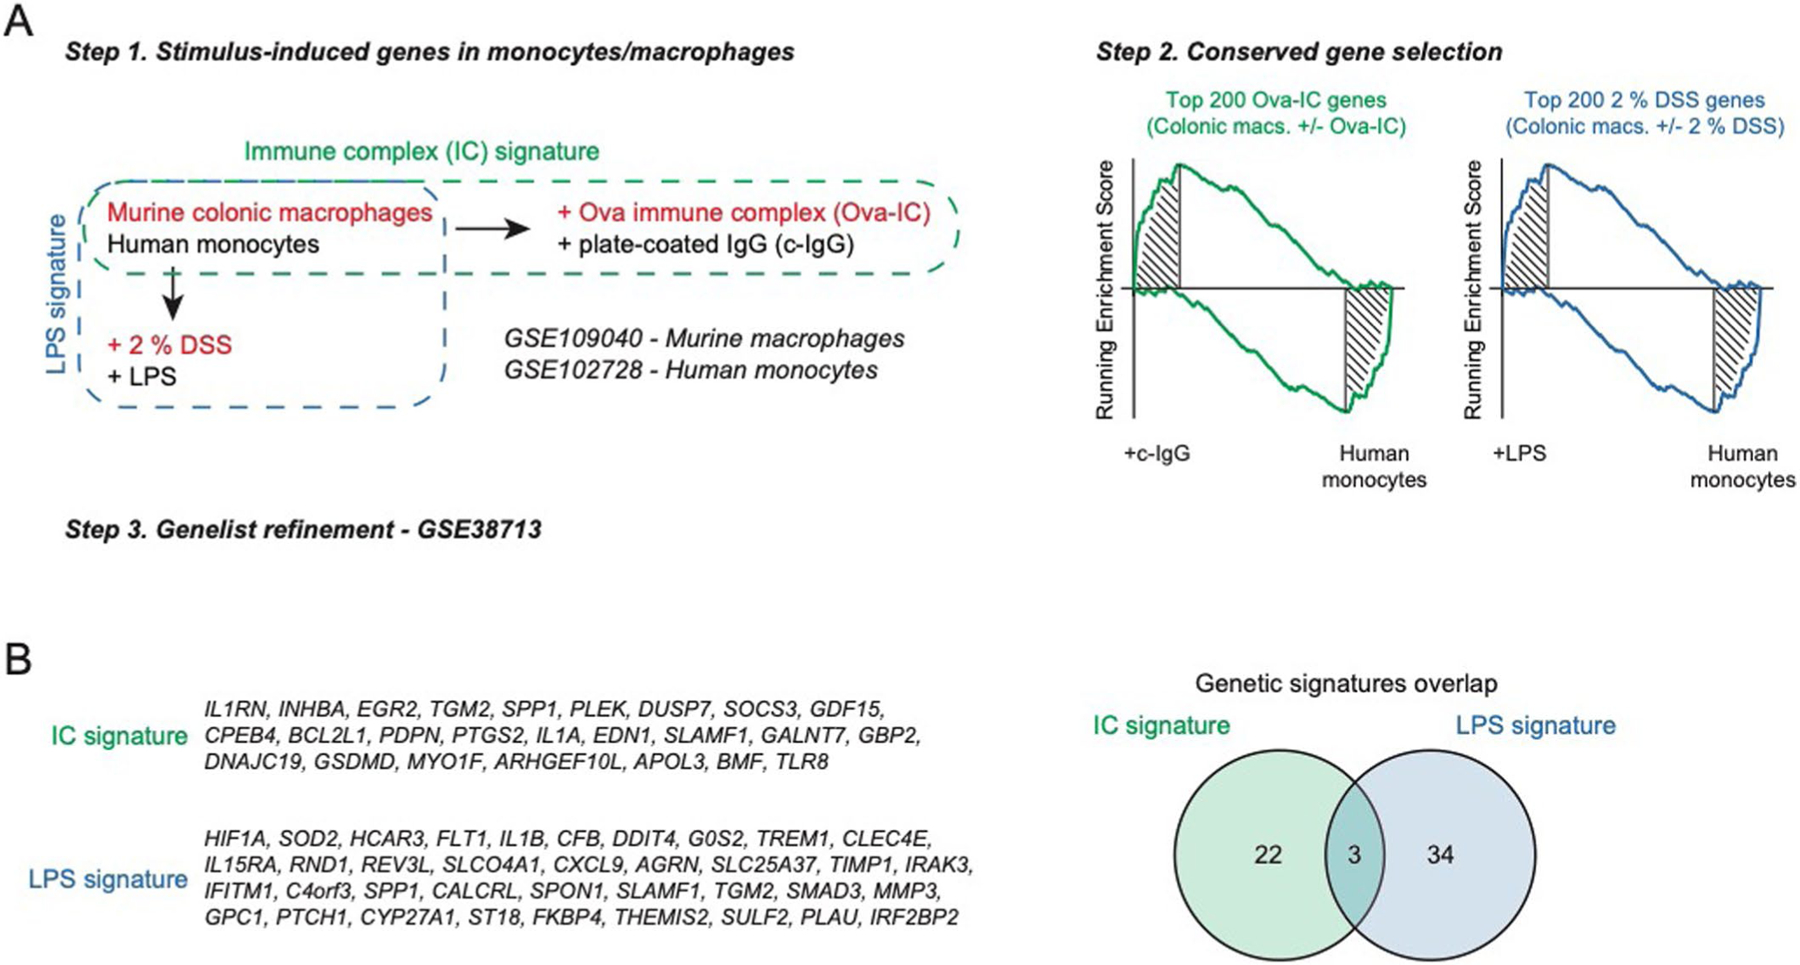
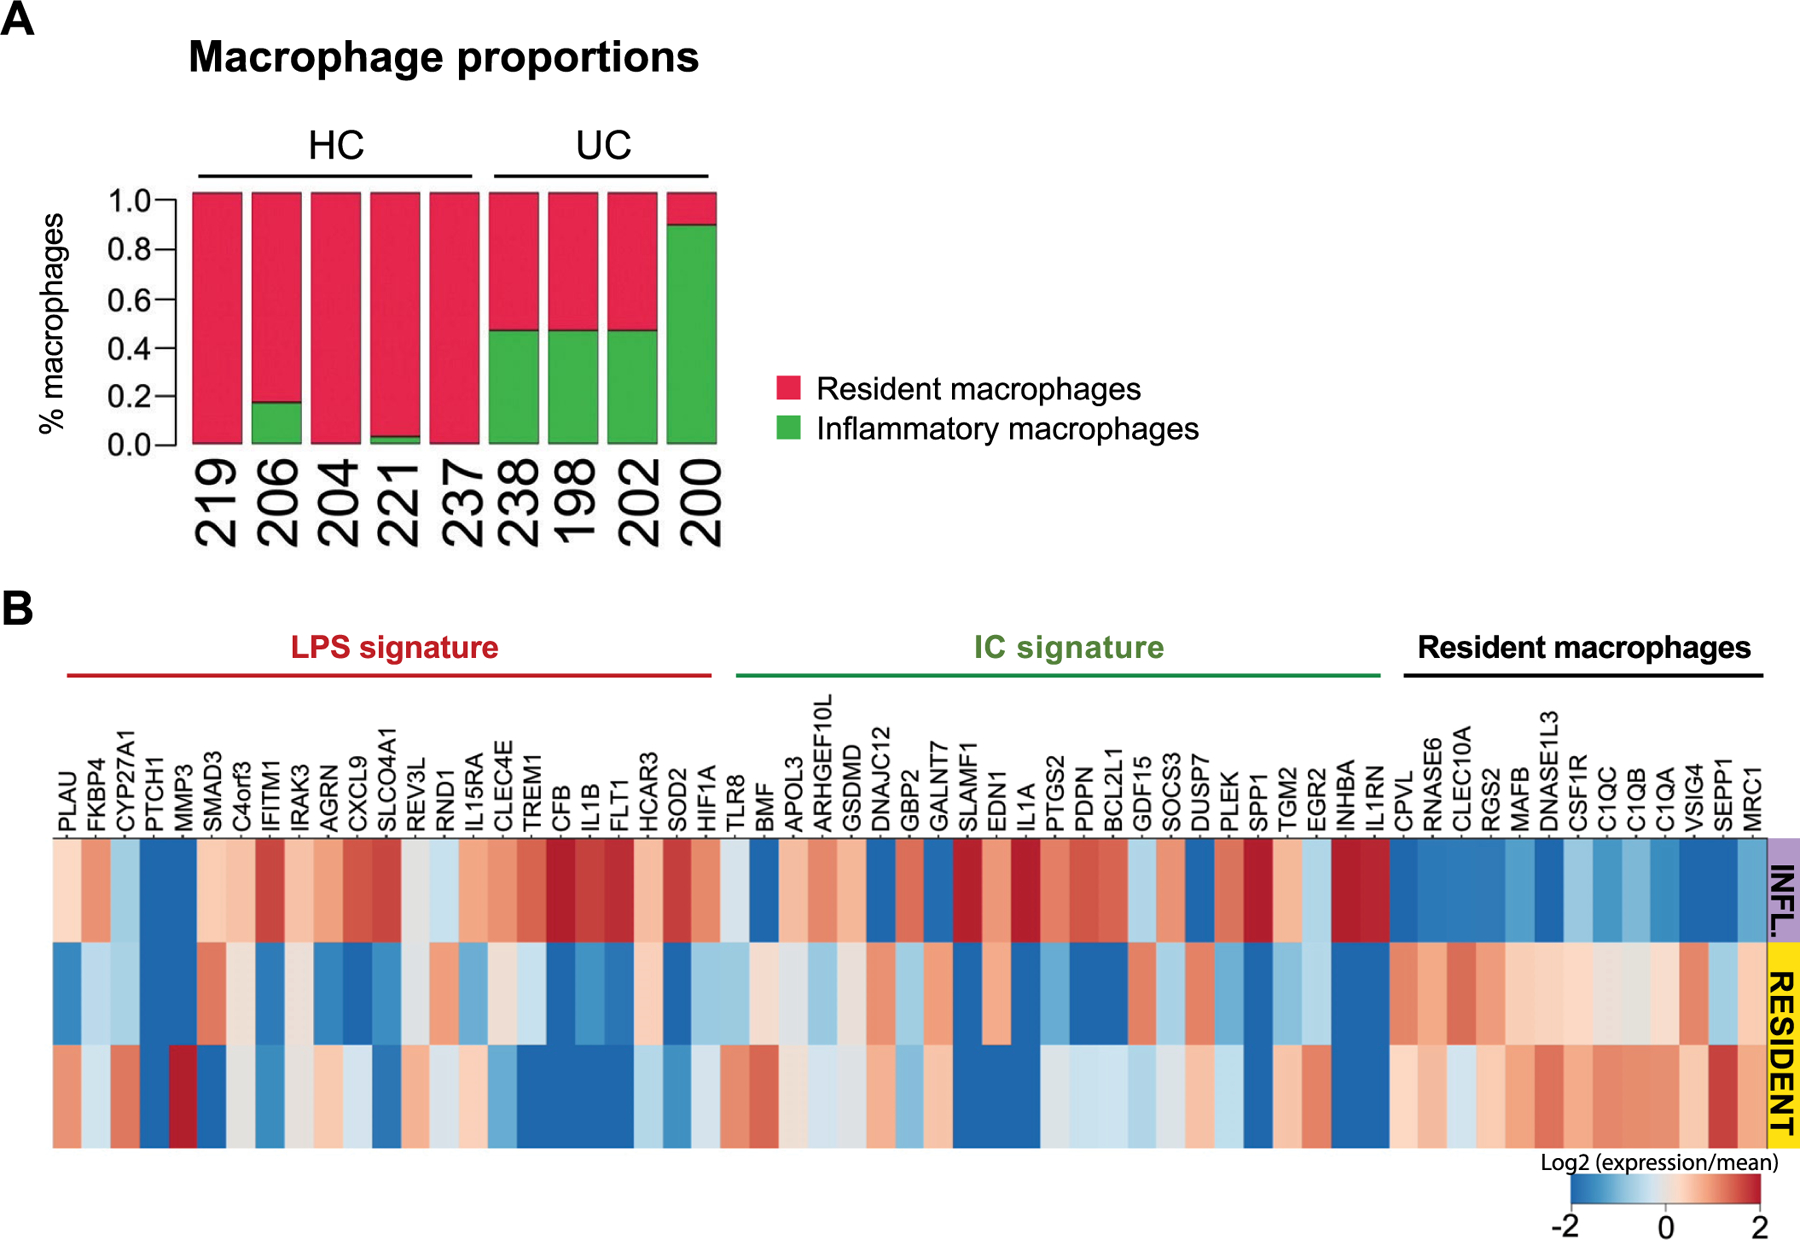
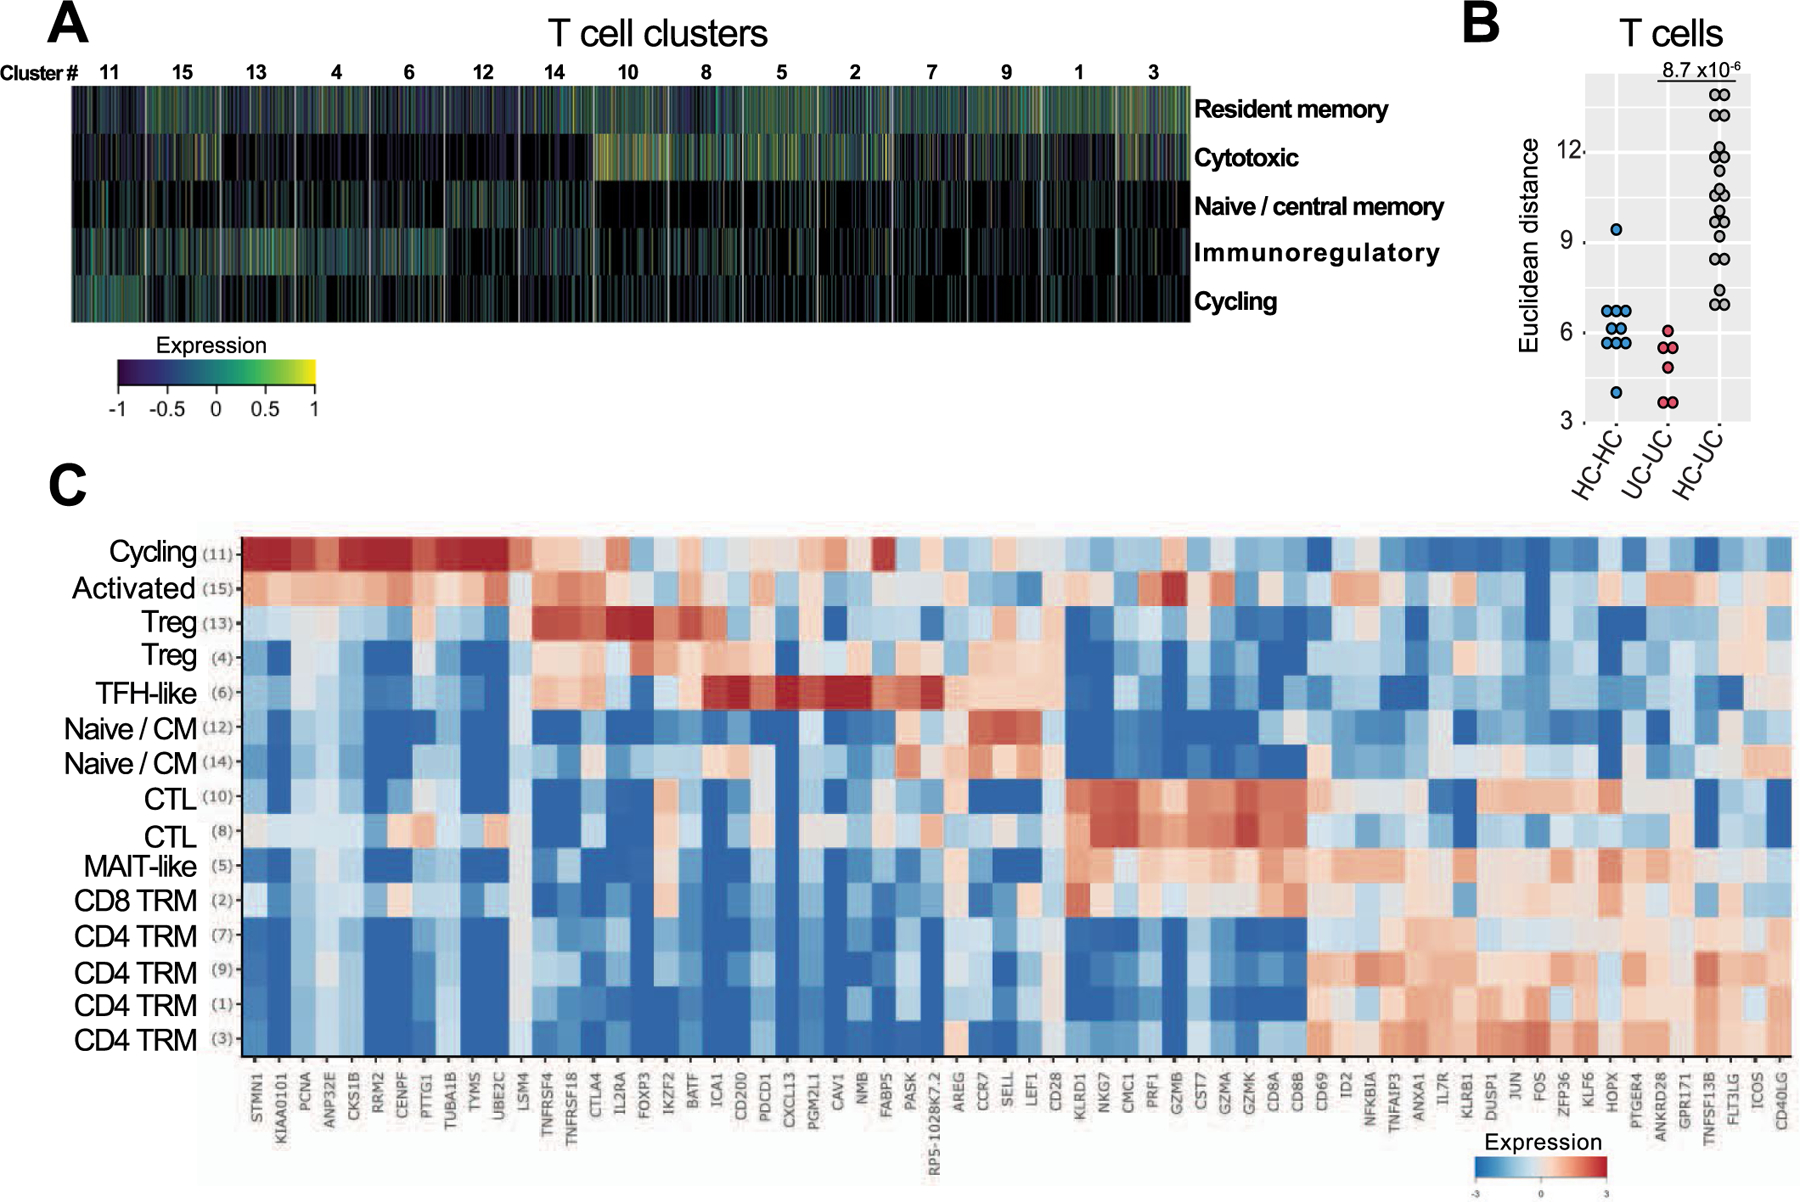
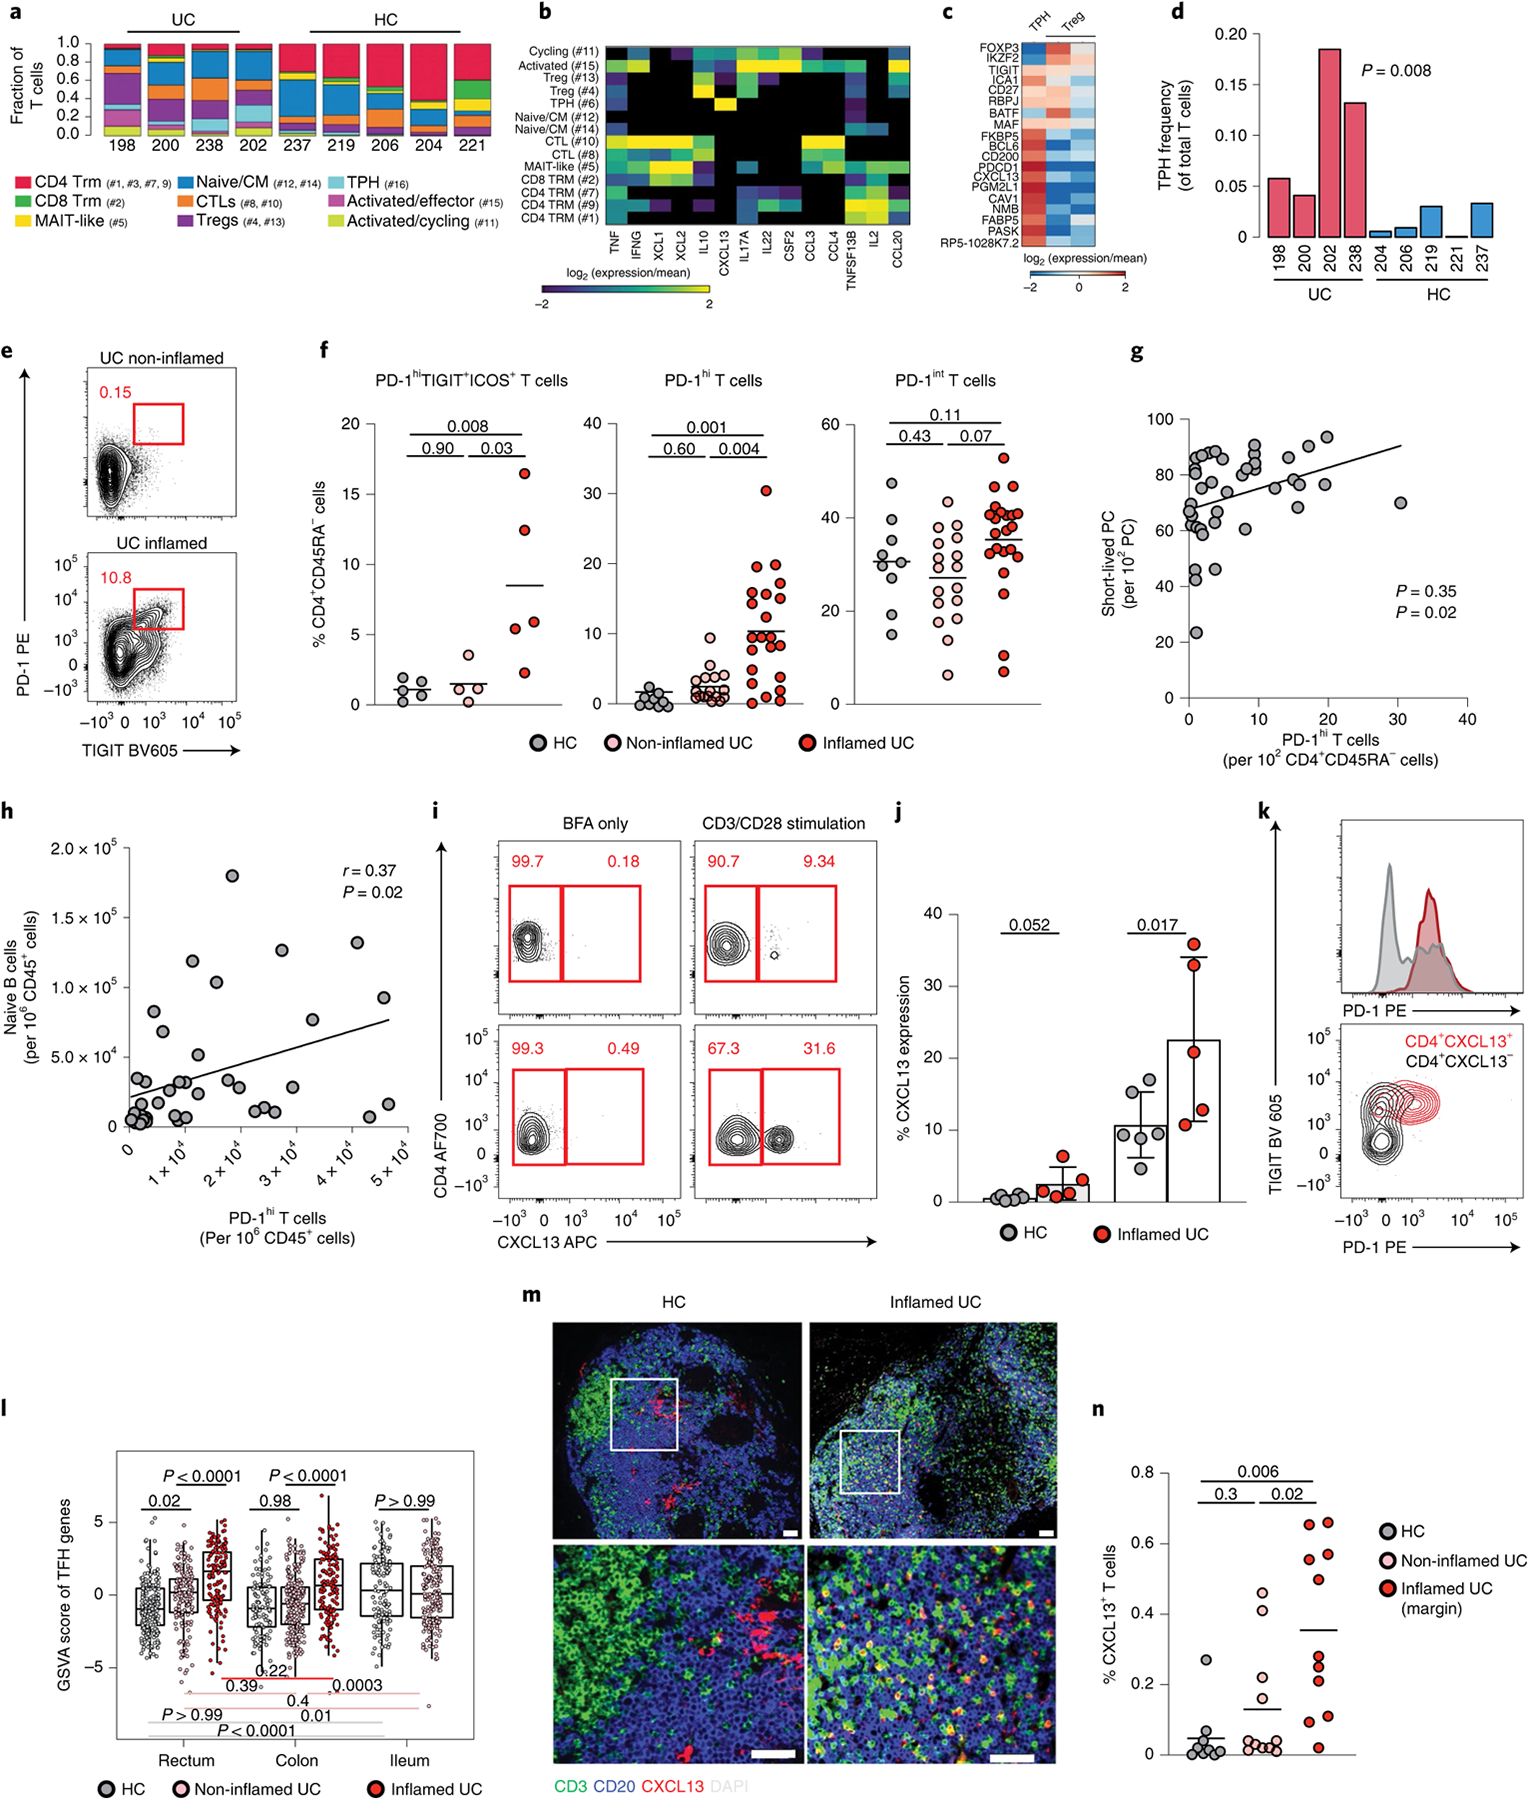
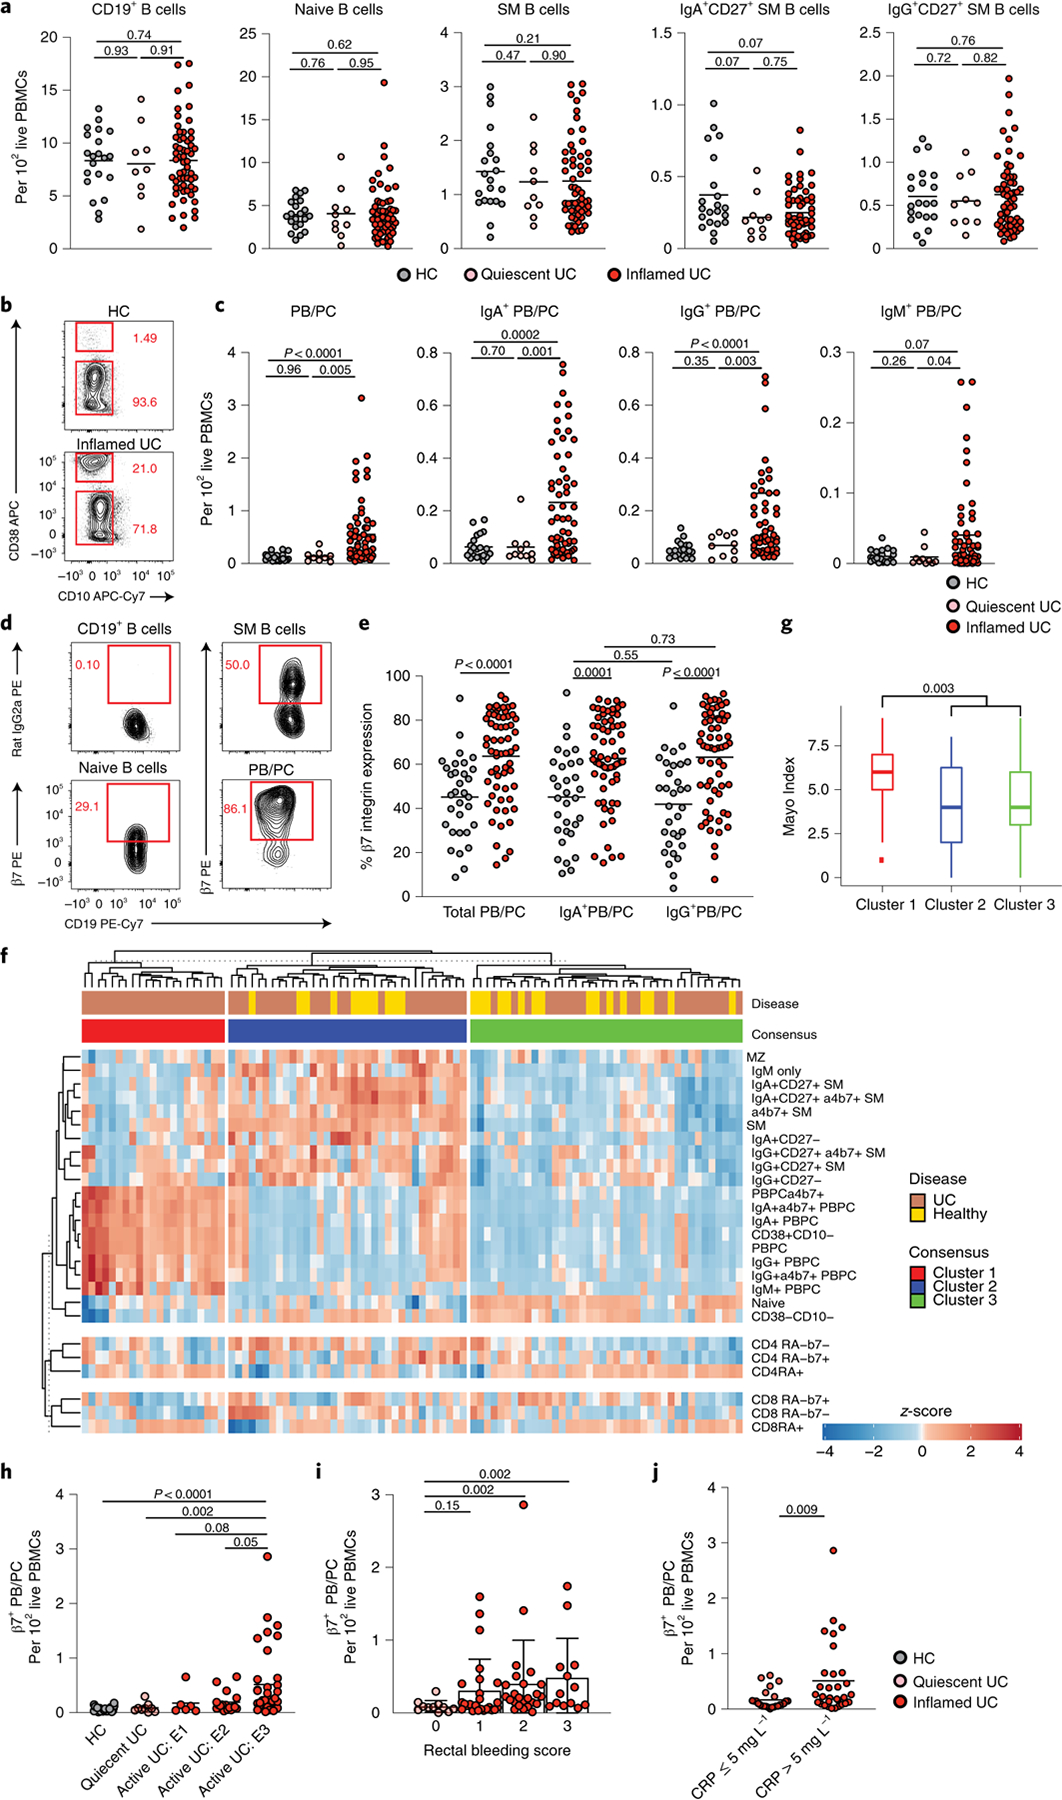
B cells, which are critical for intestinal homeostasis, remain understudied in ulcerative colitis (UC). In this study, we recruited three cohorts of patients with UC (primary cohort, n = 145; validation cohort 1, n = 664; and validation cohort 2, n = 143) to comprehensively define the landscape of B cells during UC-associated intestinal inflammation. Using single-cell RNA sequencing, single-cell IgH gene sequencing and protein-level validation, we mapped the compositional, transcriptional and clonotypic landscape of mucosal and circulating B cells. We found major perturbations within the mucosal B cell compartment, including an expansion of naive B cells and IgG+ plasma cells with curtailed diversity and maturation. Furthermore, we isolated an auto-reactive plasma cell clone targeting integrin αvβ6 from inflamed UC intestines. We also identified a subset of intestinal CXCL13-expressing TFH-like T peripheral helper cells that were associated with the pathogenic B cell response. Finally, across all three cohorts, we confirmed that changes in intestinal humoral immunity are reflected in circulation by the expansion of gut-homing plasmablasts that correlates with disease activity and predicts disease complications. Our data demonstrate a highly dysregulated B cell response in UC and highlight a potential role of B cells in disease pathogenesis.


Figures

Extended Data Fig. 1 |
Extended Data Fig. 1 |. Outline of the patients and samples included in the study.
HC: Healthy controls; aUC: active ulcerative colitis; qUC: quiescent ulcerative colitis; PBMC = peripheral blood mononuclear cells.
Extended Data Fig. 2 |
Extended Data Fig. 2 |. Lineage grouping within 7 major cellular compartments from single-cell RNA sequencing of colonic biopsies.
a, Grouping single-cell RNA sequencing cell clusters by similarity. Heatmap showing Pearson correlation coefficients between the log-averaged expression profiles of clusters. Ordering was determined by hierarchical clustering, which unbiasedly grouped the clusters by cellular lineage (color-coded bar). b, Heatmap showing color-coded down-sampled UMI counts of representative lineage marker genes in 100 randomly selected cells per cluster. The color code on the left indicates the lineage annotation of the different clusters as follows: red=T cells; orange=innate lymphoid cells; blue= plasma cells; yellow= B cells; green= mononuclear phagocytes; purple- mast cells; teal= stromal cells. c, Major cellular compartment subtypes frequencies within total lamina propria cells. The number of cells in each cellular subtype is divided by the total number of lamina propria cells and visualized in a stacked bar for each sample (HC and patients with UC).
Extended Data Fig. 3 |
Extended Data Fig. 3 |. Characterization of the 20 colonic clusters of B cells from single-cell RNA sequencing of colonic biopsies.
a, UMI counts in B lymphocyte and plasma cell clusters. box plots represent the third quartile (top of the box), median (center lines) and first quartile (bottom of the box) of measurements, and the whiskers represent 1.5 times the interquartile range from the top or bottom of the box. b, Heat-map showing color-coded down-sampled UMI counts of highly-variable genes between clusters of B cells (n = 7621 cells) and PC (n = 21425 cells). Clusters are demarcated by gray bars. Cells were down-sampled to 2000 UMIs/cell. Detailed cell counts per B and PB/PC cluster per sample are accessible in Supplementary Table 2. c, Correlation matrix of gene modules defined by gene-to-gene correlation analysis of single cells within the B lymphocyte clusters. d, Heat-map showing color-coded down-sampled UMI counts of gene programs identifying naïve, memory and germinal center-like B lymphocytes. Clusters are demarcated by gray bars. Cells were down-sampled to 2000 UMIs/cell. e,I FN signature scores on the indicated cell types. Supplementary Table 2 shows cell-counts per cluster, box plots represent the third quartile (top of the box), median (center lines) and first quartile (bottom of the box) of measurements, and the whiskers represent 1.5 times the interquartile range from the top or bottom of the box.
Extended Data Fig. 4 |
Extended Data Fig. 4 |. JH, VH family usage and clonal relationships.
a-d, IgH V and J gene family usage in short-lived colonic PC (a,c) and in circulating gut-homing PBs (b,d). Data are shown as individual data, mean and standard deviation; Mann- Whitney test, two tailed. e, Mean IgH amino acid CDR3 length per patient excluding JH6 + clones. Mann-Whitney test, two tailed, no significant difference. Panels a-e are based on 4 HC and 4 active UC patients f, Clonal relationships of all clones analyzed for each HC and UC patient. Numbers within circles stand for total number of clones.
Extended Data Fig. 5 |
Extended Data Fig. 5 |. Serological reactivity against microbiota antigens.
Thirty-two bacterial proteins and extracts (described in detail in Supplementary Table 8) were arrayed in triplicate on 16 pad nitrocellulose slides. After blocking, patient serum was added to the respective pads to determine reactivity against these antigens. a-b, Representation of increased IgG (a) and IgA (b) reactivity against microbial antigens 14–2 F, M18–1, COE1 and EcLW in patients with UC. c, IgG and IgA serological reactivity against 32 microbial antigens. Data are shown as individual data, mean and standard deviation, t-test, two-tailed. Details of the data from panel c are also provided in Supplementary Table 7.
Extended Data Fig. 6 |
Extended Data Fig. 6 |. Generation of a molecular signature of an IgG-activated or LPS colonic macrophage activation response.
a, Generation of a molecular signature of IgG-activated macrophages using transcriptomic analysis of murine colonic macrophages stimulated ex vivo with IgG immune complexes. The signature was restricted to human- and disease-relevant genes using a second dataset of IgG IC-stimulated human monocytes (GSE102728) and elastic-net regularized logistic regression on a training mucosal UC dataset (GSE38713), respectively. A second microbial gene signature using transcriptomic analysis of colonic macrophages from DSS-treated mice and refined on LPS-treated human monocytes was also generated. b, List of constituent genes for the immune complexes signature and the LPS signature. The right panel shows the number of exclusive and shared genes between the 2 signatures.
Extended Data Fig. 7 |
Extended Data Fig. 7 |. Proportion of “resident-like” and inflammatory macrophages and their respective molecular signature.
a, Proportion of “resident-like” macrophages and inflammatory macrophages among total colonic macrophages represented in individual samples of healthy controls UC and patients. b, Heat-map showing color-coded down-sampled UMI counts of gene programs identifying LPS signature (red), immune complexes (IC) signature (green) and resident macrophage genes signatures (black).
Extended Data Fig. 8 |
Extended Data Fig. 8 |. Characterization of T cell clusters from single-cell RNA sequencing of colonic biopsies.
a, Heat-map showing the relative expression of 5 transcriptional scores (rows) (see Methods) in single T cells (n = 11281 cells) (columns). Cell clusters are demarcated by gray bars. Detailed cell counts per T cluster per sample are accessible in Supplementary Table 2. b, Euclidean distance for lineage normalized cell type frequencies was compared within healthy controls (HC), (HC-HC, blue), patients with UC (UC-UC, red) and between HC and patients with UC (HC-UC, grey) for T cells, Wilcoxon rank-sum test. c, Relative expression of genes identifying T cell subsets. Heatmap is showing log-2 transformed expression per subset divided by the mean expression across all subsets.
Extended Data Fig. 9 |
Extended Data Fig. 9 |. Representative histological examination of a surgical specimen from a UC patient before immunofluorescent staining.
Macroscopic view of colon after resection. Black arrow delineates disease margin, which runs strikingly anti-parallel to the length of the colon. b, H&E section showing disease margin (yellow) line with proximal region on the left and margin progressing toward disease distally on the right. Note the increased number of small follicles on the diseased side. c, Normal isolated lymphoid follicle in the colon. d, Proximal colon from UC patient with delimited disease in the region that appears macroscopically healthy, with abnormal fibrotic accumulation beneath the epithelial lining. e, Macroscopically normal proximal specimen from a UC patient that contains diffuse inflammatory infiltrate despite a healthy macroscopic appearance. For panels b-e, white bars = 200 μm.
Fig. 1 |
Fig. 1 |. PBs, IgG-secreting PCs and IFN-imprinted naive B cells are expanded in the inflamed colons of patients with UC.
a, Heat map showing relative expression values of genes (rows) enriched in B lymphocyte clusters (columns; total B lymphocytes = 7,621 cells). b, Heat map showing color-coded downsampled UMI counts of immunoglobulin genes in PB (clusters 1 and 4; total PBs = 2,705 cells) and PC clusters (total PCs = 18,720 cells). c, Total UMI counts of the cycling transcriptional programs were calculated for each cell and divided by the total number of UMIs per cell. Bonferonni-adjusted one-sided t-test. t.statistic (cluster 4) = 76.08, t.statistic (cluster 20) = 5.62 and t.statistic (cluster 1) = 31.02. d, e, IgG versus IgA UMI scores per PB single cells in HCs (bottom) and UC samples (top) within cluster 1 (d) and cluster 4 (e). Cells were classified as IgG, IgA or unknown based on a normal mixture model with expected significance at 0.05% per cell, Kruskal–Wallis test. f, Euclidean distance for lineage-normalized cell type frequencies was compared within the indicated groups for PBs/PCs (left) and B lymphocytes (right), Wilcoxon rank-sum test. g, Subtype frequencies of PBs/PCs and non-naive and naive B cells within total respective cell types. h, Dot plots comparing the ratios of naive B cell subsets; memory B cell subsets; PBs and PCs; and PC subsets between HC and UC; two-sided Mann–Whitney U-test. i IFN signature scores between IgG PBs from cluster 4 and IgA PBs from cluster 4 (Kruskal–Wallis chi-squared = 108.63, df = 1, P < 2.2 × 10⁻¹⁶) and between IgG PBs from cluster 4 and IgA PBs from cluster 1 (Kruskal–Wallis chi-squared = 377.15, df = 1, P < 2.2 × 10⁻¹⁶). j, IFN signature scores between naive B cells-2 (cluster 8) and naive B cells-1 (cluster 12) (Kruskal–Wallis chi-squared = 114.25, df = 1, P < 2.2 × 10⁻¹⁶). c, i, j, Supplementary Table 2 shows cell counts per cluster; box plots represent the third quartile (top of the box), median (center lines) and first quartile (bottom of the box) of measurements; and the whiskers represent 1.5 times the interquartile range from the top or bottom of the box.
Fig. 2 |
Fig. 2 |. Major disruptions of B cell populations in inflamed colon of patients with UC.
a, Representative flow plots showing the frequency of IgA and IgM expressed on CD27+CD38++ PCs in biopsies of an HC and a patient with UC with inflammation. b, Frequency of IgG (IgAIgM) PC, IgA PC and IgG:IgA ratio on colonic PC in HCs (n = 21) and in inflamed (n = 24) and non-inflamed (n = 18) biopsies from patients with UC. Data are shown as individual data and mean, Mann–Whitney test, two-tailed. c, Representative images of colonic biopsies from an HC (left) and a patient with UC with inflammation (right) after immunofluorescence staining with CD79a (green), Ki67 (blue) and IgA (red) (×20 magnification); scale bar, 150 μm. d, Quantification of lamina propria IgA+ (IgA, CD79a and Ki67 triple-positive cells) and IgA PB (CD79a and Ki67 double-positive cells) in five HCs and five patients with UC with inflammation. Data are shown as individual data and mean, Mann–Whitney test, two-tailed. e, Representative flow plots showing the frequency of short-lived (CD27+CD38++CD19+CD45+), long-lived (CD27+CD38++CD19CD45+) and ultra-long-lived (CD27+CD38++CD19CD45) PCs in colonic biopsies of an HC and a patient with UC with inflammation. f, Frequency of each subset among total PCs and ratio of CD19+CD45+ to CD19CD45+ PCs in HCs (n = 21) and in inflamed (n = 24) and non-inflamed (n = 18) biopsies from patients with UC. Data are shown as individual data and mean, Mann–Whitney test, two-tailed. g, Frequency of CD19+ B cells and naive (CD45+CD19+CD38CD10IgD+IgM+) and SM (CD45+CD19+CD38CD10IgDIgM) B cells out of live CD45+ lamina propria mononuclear cells in HCs (n = 21) and in inflamed (n = 24) and non-inflamed (n = 18) biopsies from patients with UC. Data are shown as individual data and mean, Mann–Whitney test, two-tailed. h, Representative flow plots showing the frequency of IgA+ and IgG (IgA) SM B cells gated on live SM B cells in biopsies of an HC and a patient with UC with inflammation. i, Frequency of IgG, IgA SM B cells and IgG:IgA ratio in SM B cells in HCs (n = 21) and in inflamed (n = 24) and non-inflamed (n = 18) biopsies from patients with UC. Data are shown as individual data and mean, Mann–Whitney test, two-tailed. P values are as indicated in the figure.
Fig. 3 |
Fig. 3 |. Colonic PCs have reduced diversity, longer CDR3 regions and fewer somatic mutations in patients with UC.
a, b, Isotype frequencies in short-lived colonic PCs (CD27+CD38++CD19+CD45+) (a) and circulating gut-homing PBs (β7-integrin+CD19+/−CD38++CD27+IgD-) (b), Mann–Whitney test, two-tailed. c, Proportion of each IgG subclass in HCs and patients with UC; chi-squared test. d, e, Mean IgH amino acid CDR3 length per patient (d) for each IgA and IgG clone (e) of gut-homing PBs and short-lived colonic PCs; Mann–Whitney test, two-tailed. f, g, Mean (f) V gene somatic mutations for each IgA and IgG clone (g) of gut-homing PBs and short-lived colonic PCs, Mann–Whitney test, two-tailed. h, Shannon diversity index of gut-homing PBs and short-lived colonic PCs. Mann–Whitney test, two-tailed. ah are based on four HCs and four patients with active UC. i, Serum anti-αvβ6 integrin antibodies of 45 HCs and 73 patients with UC. The cutoff absorbance value for positivity (A450, mean + 3 s.d. of the control sera), indicated by a dashed line. Mann–Whitney U-test. j, Reactivity of clones from HCs (n = 4 clones) and patients with UC (n = 9 clones) against integrin αvβ6. Dashed line is the cutoff for positivity (defined in i). k, Heat map depicting the standardized expression profiles of genes in the macrophage Fc IC signature on inflamed and non-inflamed tissue for different intestinal regions (n = 421 patients with UC). l, n, GSVA-derived scores for macrophage Fc IC and LPS (n) gene signatures in inflamed and non-inflamed biopsies (n = 421 patients with UC and 243 non-IBD controls). Mann–Whitney test, two-tailed. Effect size is shown in Supplementary Table 12. m, o, Macrophage Fc IC (m) and LPS (o) gene scores of responders (R) and non-responders (NR) in TNF inhibitor (infliximab)-treated patients with IBD before treatment initiation, Mann–Whitney test, two-tailed. Effect sizes are shown in Supplementary Table 13. For lo, box plots represent the third quartile (top of the box), median (center lines) and first quartile (bottom of the box) of measurements, and the whiskers represent 1.5 times the interquartile range. In a, b, d, e, f, g, h, l, m, n and o, data are shown as individual data and mean, and P values are as indicated.
Fig. 4 |
Fig. 4 |. CXCL13+ TPH cells are expanded in the inflamed mucosa of patients with UC.
a, scRNA-seq-derived T cell frequencies within total T cells (n = 11,281 cells; chi-squared = 3,727.0; P < 0.01). Respective cluster numbers are indicated. b, c, Heat maps showing log (2-based) relative expression values of genes (rows) enriched in all T lymphocyte clusters (b) or in TPH cells and Tregs (c) (columns). d, TPH cell frequencies within total T cells in individual sample (Wilcoxon test, two-tailed). e, Representative flow plots showing PD-1hiTIGIT+ cells among live CD45+CD3+CD4+CD45RA cells. f, Frequency of PD-1hiTIGIT+ICOS+ cells (n = 5 HC, n = 4 non-inflamed and n = 5 inflamed), PD-1hi cells and PD-1int cells among memory (CD45RA) CD4 T cells (n = 9 HC, n = 17 non-inflamed and n = 22 inflamed), Mann–Whitney test, two-tailed. g, h, Linear regression (using Pearson test) showing the relationship between the frequencies of PD-1hi CD4+CD45RA cells and short-lived PCs (g) and PD-1hi CD4+CD45RA cells and naive B cells (h) in colonic biopsies of patients with UC (n = 39). Data are shown as individual data. i, Representative flow plots showing CD4+CXCL13+ T cells. j, Frequency of CXCL13 expression within lamina propria CD4 T cells with or without CD3/CD28 stimulation, Mann–Whitney test, two-tailed, n = 6 HC and n = 5 inflamed colon. k, Representative flow plots showing PD1 and TIGIT expressions of CXCL13+ (red) and CXCL13 (gray) CD4 T cells. l, Overall TPH activity scores in 421 patients with UC and in 243 non-IBD controls where canonical TFH genes were examined within whole-biopsy RNA sequence data from VCo1. Box plots represent the third quartile (top of the box), median (center lines) and first quartile (bottom of the box) of measurements, and the whiskers represent 1.5 times the interquartile range. Effect sizes are shown in Supplementary Table 14. m, Representative images from an HC and the sample of a patient with inflamed UC with CD3 (green), CD20 (blue) CXCL13 (red) and DAPI (gray) staining. n, Quantification of CD3+CXCL13+ in nine HCs and 11 patients with UC with active inflammation (at the edge of inflammation and in an upstream uninflamed area), Mann–Whitney test, two-tailed. For f, j and n, data are shown as individual data and mean. P values are as indicated throughout the figure.
Fig. 5 |
Fig. 5 |. Circulating β7-integrin-expressing PBs are expanded in patients with active UC and relate to disease activity.
a, Frequency of total B cells (CD19+), naive B cells (CD19+CD38CD10IgM+IgD+), CD27+ SM B cells (CD19+CD38CD10IgMIgD) and IgA+ and IgG (IgA) SM B cells in HCs (n = 21), in patients with quiescent UC (n = 10) and in patients with active UC of the primary cohort (n = 58), Mann–Whitney test, two-tailed, b, Representative flow plots showing the frequency of CD38++CD10 cells and CD38CD10 cells among live CD19+ PBMCs in HCs and in a patient with active UC. c, Frequency of PBs/PCs (CD19+CD38++CD10CD27+IgD) and IgA+ PBs/PCs, IgG+ PBs/PCs (IgAIgM) and IgM+ PBs/PCs out of live PBMCs in HCs (n = 21), in patients with quiescent UC (n = 10) and in patients with active UC of the primary cohort (n = 58), Mann–Whitney test, two-tailed. d, Representative flow plots of the expression of β7-integrin on SM B cells, naive B cells and PBs/PCs. e, Level of expression of β7-integrin on total, IgA+ and IgG+ PBs/PCs in HCs (n = 32) (gray) and in patients with active UC (n = 62) (red) from the primary cohort, Mann–Whitney test, two-tailed. f, Consensus clustering on primary cohort patients defined three clusters of patients and controls according to immune-phenotyping of PBMCs. g, Comparison of clinical Mayo Scores across the three consensus clusters. Box plots represent the third quartile (top of the box), median (center lines) and first quartile (bottom of the box) of measurements, and the whiskers represent 1.5 times the interquartile range, Mann–Whitney test, two-tailed. h, Frequency of β7+ gut-homing PBs/PCs (CD19+CD38++CD10CD27+IgD) according to their disease extent defined by the Montreal classification, Mann–Whitney test, two-tailed, n = 21 HCs, n = 9 quiescent, n = 6 active E1, n = 17 E2 and n = 35 E3. i, Frequency of β7+ gut-homing PBs/PCs according to the rectal bleeding score, Mann–Whitney test, two-tailed, n = 11, 25, 24 and 13 for rectal bleeding scores of 0, 1, 2 and 3, respectively. j, Frequency of β7+ gut-homing PBs/PCs in patients with UC with a CRP level of less than 5 mg L−1 (n = 25) or more than 5 mg L−1 (n = 31), Mann–Whitney test, two-tailed. For a, c, e, h, i and j, data are shown as individual data and mean; for h and i, data are shown as mean ± s.d. P values are as indicated throughout the figure.
Fig. 6 |
Fig. 6 |. An increase in gut-homing PBs/PCs is associated with disease complications and activity in two validation cohorts of patients with active UC.
ad, Mass cytometry (CyTOF)-derived data from VCo1 comparing PC parameters among HCs (n = 65), patients with quiescent UC (n = 52) and patients with inflamed UC (n = 31). a, Representative tSNE plots (top) demonstrating cellular subsets in the peripheral blood of one HC, one patient with quiescent UC and one patient with inflamed UC. The bottom panels compare the expression of β7-integrin on CD27+CD38hi PBs/PCs. b, Cumulative data from VCo1 comparing the frequency of PBs/PCs among HCs and patients with quiescent UC and patients with inflamed UC; Mann–Whitney test, two-tailed. c, Mean level of expression of β7-integrin (left), β1-integrin (middle) and CXCR3 (right) on circulating PBs/PCs of HCs and patients with quiescent UC and patients with inflamed UC. Data are shown as individual data, mean and standard deviation; Mann–Whitney test, two-tailed. d, Kaplan–Meier estimates showing survival free of occurrence of complications (that is, intestinal surgery, UC-related hospitalization or introduction of a new biologic treatment) for patients of VCo1 with PB/PC frequency below the median (red curve) or above the median (blue curve). Survival curves were compared using a log-rank test, n = 73 patients with UC. eg, IgJ gene signatures, representing circulating PBs/PCs in VCo2 comprised of 36 HCs and 107 patients with UC. e, Relative expression of IgJ gene from whole blood of HCs, patients with quiescent UC and patients with inflamed UC. f, g, Relative expression of IgJ compared with rectal bleeding scores (f) and fecal lactoferrin (g). In b, e and f, box plots represent the third quartile (top of the box), median (center lines) and first quartile (bottom of the box) of measurements, and the whiskers represent 1.5 times the interquartile range from the top or bottom of the box. Data are shown as individual data. Comparisons between indicated groups were made with two-tailed t-test. Correlation coefficient (rho) in g was calculated using Spearman’s test. P values are as indicated throughout the figure. tSNE, t-distributed stochastic neighbor embedding.

References

    1. Ungaro R, Mehandru S, Allen PB, Peyrin-Biroulet L & Colombel J-F Ulcerative colitis. Lancet 389, 1756–1770 (2016). - PMC - PubMed
    1. Macpherson AJ & Uhr T Induction of protective IgA by intestinal dendritic cells carrying commensal bacteria. Science 303, 1662–1665 (2004). - PubMed
    1. Peterson DA, McNulty NP, Guruge JL & Gordon JI IgA response to symbiotic bacteria as a mediator of gut homeostasis. Cell Host Microbe 2, 328–339 (2007). - PubMed
    1. Bollinger RR et al. Secretory IgA and mucin-mediated biofilm formation by environmental strains of Escherichia coli: role of type 1 pili. Mol. Immunol 43, 378–387 (2006). - PubMed
    1. Geissmann F et al. A subset of human dendritic cells expresses IgA Fc receptor (CD89), which mediates internalization and activation upon cross-linking by IgA complexes. J. Immunol 166, 346–352 (2001). - PubMed

Publication types