. 2022 Mar;54(3):283-294.
doi: 10.1038/s41588-021-01009-4. Epub 2022 Feb 21.

Sequence determinants of human gene regulatory elements

Affiliations

Sequence determinants of human gene regulatory elements

Biswajyoti Sahu et al. Nat Genet. 2022 Mar.

Abstract

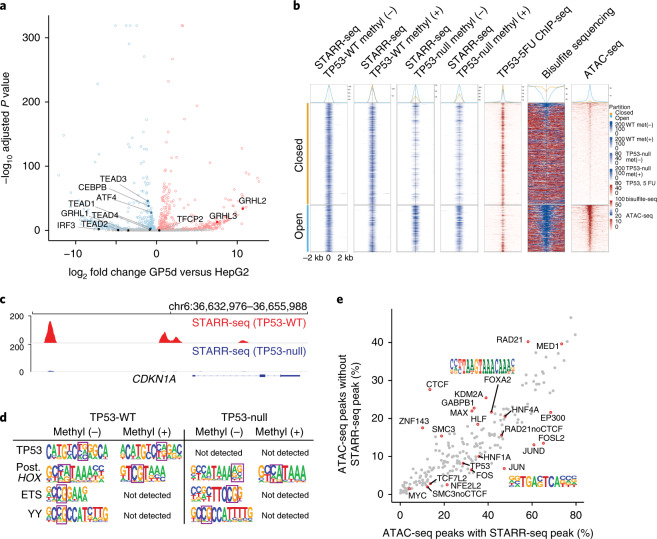
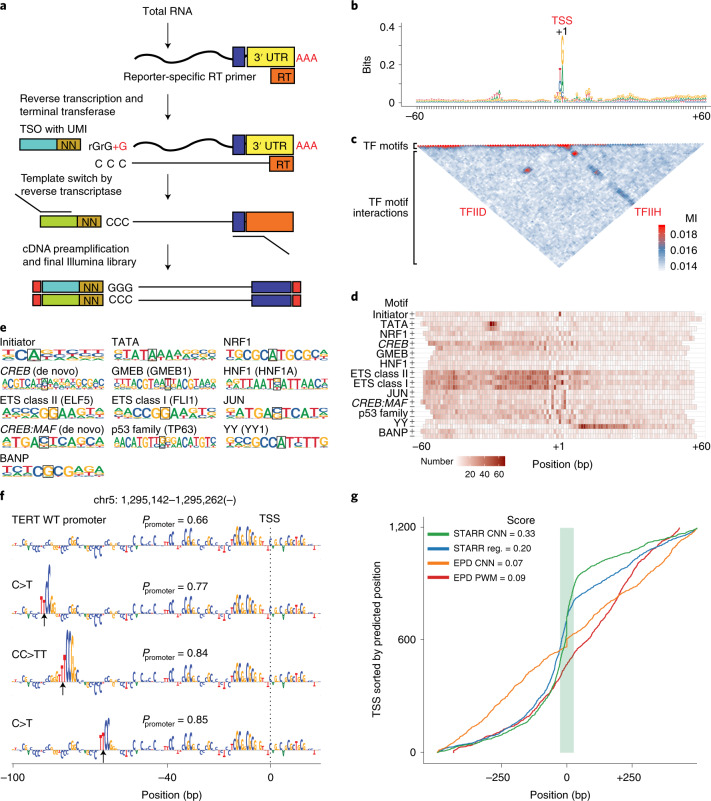
DNA can determine where and when genes are expressed, but the full set of sequence determinants that control gene expression is unknown. Here, we measured the transcriptional activity of DNA sequences that represent an ~100 times larger sequence space than the human genome using massively parallel reporter assays (MPRAs). Machine learning models revealed that transcription factors (TFs) generally act in an additive manner with weak grammar and that most enhancers increase expression from a promoter by a mechanism that does not appear to involve specific TF-TF interactions. The enhancers themselves can be classified into three types: classical, closed chromatin and chromatin dependent. We also show that few TFs are strongly active in a cell, with most activities being similar between cell types. Individual TFs can have multiple gene regulatory activities, including chromatin opening and enhancing, promoting and determining transcription start site (TSS) activity, consistent with the view that the TF binding motif is the key atomic unit of gene expression.


Conflict of interest statement

The authors declare no competing interests.

Figures

Fig. 1
Fig. 1. Few TFs display strong transcriptional activity in cells.
a, Schematic representation of the MPRA (STARR-seq) libraries. For enhancer activity assays, a DNA library comprising synthetic TF motifs (i), human genomic fragments (ii) or completely random synthetic DNA oligonucleotides (iii) is cloned within the 3′ UTR of the reporter gene (open reading frame (ORF)) driven by a minimal δ1-crystallin gene (Sasaki) or EF1α promoter. For binary promoter–enhancer (iv) activity assays, random synthetic DNA sequences are cloned in place of the minimal promoter and in the 3′ UTR (Methods, Supplementary Note and Supplementary Tables 3 and 4). b, MPRA (STARR-seq) reporter construct and its variations, and the experimental workflow for measuring promoter or enhancer activity. The MPRA libraries are transfected into human cells, and RNA is isolated 24 h later, followed by enrichment of reporter-specific RNA, library preparation, sequencing and data analysis. The active promoters are recovered by mapping their transcribed enhancers to the input DNA and identifying the corresponding promoter. c, Enhancer activity of HT-SELEX motifs measured from the synthetic TF motif library in GP5d cells. Median fold change of the sequence patterns containing a single instance of the motif consensus or its reverse complement over the input library is shown. Red line marks 1% activity related to the strongest motif. Dimeric motifs are indicated by orientation with respect to core consensus sequence (GGAA for ETS, ACAA for SOX, AACCGG for GRHL and GAAA for IRF; HH, head to head; HT, head to tail; TT, tail to tail), followed by gap length between the core sequences. Asterisk indicates an A-rich sequence 5′ of the IRF HT2 dimer. Supplementary Table 5 describes the naming of the motifs in each figure. d, The effect of a mismatch on enhancer activity of the p53 family (p63) motif when a consensus base is substituted by any other base one position at a time. The log2 fold change compared to input is plotted for the same motif pattern in two different sequence contexts. The PWMs for HT-SELEX and STARR-seq motifs are shown; note that mutating G to any other base (H) at position 5 (H05) leads to almost complete loss of activity.
Fig. 2
Fig. 2. De novo enhancers display weak TF spacing and orientation preferences.
a, Comparison of motif activities in biochemical binding (ATI assay; y axis) and STARR-seq (x axis) in GP5d cells (Pearson R = 0.032; see Fig. 1c for motif naming). b, Effect of number of motifs on enhancer activity from synthetic motif library in GP5d cells. For each motif, fold change (log2) compared to input is shown for one versus two sites. The black dashed line and the red dotted line represent the expected fold changes if two sites have the same effect as one and if two sites act in an additive manner, respectively. c, Spacing preferences for motif pairs analyzed from random enhancer experiment in GP5d cells. Heatmaps show counts of the motif pairs with the specific orientation (row) and spacing (x axis). The sequence logos show the most enriched spacing and orientation for each pair according to P value; the adjusted P value is calculated by comparing it to all others (one-sided Fisher’s exact test) and correcting for the total number of orientations and spacings tested for the pair (Methods and Supplementary Table 5). Blue and red arrows mark the first and second motifs of the pair and their orientations, respectively (unless they are the same). The distance between the information content centers of the motifs is marked. d, Regression coefficients for different TFs and TF pairs from logistic regression analysis of enhancer activities from random enhancer library in GP5d cells (Methods); features with the strongest predictive power are labeled. e, Nonlinear effect of multiple motifs in CNN trained on GP5d random enhancer STARR-seq data. A pair of the same motifs (indicated by labels) increases the predicted enhancer probability of the sequence above that expected from a single motif (dashed black line), but not above that expected from a model assuming independent binding to the two motifs (red dotted line). f, Comparison of enhancer activity of motifs measured from random enhancer library in GP5d and HepG2 cells (log2 fold change of motif match count over input in each cell line, Pearson R = 0.78; dashed line indicates identical activity between the cell lines).
Fig. 3
Fig. 3. Cell type–specific gene expression and the effect of methylation on enhancer activity.
a, Differential expression of genes encoding TFs (from Lambert et al.) between GP5d and HepG2 cells. Red and blue dots represent the genes with higher expression in GP5d and HepG2 cells, respectively (multiple-testing adjusted P value < 0.01, Wald test; Methods). TFs with different motif activities between the cell lines are marked, including TEADs, GRHLs (and TFCP2, as it has motif similar to GRHLs), IRF3, ATF4 and CEBPB. b, Effect of CpG methylation on enhancer activity in TP53-null and wild-type (WT) GP5d cells. The regions around the summits of the top 1,000 genomic STARR-seq peaks in the unmethylated wild-type sample were classified as open (blue) or closed (orange) chromatin based on overlap with ATAC-seq peaks. For STARR-seq and ATAC-seq, average unique fragment coverage and read coverages are shown, respectively. For ChIP-seq and bisulfite sequencing, the average read coverage normalized to IgG and smoothed CpG methylation level for each window is shown, respectively. Top panel shows the average signal for each window in open (blue) and closed (orange) chromatin regions. 5FU, 5-fluorouracil (treatment to induce p53 binding to the genome); met, methyl. c, Genome browser snapshot showing the active enhancer peaks measured from the genomic STARR-seq library in GP5d cells. Loss of TP53 results in the loss of STARR-seq peaks near the known p53 target gene p21 (CDKN1A). d, De novo motif mining analysis for STARR-seq peaks from CG-methylated and unmethylated genomic DNA library in TP53-null and wild-type GP5d cells; CG is marked with a square box. Note that p53 motif is lost in TP53-null cells, motifs for many methylation-sensitive TFs (ETS and YY; see also Yin et al.) are not detected after library methylation, and conversely, the posterior (Post.) homeodomain motif (italic) displays stronger CG dinucleotide after methylation. e, Comparison of ChIP-seq peaks within ATAC-seq peaks with (x axis) and without (y axis) STARR-seq peaks in HepG2 cells (Methods). The percentage of respective ATAC-seq peaks overlapping with at least one ChIP-seq peak is shown. For the cohesin subunits RAD21 and SMC3, the ATAC-seq peaks not overlapping a CTCF peak are marked separately (RAD21noCTCF and SMC3noCTCF).
Fig. 4
Fig. 4. Genomic analysis reveals three types of transcriptionally active enhancers.
a, Six types of regulatory elements classified on the basis of STARR-seq signal and chromatin features such as accessibility (ATAC-seq), TF binding and epigenetic modifications. Euler diagrams (bottom) show the overlap between genomic STARR-seq peaks and different genomic features (left) and between ATAC-seq peaks and different genomic features (middle) in HepG2 cells. Note that some of the small intersections are not shown (a full list of interactions is shown in Extended Data Fig. 6a). Genome browser snapshots showing examples of different types of regulatory features in HepG2 and GP5d cells are also shown. Colored boxes marked with roman numerals correspond to the different types of elements listed in panel c; clockwise from top: closed-chromatin enhancer (I) devoid of H3K27ac or ATAC-seq signal at TP53-target gene RRM2B (both the plus- and minus-strand STARR-seq signal is shown), cryptic enhancer (II) overlapping with repressive histone marks, promoters (III) and chromatin-dependent enhancers (IV) and structural CTCF element (V) at the fibrinogen locus (the ENCODE ChIP-seq track shows the number of overlapping TF peaks, with 206 TFs in total) and tissue-specific classical enhancers (VI) detected for ELF5 (higher expression in HepG2, blue) and EHF (higher expression in GP5d, red). Note that the STARR-seq peaks are specific to the cell types where the adjacent gene is expressed. For ATAC-seq data, traces from the BAM coverage files are shown. DEG, differentially expressed gene. b, Chromatin-dependent enhancers and classical enhancers combine to form superenhancers. Genome browser snapshot of a MYC superenhancer in HepG2 cells marked by a STARR-seq peak overlapping with the binding site for TF with strong transactivation activity (NFE2L2) converging on equidistant chromatin enhancers bound by cohesin, Mediator, forkhead and other liver-specific TFs. c, Summary of the features that define the six genomic element types.
Fig. 5
Fig. 5. Comparison of sequence features of de novo enriched human promoters and enhancers.
a, Plot showing the enrichment of TF motif matches in promoters selected from completely random sequences across three mammalian cell lines: GP5d colon cancer, HepG2 liver cancer and RPE1 retinal pigmented epithelial cells (dashed line marks identical activity; Pearson correlation values for log2 motif-match fold changes compared to input for GP5d versus HepG2 = 0.95, HepG2 versus RPE1 = 0.92 and GP5d versus RPE1 = 0.91). Dimeric motifs are indicated by orientation with respect to core consensus sequence as described in legend to Fig. 1c. b, Comparison between enrichment of motif matches at enhancers (x axis) versus promoters (y axis) in GP5d cells (active sequences selected from synthetic random promoter and enhancer sequences). The motifs marked with italic typeface are de novo motifs mined from the GP5d TSS-aligned sequences. c, Motifs that enrich specifically in the promoter position, as measured by a difference in log2 fold change. The motifs that are enriched the most are indicated by red circles and labeled. Motifs with negative difference in log2 fold change (below dotted line) are repressive and decrease promoter activity; no motif specifically enriches at enhancers (b).
Fig. 6
Fig. 6. Analysis of positional specificity of sequence elements defining human promoters.
a, Template-switch strategy for capturing the 5′ sequence of the transcripts to determine the TSS location within the promoters enriched from random sequences (reporter-specific primer (orange), template-switch oligo (TSO) containing a unique molecular identifier (UMI) (brown), sequencing adapters (turquoise/green, blue) and Illumina linkers (red)). The template-switch data are used in bd (Supplementary Note and Supplementary Table 7). b, Sequence logo constructed from 17,235 active GP5d promoter sequences from the binary STARR-seq experiment aligned based on the measured position of their TSS (+1). c, Mutual information (MI) plot from the same set of active promoters used in b. Most mutual information is observed close to the diagonal (indicating the presence of TF motifs), but two longer-range interactions are observed between the TATA box and TSS and between the TSS and a G-rich element 3ʹ of it. d, Heatmap showing positional preferences for classical TSS-associated motifs (initiator, TATA; Methods), the most highly enriched motifs at promoters compared to enhancers (Fig. 5b) and generally highly enriched motifs (p53 family, YY and CREB:MAF). Heatmap color indicates the number of motif matches in one strand (the background probability of a match 5 × 10−4); italic typeface marks de novo motifs mined from the GP5d TSS-aligned sequences (also in panel e). e, Sequence logos of the motifs shown in the heatmap of panel d. The information content center column used to position the matches in the heatmap is highlighted. f, Predicted sequence determinants at the TERT promoter from DeepLIFT analysis (Methods) of the CNN (top) and the effect of three cancer-associated driver mutations (arrows) on its predicted promoter probability (Ppromoter). g, Cumulative distance between predicted and annotated TSS positions shown against a test set of GP5d genomic TSSs (~1,200 sequences) for CNN trained on human genomic TSS data (orange) and promoters enriched from random sequences (green), a PWM-based model (red) and a regression (reg.) model using positional match data (blue). Genomic TSS positions are aligned at 0; the score indicates the fraction of predicted TSS positions within ±25 bp from the annotated TSS (green area).
Fig. 7
Fig. 7. Enhancer–promoter interactions are additive and nonspecific in nature.
a, Activity of promoter–enhancer pairs detected from the binary STARR-seq experiment; the observed log2 fold change of each pair compared to input DNA (y axis) against the expected change (x axis), assuming that the promoter and enhancer motifs act independently of each other (with a background probability of a motif match as 5 × 10−5; Methods). Significant interactions (multiple hypothesis-corrected P value <0.05; two-sided binomial test; Methods) are marked red, and all pairs having significant positive interaction are named (promoter motif + enhancer motif). Red dashed line shows the observed number exactly matching the expected one. b, Magnified upper right-hand corner of panel a. The pairs with the lowest P values are marked. c, AUprc for four CNN classifiers with identical architectures trained on different datasets from the GP5d binary STARR-seq experiment using 24 different hyperparameter combinations (x axis; Methods and Supplementary Note) to classify between active and inactive promoter–enhancer pairs. The training datasets used were the ‘paired’ set retaining the promoter–enhancer pairing, the ‘permutated’ set with the pairs shuffled and ‘enhancer from input’ and ‘promoter from input’ with the promoters and enhancers, respectively, paired with a randomly sampled inactive sequence from the input library. The classifiers trained on paired data (blue) outperform classifiers trained on enhancer (violet) or promoter (red) data, but not those trained with permutated data (green, paired Student’s t test two-sided P value = 0.134) (Pi = promoter from ith pair, Ei = enhancer from ith pair, Ek = enhancer from kth pair, Ik = input sequence from kth pair). d, TFs control transcription by directly or indirectly affecting chromatin structure (left), displacing nucleosomes and opening local chromatin (middle) and recruiting and positioning RNA polymerase II (Pol II) (right). Gene regulatory unit with classical (orange) and chromatin-dependent (dark blue) enhancers interacting with Mediator (light blue) and a promoter (brown) is shown. TFs with chromatin-dependent enhancer (FOXA and SOX), classical enhancing (YY1 and ETS), promoting (ETS, CREB and NRF1) and TSS-determining (TATA and YY1) activities are also indicated. The relative nonspecificity of interactions among TFs, classical enhancers and promoters suggests an important role of nonspecific interactions such as steric hindrance (size exclusion and nucleosome-mediated cooperativity) in transcriptional regulation. The model is also consistent with other low-selectivity processes such as phase separation and recruitment in transcription.
Extended Data Fig. 1
Extended Data Fig. 1. Enhancer activity from TF motifs using STARR-seq in GP5d cells.
a, Enhancer activities of the HT-SELEX motifs in two different sequence contexts (color). For each motif, the log2 fold change of the consensus sequence and its reverse complement (if different) compared to input is shown in both contexts (Pearson R = 0.90; see Methods). Details of motif naming are described in legend to Fig. 1c. b, Enhancer activities of HT-SELEX motifs with two different CpG-free promoters, δ1-crystallin gene (Sasaki) or EF1α promoter (red and blue dots, respectively; median log2 fold change of the consensus sequence and its reverse complement in both contexts compared to input are shown for both promoters; Pearson R = 0.89). c, Expression of TF families that bind to the motifs with strong enhancer activity (see Fig. 1c) in GP5d cells. The DNA-binding domain (DBD) assignments for TFs from ref. were used to assign the motifs to a set of DBDs. The blue diamond symbols show the total expression of the TF family (sum of tpm values from RNA-seq data; tpm = transcripts per million). Names for the DBD class and for the motif (in brackets) are shown. d, The motifs generated based on enhancer activities measured from motif STARR-seq experiments for sequences in which each of the consensus bases in a motif was substituted by N (top) compared to the corresponding SELEX motif (bottom). Eleven pairs are shown for which the activity PWM had information content ≥2 bits and for which the original SELEX motif was the best match with similarity P value <0.05 (motif similarity test of the TOMTOM program) when compared to all SELEX motifs used in the study. e, The effect of the number of binding sites on enhancer activity. For each motif, the fold change (log2) compared to the input (y axis) was estimated by taking the median fold change of all the sequences containing the given number of the motif consensus binding sites (x axis). The average fold changes for different numbers of binding sites (red lines) were calculated from the motifs that were detected with all copy numbers (n = 459).
Extended Data Fig. 2
Extended Data Fig. 2. Features of enhancer activity measured from synthetic random DNA sequences in GP5d cells.
a, Correlation of replicate experiments in GP5d cells. Motif-match log2 fold change values compared between two replicates from random enhancer experiment (left) and from promoters in binary STARR-seq experiment (right). See legend for Fig. 1c for details of motif naming. b, Motif matches enriched in the oligonucleotides showing the enhancer activity measured from random synthetic DNA (see Methods). c, Comparison of the effect of number of binding sites on enhancer activity from enhancer assay using random synthetic DNA. For each motif, the fold-change compared to the input is shown for one versus two sites. The matching was done separately for each strand so that the background probability of a match was 1 × 10−5. The black dashed line and the red dotted line represent the expected fold changes if two sites have the same effect as one and if two sites act independently of each other, respectively. d, De novo motif analysis for over-representation of TF motifs within DNA fragments enriched for enhancer activity in GP5d cells from genomic STARR-seq library, from synthetic random DNA library, and from the active transcription factor identification (ATI) assay. The motifs identified by HT-SELEX are shown for comparison. Only the motifs similar to those detected from genomic STARR-seq are highlighted here. Note the ETS-bZIP composite motif enriched in the random STARR-seq data. e-f, Mean of mutual information between 3-mer distributions as a function of distance separating the 3-mers in random enhancers (e) and binary STARR-seq enhancers (f). Pairwise dependency between 3-mer distributions varies with a period of approximately 10 bp and decays as a function of distance separating the k-mers, indicating that most of the dependencies in the enhancers are short-ranged.
Extended Data Fig. 3
Extended Data Fig. 3. Analysis of random enhancer STARR-seq data using machine learning models.
a, Binary classification accuracy of models trained to separate inactive (input) and active (STARR-seq) sequences from the random enhancer STARR-seq data in GP5d cells. CNN classifier (orange) outperforms a logistic regression model (blue) that uses HT-SELEX motifs (see Methods). Soft voting classifier (green) combining the predictions of the CNN and regression models does not improve over the CNN model. Classes are balanced in the test set so that a classifier assigning samples with random labels with equal probabilities would obtain an AUprc score of 0.5. b, Classification of high-confidence test set (class 1 sequences observed in both replicates of GP5d random enhancer STARR-seq experiment, red curve) with the GP5d random enhancer STARR-seq CNN classifier results in ~4% better AUprc value than classifying the full test set (yellow curve; see Methods), indicating that nonspecific carryover can explain only a small part of the relatively poor performance of the random enhancer STARR-seq classifiers. Removing the sequences that were sequenced more than once from the input library (~0.02% of all sequences, violet curve) does not further improve classification accuracy, indicating that sequences present in the highly complex input library in multiple copies do not affect the classification performance. Note that red and violet curves are overlapping. Classes are balanced in the test set as described for panel a. c, CNN activity contribution weight matrices (CACWM) learned by the CNN model from the random enhancer STARR-seq data analyzed using the ‘N-sweep’ approach. The N-sweep motifs generated using DeepLIFT and the random enhancer CNN model (right) for the 20 HT-SELEX motifs (left) with the largest absolute values for regression coefficient in the simple logistic regression model (see Methods for details, Supplementary Table 5 for SELEX motif patterns). Note that the contributions of the repressive motifs are negative towards predicting active enhancers and thus they appear below zero in the CACWM logos. Hash symbol marks the motifs classified as repressive by the logistic regression analysis. Parts of the HT-SELEX motif replicated in the CACWM indicate patterns learned by the CNN model.
Extended Data Fig. 4
Extended Data Fig. 4. Motifs learned by CNN from random enhancer STARR-seq data analyzed using TF-MoDISco approach.
Analysis of motifs learned by the CNN from random enhancer STARR-seq data using TF-MoDISco (transcription factor motif discovery from importance scores; see Methods). Patterns in metacluster 0 (top) and metacluster 1 (bottom) discovered by TF-MoDISco from unseen in silico generated random sequences classified as active enhancers by the CNN model using the in-built background model (see Methods for details). Number of seqlets supporting each pattern is shown for each pattern separately. Seqlets are segments of input that have substantial contribution to classification. Metacluster 0 from TF-MoDISco analysis contains patterns that increase enhancer probability according to the CNN model and metacluster 1 contains patterns that decrease enhancer probability. Motifs identified by TOMTOM are marked by bold typeface and the closest known motif by similarity is marked in parentheses.
Extended Data Fig. 5
Extended Data Fig. 5. Features of enhancer activity measured from human genomic DNA.
a, Venn diagram showing the concordance of biological and in silico replicate IDR peaks from genomic STARR-seq in HepG2 cells, demonstrating that the IDR method yields similar peak-calls (~90% specificity if biological replicate analysis is considered ground truth) when it is used as an internal control approach (see Methods). b, Genome browser snapshot of enhancer activity and TF binding at the BBC3 gene locus in GP5d and HepG2 cells, demonstrating the excellent signal-to-noise ratio of the STARR-seq data. Both plus and minus-strand STARR-seq signal is shown, as well as ATAC-seq coverage and ChIP-seq for H3K27ac, TP53, and HNF4A. Cell type–specific STARR-seq signals agree with tissue-specific TF binding with a common TP53-bound enhancer and a HepG2-sepcific HNF4A-bound enhancer highlighted with pink boxes. Genomic sequences at these loci with TP53 and HNF4A motifs are shown. c, Overlap between genomic STARR-seq peaks and genomic features (regulatory element features, ChIP-seq peaks for individual DNA-binding proteins and their motifs) in GP5d cells (see Methods). The total number of peaks for each experiment is the sum of the values inside its circle. The significance of the overlaps between STARR-seq and the other measurements (two-tailed Fisher’s exact test, see Methods for details): ATAC-seq: P < 2.2251×10−308; H3K27ac ChIP-seq: P < 2.2251×10−308; superenhancers: P < 2.2251×10−308; TT-seq enhancers: P < 2.2251×10−308; TP53 ChIP-seq: P < 2.2251×10−308; CTCF ChIP-seq: P = 4.1888×10−111; FOXA1 ChIP-seq: P < 2.2251×10−308. d, Top, overlap of genomic STARRseq peaks with TP53 ChIP-seq peaks and the p53 motif in HepG2 cells. The motif-match overlap was calculated using 24,176 highest affinity matches in the genome (all with score > 9). Bottom, overlap between STARR+, ATAC- peaks and ChIP-seq data for H3K4me1 and H3K9me3 histone modifications in HepG2 cells. Collectively, the results shown in panels c and d demonstrate that although p53 and IRF motifs are the strongest activators in the cells (see Fig. 1c, Fig. 2f), they contribute to a relatively small proportion of the overall enhancer activity, based on the overlap analysis of genomic STARR-seq peaks with TP53 ChIP-seq peaks and with p53 and IRF3 motifs (see also Supplementary Note).
Extended Data Fig. 6
Extended Data Fig. 6. Overlap analysis of human genomic STARR-seq and ATAC-seq data.
a, Overlap between ATAC-seq peaks (left) and STARR-seq peaks (right) with different genomic features in HepG2 cells. Full lists of interactions related to Euler plots in Fig. 4a are shown here, and the ones not shown in the Euler plots are highlighted with orange color. The horizontal bars show the total number of each type of feature overlapping the top quartile of the ATAC-seq peaks (15125 peaks; panel on the left) or STARR-seq peaks (3010 peaks; panel on the right) according to the maximum fragment coverage. The vertical bars show the size of the intersection indicated by the circles in the matrix. b, Comparison of active genomic regions in GP5d and HepG2 cells. Color scales indicate STARR-seq and ATAC-seq fragment coverages for three groups of peaks: STARR-seq peak in both cell lines (Common), and only in GP5d or in HepG2 cells. From each group, the top 1000 highest ranking peak regions (±1 kb of the summit) according to fold-change over control are shown (sum of ranks used for common peaks). The ‘Merged STARR-seq’ column shows the sum of fragment coverages from the two cell lines. The tracks are centered according to individual peak summits, or to the middle point of the two summits (for common peaks). c, Binary classification between ATAC-seq peaks and randomly sampled background from the genome (see Methods) using different CNN classifiers trained on GP5d ATAC-seq peaks (orange), sequences from the GP5d genomic STARR-seq experiment (blue), or sequences from the GP5d random STARR-seq experiment (black). Note that the classifier performs well even when trained using genomic STARR-seq data, suggesting that the sequence features in the two types of elements are similar. Classes are balanced in the test set, meaning that a classifier assigning samples with random labels with equal probabilities would obtain an AUprc (area under precision-recall curve) score of 0.5.
Extended Data Fig. 7
Extended Data Fig. 7. Comparison of regulatory features of different enhancer classes.
a, De novo motif analysis for over-representation of TF motifs within different enhancer classes in HepG2 cells defined on the basis of genomic STARR-seq and ATAC-seq signals (intersections as in Fig. 4a and Extended Data Fig. 6a, but the TSS-overlapping sequences have been excluded from the analysis, see Methods). b, Motif matches enriched in the chromatin-dependent enhancers (STARR-seq-, ATAC-seq+) and the classical enhancers (STARR-seq+, ATAC-seq + ) in HepG2 cells; intersections as in Fig. 4a and Extended Data Fig. 6a, but the TSS-overlapping sequences have been excluded from the analysis, see Methods). c, Motif matches enriched in the oligonucleotides showing the enhancer activity measured from the synthetic random enhancer library (y axis) compared to the genomic STARR-seq peaks (x axis) in GP5d cells. For each motif, the overlaps of the 100,000 highest affinity matches in the genome (or all with a score at least 9 if no 100,000 such matches) with the STARR-seq in silico IDR peaks (3250; see Methods for details) were included. Dimeric motifs are indicated by orientation with respect to core consensus sequence as described in legend to Fig. 1c. Asterisk indicates an A rich sequence 5’ of the IRF HT2 dimer. d, Genome browser snapshot of the regulatory region of the MYC gene showing STARR-seq signal from GP5d and HepG2 cells along with ATAC-seq, and ChIP-seq for H3K27ac. Superenhancers for HepG2 are from http://www.licpathway.net/sedb and for GP5d analyzed as described in Methods. Enhancers 3 and 4 have been previously described in ref. .
Extended Data Fig. 8
Extended Data Fig. 8. STARR-seq promoter CNN model for scoring TERT promoter mutants and analyzing promoter features.
a, All recurring TERT promoter mutants from ref. scored with the STARR-seq promoter CNN model and visualized with DeepLIFT (see Methods). The predicted promoter probability and location, and the type of the mutation are shown above each sequence (TSS at position 100). b–d, TERT promoter point mutations predicted by the CNN model trained using active promoters enriched from random sequences in GP5d cells (logarithm of odds ratio between the predicted promoter probability of the mutated vs. the wild-type sequence, see Methods) correlated to the measured effect of the same mutations in a saturation mutagenesis MPRA study (data for HEK293T and SF7996 cells from ref. ): predicted effect vs. measurements in HEK293T (b; Spearman R = 0.737, two-sided P = 1.768×10⁻⁵) and vs. SF7996 cells (c; Spearman R = 0.604, two-sided P = 8.455×10⁻⁴). Cross-correlation between HEK293T and SF7996 cells (d; Spearman R = 0.785, two-sided P = 1.674×10−36). In each panel, only mutations with P < 0.05 in both of the correlated predictions/measurements are shown (see Methods for details). e, The CNN trained on promoter data from binary STARR-seq experiment (blue) outperforms the CNN trained on the Eukaryotic Promoter Database (EPD, orange) on all but one of the 72 hyperparameter combinations tested (paired Student’s t test, two-sided P = 9.68 × 10⁻²³) in predicting the TSS position on unseen genomic test data. The fraction of predicted TSS positions within ±25 bp of the annotated TSS positions (y axis) vs. hyperparameter combinations (x axis; see Supplementary Table 8) is shown. f, g, Mutual information (MI)-based comparison of pairwise interactions learned by the CNN models trained on the STARR-seq active promoters (f) and the human genomic promoters (g). The triangle-shaped upper panels show the MI values between 3-mer distributions at each position of the models (see ref. ). Below is a zoomed-in view of the diagonal of the MI matrix showing the positional enrichment of TF binding sites. For both models, random sequences with predicted promoter probability over 0.9 according to 10 best individual CNNs were used for the MI analysis (see Methods and Supplementary Note for details).
Extended Data Fig. 9
Extended Data Fig. 9. Enhancer–promoter interactions and conservation of mammalian enhancers in STARR-seq data.
a, A control plot with comparison similar to that shown in Fig. 7a but performed using a set of PWMs that were reversed but not complemented. Note that the enrichment overall is much lower, and that the variance is similar to that observed in Fig. 7a, suggesting that most of the variance in Fig. 7a can be explained by random sampling and not biological effect. b, Conservation of GP5d genomic STARR-seq peaks (orange) and genomic STARR-seq input fragments (blue) measured with average GERP (genomic evolutionary rate profiling) scores. Higher GERP score means higher conservation. Three well-known mammalian enhancers are highlighted (see Methods for details). The average number of base pairs that are more conserved than the average coding base pair in the genomic STARR-seq peaks (170-bp region centered on the peak) was 51 for average peak and 119 for a set of known conserved and biologically important enhancers (MYC335, SOX9 and SHH); this clearly exceeds the ~7 bp conservation expected from the ~15-bit complexity of the TF motifs contained in the active elements derived from random sequence. These results suggest that regulatory elements in vivo are under more complex selection than elements selected for transcriptional activity in our assay.

References

    1. Lambert SA, et al. The human transcription factors. Cell. 2018;172:650–665. - PubMed
    1. Badis G, et al. Diversity and complexity in DNA recognition by transcription factors. Science. 2009;324:1720–1723. - PMC - PubMed
    1. Berger MF, et al. Compact, universal DNA microarrays to comprehensively determine transcription-factor binding site specificities. Nat. Biotechnol. 2006;24:1429–1435. - PMC - PubMed
    1. Jolma A, et al. DNA-binding specificities of human transcription factors. Cell. 2013;152:327–339. - PubMed
    1. Yin Y, et al. Impact of cytosine methylation on DNA binding specificities of human transcription factors. Science. 2017;356:eaaj2239. - PMC - PubMed

Publication types

MeSH terms

Substances