Drinking Water Quality and Public Health in the Kathmandu Valley, Nepal: Coliform Bacteria, Chemical Contaminants, and Health Status of Consumers
- PMID: 35190745
- PMCID: PMC8858048
- DOI: 10.1155/2022/3895859
Drinking Water Quality and Public Health in the Kathmandu Valley, Nepal: Coliform Bacteria, Chemical Contaminants, and Health Status of Consumers
Abstract
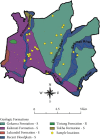
Residents of Nepal's Kathmandu Valley draw drinking water from tube wells, dug wells, and stone spouts, all of which have been reported to have serious water quality issues. In this study, we analyzed drinking water samples from 35 tube wells, dug wells, stone spouts, and municipal tap water for bacterial and chemical contaminants, including total and fecal coliform, aluminum, arsenic, barium, beryllium, boron, cadmium, cobalt, chromium, copper, fluoride, iron, mercury, manganese, molybdenum, nickel, lead, antimony, selenium, thallium, uranium, vanadium, and zinc. We also asked a sampling of households who used these specific water sources to rate the taste of their water, list any waterborne diseases they were aware of, and share basic health information about household members. This survey provided us with information from 146 households and 603 individuals. We found widespread bacterial contamination of water sources, with 94% of sources having detectable total or fecal coliform. Nepal Drinking Water Quality Standards and World Health Organization (WHO) Drinking-Water Guidelines or health-based values were exceeded for aluminum (max = 0.53 mg/L), arsenic (max = 0.071 mg/L), iron (max = 7.22 mg/L), and manganese (max = 3.229 mg/L). The distribution of water sources with high arsenic, iron, and manganese appeared to be associated with floodplain deposits. Mixed effects logistic regression models were used to examine the interactions between social factors and water contaminants and their effects on household members' health. Consumers of water sources with both high and low concentrations of manganese were less likely to have a positive attitude towards school than those whose water sources had moderate concentrations of manganese. Social factors, especially education, played a large role in predicting individual health outcomes. Household taste ratings of drinking water were not correlated with iron or manganese concentrations, suggesting that WHO's reliance on aesthetic criteria for these contaminants instead of formal drinking-water guidelines may not be sufficient to protect public health.
Copyright © 2022 Bibudhendra Sarkar et al.
Conflict of interest statement
The authors have no conflicts of interests to report. EM's affiliation is with Better Life Laboratories, a nonprofit organization that conducts scientific research and provides technical expertise, equipment, and training to help needy people around the world. Better Life Laboratories received no specific funding for this project from any donors. Donors to Better Life Laboratories provided no input in choosing the subject matter of this project, the hypotheses that were tested, the method of analysis, the research findings, the decision to publish, or the manner of disseminating the results.
Figures


References
-
- Government of Nepal. National Planning Commission. Nepal Human Development Report 2014 . Kathmandu, Nepal: Government of Nepal; 2014. https://www.hdr.undp.org/sites/default/files/nepal_nhdr_2014-final.pdf .
-
- Warner N. R., Levy J., Harpp K., Farruggia F. Drinking water quality in Nepal’s Kathmandu Valley: a survey and assessment of selected controlling site characteristics. Hydrogeology Journal . 2007;16(2):321–334. doi: 10.1007/s10040-007-0238-1. - DOI
-
- Chapagain S. K., Shrestha S., Nakamura T., Pandey V. P., Kazama F. Arsenic occurrence in groundwater of Kathmandu Valley, Nepal. Desalination and Water Treatment . 2009;4(1–3):248–254. doi: 10.5004/dwt.2009.492. - DOI
-
- Emerman S. H., Prasai T., Anderson R. B., Palmer M. A. Arsenic contamination of groundwater in the Kathmandu Valley, Nepal, as a consequence of rapid erosion. Journal of Nepal Geological Society . 2010;40:49–60. doi: 10.3126/jngs.v40i0.23595. - DOI
-
- Maharjan M., Shrestha B. R., Shrestha K. B., et al. Arsenic contamination in groundwater resources in Kathmandu Valley. In: Takizawa S., Kurisu F., Satoh H., editors. Southeast Asian Water Environment . Vol. 3. London, UK: IWA Publishing; 2009. pp. 73–79.
MeSH terms
Substances
LinkOut - more resources
Full Text Sources
Medical
Miscellaneous

