. 2022 Jun 3;145(5):1668-1683.
doi: 10.1093/brain/awab327.

Assessing the landscape of STXBP1-related disorders in 534 individuals

Affiliations

Assessing the landscape of STXBP1-related disorders in 534 individuals

Julie Xian et al. Brain. .

Abstract

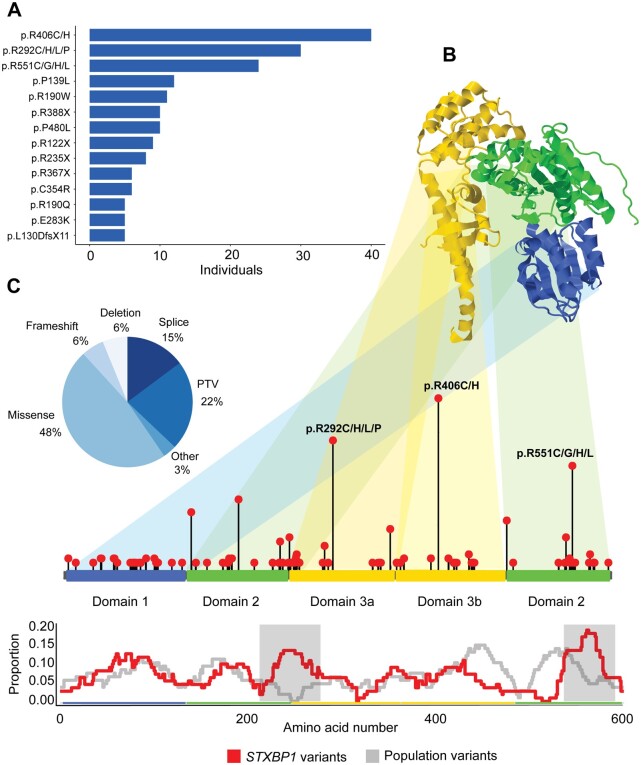
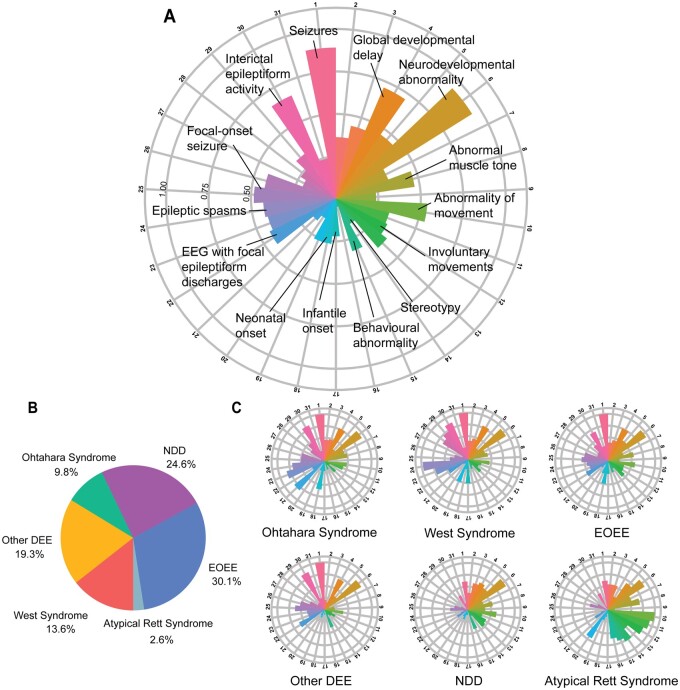
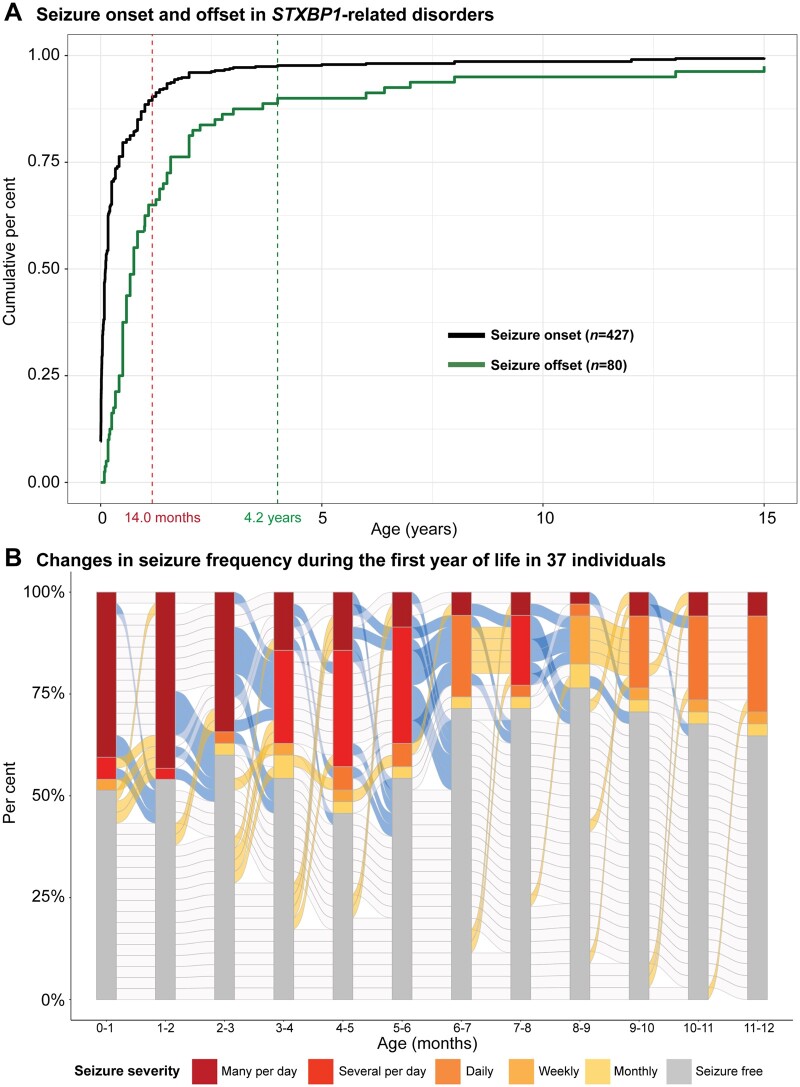
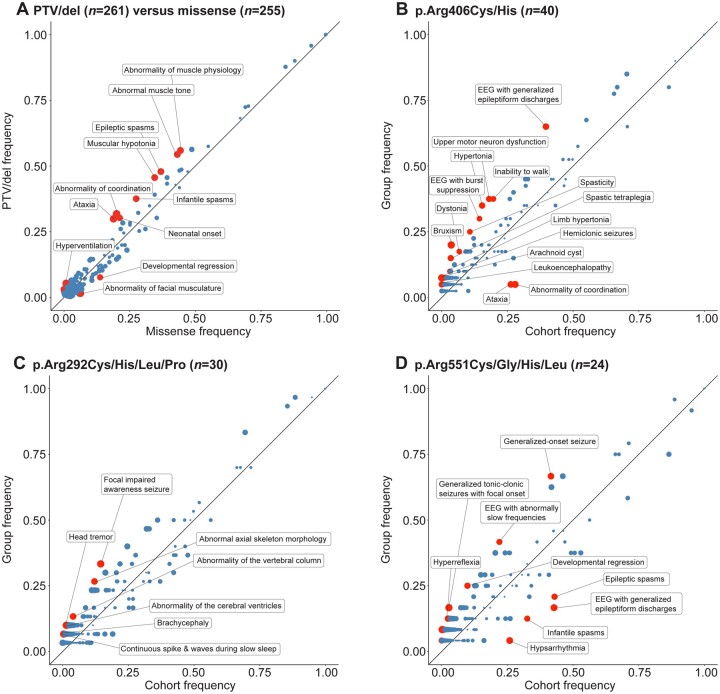
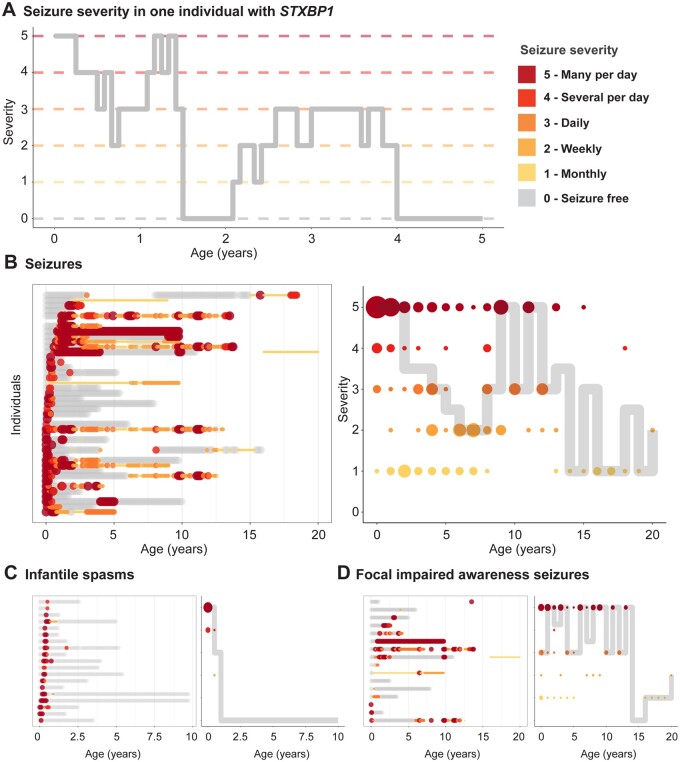
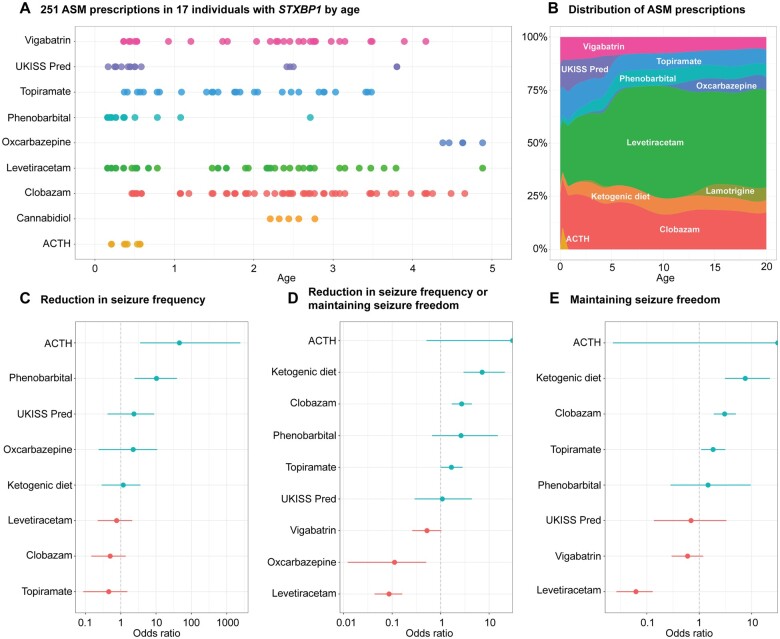
Disease-causing variants in STXBP1 are among the most common genetic causes of neurodevelopmental disorders. However, the phenotypic spectrum in STXBP1-related disorders is wide and clear correlations between variant type and clinical features have not been observed so far. Here, we harmonized clinical data across 534 individuals with STXBP1-related disorders and analysed 19 973 derived phenotypic terms, including phenotypes of 253 individuals previously unreported in the scientific literature. The overall phenotypic landscape in STXBP1-related disorders is characterized by neurodevelopmental abnormalities in 95% and seizures in 89% of individuals, including focal-onset seizures as the most common seizure type (47%). More than 88% of individuals with STXBP1-related disorders have seizure onset in the first year of life, including neonatal seizure onset in 47%. Individuals with protein-truncating variants and deletions in STXBP1 (n = 261) were almost twice as likely to present with West syndrome and were more phenotypically similar than expected by chance. Five genetic hotspots with recurrent variants were identified in more than 10 individuals, including p.Arg406Cys/His (n = 40), p.Arg292Cys/His/Leu/Pro (n = 30), p.Arg551Cys/Gly/His/Leu (n = 24), p.Pro139Leu (n = 12), and p.Arg190Trp (n = 11). None of the recurrent variants were significantly associated with distinct electroclinical syndromes, single phenotypic features, or showed overall clinical similarity, indicating that the baseline variability in STXBP1-related disorders is too high for discrete phenotypic subgroups to emerge. We then reconstructed the seizure history in 62 individuals with STXBP1-related disorders in detail, retrospectively assigning seizure type and seizure frequency monthly across 4433 time intervals, and retrieved 251 anti-seizure medication prescriptions from the electronic medical records. We demonstrate a dynamic pattern of seizure control and complex interplay with response to specific medications particularly in the first year of life when seizures in STXBP1-related disorders are the most prominent. Adrenocorticotropic hormone and phenobarbital were more likely to initially reduce seizure frequency in infantile spasms and focal seizures compared to other treatment options, while the ketogenic diet was most effective in maintaining seizure freedom. In summary, we demonstrate how the multidimensional spectrum of phenotypic features in STXBP1-related disorders can be assessed using a computational phenotype framework to facilitate the development of future precision-medicine approaches.

Keywords: STXBP1; Human Phenotype Ontology; developmental and epileptic encephalopathy; epilepsy; genetics.


Figures

Figure 1
Figure 1
Overview of STXBP1 variants. (A) Recurrent STXBP1 variants found in five or more individuals. (B) The STXBP1 protein (top) and gene (bottom), highlighting a selection of recurrent variant hotspots. The proportion of STXBP1 disorder-associated versus population variants is shown below, highlighting (grey) regions in which the difference is significant. (C) Distribution of variant types. Splice site, frameshift variants and whole and partial gene deletions were included in the PTV/del group.
Figure 2
Figure 2
Individuals reported with STXBP1-related disorders and associated phenotypic features across subgroups. (A) Distribution of phenotypic features in the overall cohort of 534 individuals. Radial lines indicate frequency of terms in the respective cohort. 1: seizures; 2: abnormality of higher mental function; 3: delayed speech and language development; 4: global developmental delay; 5: Intellectual disability; 6: Neurodevelopmental abnormality; 7: Neurological speech impairment; 8: Abnormal muscle tone; 9: Abnormality of coordination; 10: Abnormality of movement; 11: gait disturbance; 12: involuntary movements; 13: muscular hypotonia; 14: stereotypy; 15: behavioural abnormality; 16: bruxism; 17: infantile onset; 18: neonatal onset; 19: paediatric onset; 20: sleep disturbance; 21: EEG with burst suppression; 22: EEG with focal epileptiform discharges; 23: EEG with generalized epileptiform discharges; 24: epileptic spasms; 25: focal-onset seizure; 26: generalized-onset seizure; 27: generalized tonic–clonic seizures; 28: hypsarrhythmia; 29: infantile spasms; 30: interictal epileptiform activity; and 31: multifocal epileptiform discharges. (B) Individuals were grouped into broad phenotypic groups: EOEE (n = 163), neurodevelopmental disorders (NDD, n = 129), developmental and epileptic encephalopathy not otherwise specified (other DEE, n = 103), West syndrome (n = 77), Ohtahara syndrome (n = 49) and atypical Rett syndrome (n = 13). (C) Distribution of phenotypic features across subgroups.
Figure 3
Figure 3
Seizure patterns in a subset of individuals with STXBP1-related disorders. (A) Cumulative distribution of seizure onset in 427 individuals and seizure offset in 80 individuals, highlighting 89% of individuals with seizure onset in the first year of life and offset within the first 5 years. Seizure onset interquartile range (IQR): 0.24–5.0 months. Seizure offset IQR: 5.75 months–1.6 years. (B) Changes in seizure frequency in monthly intervals during the first year of life, indicating a dynamic course of seizures in individuals with STXBP1. Progression in blue between monthly increments indicates seizure improvement, whereas yellow indicates seizures worsening and grey indicates no change in seizure frequency.
Figure 4
Figure 4
Phenograms of missense variants versus PTV and most frequent recurrent variant hotspots. (A) Phenogram comparing the frequency of phenotypic features in individuals with PTV/del (n = 261) and individuals with missense variants (n = 255). PTV/dels included splice sites, frameshifts and whole and partial gene deletions. (B) Phenogram comparing the frequency of phenotypic features in individuals with variants in p.Arg406Cys/His and the remainder of the cohort. (C) Phenogram comparing the frequency of phenotypic features in individuals with variants in p.Arg292Cys/His/Leu/Pro and the remainder of the cohort. (D) Phenogram comparing the frequency of phenotypic features in individuals with variants in p.Arg551Cys/Gly/His/Leu and the remainder of the cohort. Red points indicate HPO terms with uncorrected P-values < 0.05, while blue points indicate HPO terms with uncorrected P-values ≥ 0.05. Size of points indicate −log10(P-value).
Figure 5
Figure 5
Reconstruction of seizure frequency in monthly increments. (A) Changes in seizure severity with time in one individual with STXBP1-related disorder are shown. Seizure severity is represented by ordinal seizure frequency (SF) scores: multiple daily seizures (SF = 5), several daily seizures (SF = 4), daily seizures (SF = 3), weekly seizures (SF = 2), monthly seizures (SF = 1), no seizures (SF = 0). (B) Pattern of seizure frequency in individuals with seizures, regardless of type (HP:0001250, n = 43). Seizure frequencies of individuals tracked across time (left), each row along the y-axis representing a unique individual. Colour and size of dots represent seizure severity. Median severity in the subgroup with size of dots indicating number of individuals (right). (C) Pattern of seizure frequency in individuals with infantile spasms (HP:0012469, n = 19). (D) Pattern of seizure frequency in individuals with focal impaired awareness seizures (HP:0002384, n = 16).
Figure 6
Figure 6
Comparative effectiveness assessment of ASM and treatment responses. (A) Selection of ASM prescriptions extracted from the EMR, across ages 0–5 years in a subset of individuals with STXBP1. (B) Extension of A, showing the distribution of individuals on ASM and ketogenic diet across ages 0–20 years. (C) Relative effectiveness of ASM in reducing seizure frequency. (D) Relative effectiveness of ASM in reducing seizure frequency or maintaining seizure freedom. (E) Relative effectiveness of ASM in maintaining seizure freedom. Odds ratios were calculated based on changes in seizure frequency to ASM use across monthly time intervals.

References

    1. Lopez-Rivera JA, Perez-Palma E, Symonds J, et al. . A catalogue of new incidence estimates of monogenic neurodevelopmental disorders caused by de novo variants. Brain. 2020;143(4):1099–1105. - PMC - PubMed
    1. Stamberger H, Nikanorova M, Willemsen MH, et al. . STXBP1 encephalopathy: A neurodevelopmental disorder including epilepsy. Neurology. 2016;86(10):954–962. - PubMed
    1. Saitsu H, Kato M, Mizuguchi T, et al. . De novo mutations in the gene encoding STXBP1 (MUNC18-1) cause early infantile epileptic encephalopathy. Nat Genet. 2008;40(6):782–788. - PubMed
    1. O'Brien S, Ng-Cordell E, Study DDD, Astle DE, Scerif G, Baker K;DDD Study . STXBP1-associated neurodevelopmental disorder: A comparative study of behavioural characteristics. J Neurodev Disord. 2019;11(1):17. - PMC - PubMed
    1. Suri M, Evers JMG, Laskowski RA, et al. ; DDD Study . Protein structure and phenotypic analysis of pathogenic and population missense variants in STXBP1. Mol Genet Genomic Med. 2017;5(5):495–507. - PMC - PubMed

Publication types