

18F-FSPG PET/CT Imaging of System xC- Transporter Activity in Patients with Primary and Metastatic Brain Tumors
- PMID: 35191738
- PMCID: PMC9131170
- DOI: 10.1148/radiol.203296
18F-FSPG PET/CT Imaging of System xC- Transporter Activity in Patients with Primary and Metastatic Brain Tumors
Abstract
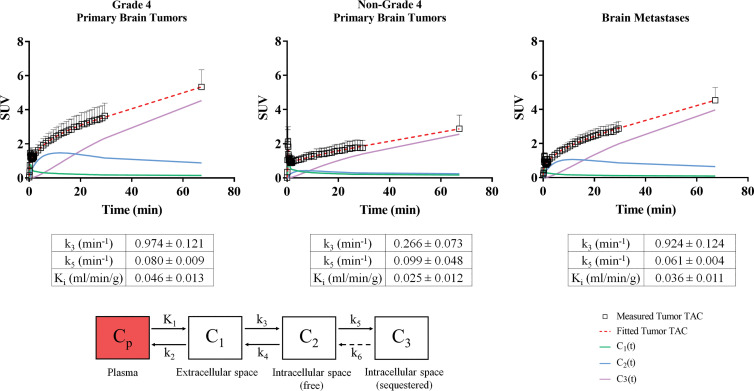
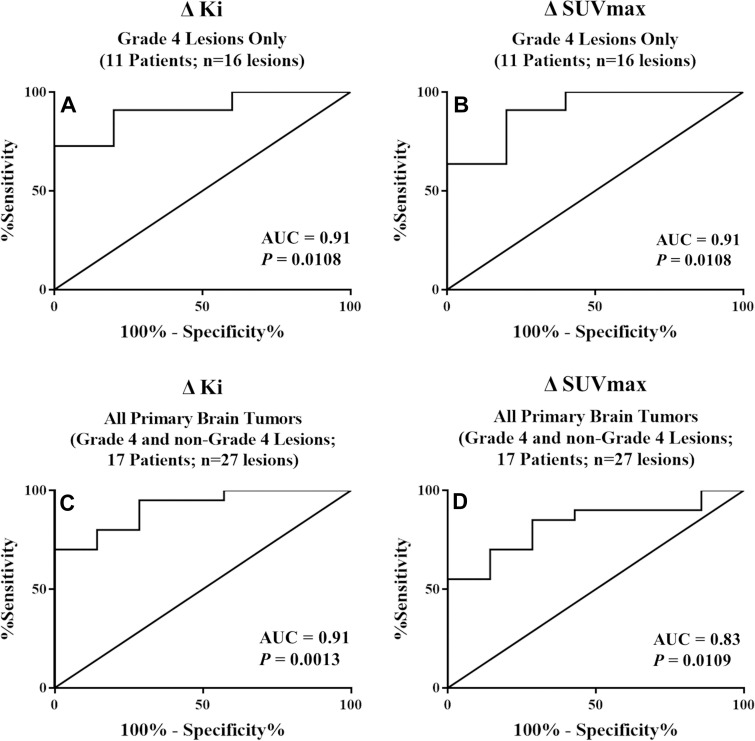
Background The PET tracer (4S)-4-(3-[18F]fluoropropyl)-l-glutamate (18F-FSPG) targets the system xC- cotransporter, which is overexpressed in various tumors. Purpose To assess the role of 18F-FSPG PET/CT in intracranial malignancies. Materials and Methods Twenty-six patients (mean age, 54 years ± 12; 17 men; 48 total lesions) with primary brain tumors (n = 17) or brain metastases (n = 9) were enrolled in this prospective, single-center study (ClinicalTrials.gov identifier: NCT02370563) between November 2014 and March 2016. A 30-minute dynamic brain 18F-FSPG PET/CT scan and a static whole-body (WB) 18F-FSPG PET/CT scan at 60-75 minutes were acquired. Moreover, all participants underwent MRI, and four participants underwent fluorine 18 (18F) fluorodeoxyglucose (FDG) PET imaging. PET parameters and their relative changes were obtained for all lesions. Kinetic modeling was used to estimate the 18F-FSPG tumor rate constants using the dynamic and dynamic plus WB PET data. Imaging parameters were correlated to lesion outcomes, as determined with follow-up MRI and/or pathologic examination. The Mann-Whitney U test or Student t test was used for group mean comparisons. Receiver operating characteristic curve analysis was used for performance comparison of different decision measures. Results 18F-FSPG PET/CT helped identify all 48 brain lesions. The mean tumor-to-background ratio (TBR) on the whole-brain PET images at the WB time point was 26.6 ± 24.9 (range: 2.6-150.3). When 18F-FDG PET was performed, 18F-FSPG permitted visualization of non-18F-FDG-avid lesions or allowed better lesion differentiation from surrounding tissues. In participants with primary brain tumors, the predictive accuracy of the relative changes in influx rate constant Ki and maximum standardized uptake value to discriminate between poor and good lesion outcomes were 89% and 81%, respectively. There were significant differences in the 18F-FSPG uptake curves of lesions with good versus poor outcomes in the primary brain tumor group (P < .05) but not in the brain metastases group. Conclusion PET/CT imaging with (4S)-4-(3-[18F]fluoropropyl)-l-glutamate (18F-FSPG) helped detect primary brain tumors and brain metastases with a high tumor-to-background ratio. Relative changes in 18F-FSPG uptake with multi-time-point PET appear to be helpful in predicting lesion outcomes. Clinical trial registration no. NCT02370563 © RSNA, 2022 Online supplemental material is available for this article.
Conflict of interest statement
Figures

![(A) Images in a 63-year-old woman (participant 13) with right
temporoparietal glioblastoma multiforme treated with surgery, followed by
chemotherapy (temozolomide) and radiation therapy. MRI findings are
equivocal for residual disease versus posttreatment change. Static
(4S)-4-(3-[18F]fluoropropyl)-L-glutamate (18F-FSPG) PET image (left) shows
intense uptake in the tumor lesion (arrow), which is visible on the
postcontrast three-dimensional spoiled gradient-echo MRI scan (arrow,
middle). The tumor time-activity curve (TAC) from the dynamic 18F-FSPG PET
images (right) shows a rapidly increasing uptake over time in the
glioblastoma multiforme lesion with an early peak uptake in the first 10
frames. In the background tissue TAC, there is an early peak in the first 10
frames followed by a downward slope and an eventual plateau near zero
activity in the final 28 frames. Subsequent pathologic examination confirmed
the presence of malignant cells. The outcome score for this lesion was a 5.
SUVmax = maximum standardized uptake value. (B) Images in a 44-year-old man
(participant 4) with glioblastoma multiforme in the right temporal lobe
treated with surgery, followed by chemotherapy and repeat resection showing
no tumor. MRI scan (middle) shows an area of contrast enhancement concerning
for progression (arrow). Static 18F-FSPG PET image (left) shows weak uptake
(arrow). The lesion TAC from the dynamic 18F-FSPG PET images (right) shows a
plateau line after an early uptake peak, and higher uptake values in the
tumor lesion at late times when compared to background, with a slight and
slow tendency to increase over time. Subsequent pathologic examination
showed necrosis and reactive changes with no definite glial neoplasm. The
outcome score for this lesion was a 1. (C) Images in a 77-year-old man
(participant 2) with grade III unresectable anaplastic astrocytoma of the
temporal lobe (postradiation therapy). Baseline MRI scan (middle) shows a
lesion with two separate components, one medial (lesion 1, red arrow) and
one lateral (lesion 2, green arrow). Static 18F-FSPG PET image (left) shows
prominent uptake medially (SUVmax = 12), and weak uptake laterally (lesion
SUVmax = 3 on whole body [WB] PET). Follow-up MRI scan (middle) obtained 4
months after baseline shows an increase in size of the medial component,
while the lateral component remains stable. In the background volume of
interest, the TAC on the dynamic 18F-FSPG PET scan (right) shows an
exponential decaying behavior after an early uptake peak. A similar TAC
pattern is seen in the lateral lesion, but with higher uptake values at late
times when compared to the background volume of interest, with a slight and
slow tendency to increase over time. The medial lesion shows rapidly
increasing uptake over time throughout the whole duration of the dynamic PET
acquisition. The slight tendency of 18F-FSPG uptake to increase in the
lateral (nonenhancing) component of the tumor, and the mild uptake on the WB
late scan (SUVmax = 3), suggests a “wait and watch” approach
would be best for this lesion. Mild uptake indicates uptake slightly higher
than surrounding background (healthy tissue). The outcome score for both
lesions in this patient was a 4.](https://cdn.ncbi.nlm.nih.gov/pmc/blobs/9379/9131170/39255d22ed38/radiol.203296.fig1.jpg)
![Images in a 65-year-old woman (participant 3) with non–small
cell lung cancer brain metastases. (A) Contrast-enhanced MRI scan shows a
small right frontal lesion (lesion 1, green arrow) and also an enhancing
lesion within the right central sulcus (lesion 2, red arrow), which may
represent evolving treatment effects or progression. (B) Fluorine 18
fluorodeoxyglucose PET image shows no uptake in either lesion, whereas (C)
(4S)-4-(3-[18F]fluoropropyl)-L-glutamate (18F-FSPG) PET image shows mild
uptake in the smaller anterior lesion and intense uptake in the bigger
posterior lesion. (D) Tissue time-activity curves from the dynamic 18F-FSPG
PET images show a plateau line after an early uptake peak in the background
volume of interest, and a similar pattern in the small right frontal lesion
(lesion 1), whereas the larger lesion in the right central sulcus (lesion 2)
shows rapidly increasing uptake over time throughout the whole duration of
the dynamic acquisition. The outcome score was 1 for lesion 1 and 2 for
lesion 2. SUV = standardized uptake value, SUVmax = maximum SUV.](https://cdn.ncbi.nlm.nih.gov/pmc/blobs/9379/9131170/b0c6c7599aec/radiol.203296.fig2.jpg)

![Box-and-whisker plots show the percentage change in
(4S)-4-(3-[18F]fluoropropyl)-L-glutamate (18F-FSPG) influx rate constant
(Ki) and maximum standardized uptake (SUVmax) for grade 4–only
lesions (A and C) and grade 4 and non–grade 4 lesions pooled together
(B and D). A plus sign (+) denotes the mean value in the box plots. The
Student t test was used for group mean comparisons.](https://cdn.ncbi.nlm.nih.gov/pmc/blobs/9379/9131170/dfc20c4cc3ab/radiol.203296.fig5.jpg)
Similar articles
-
123I-MIBG scintigraphy and 18F-FDG-PET imaging for diagnosing neuroblastoma.Cochrane Database Syst Rev. 2015 Sep 29;2015(9):CD009263. doi: 10.1002/14651858.CD009263.pub2. Cochrane Database Syst Rev. 2015. PMID: 26417712 Free PMC article.
-
The value of FDG positron emission tomography/computerised tomography (PET/CT) in pre-operative staging of colorectal cancer: a systematic review and economic evaluation.Health Technol Assess. 2011 Sep;15(35):1-192, iii-iv. doi: 10.3310/hta15350. Health Technol Assess. 2011. PMID: 21958472 Free PMC article.
-
Fluorine-18-fluorodeoxyglucose (FDG) positron emission tomography (PET) computed tomography (CT) for the detection of bone, lung, and lymph node metastases in rhabdomyosarcoma.Cochrane Database Syst Rev. 2021 Nov 9;11(11):CD012325. doi: 10.1002/14651858.CD012325.pub2. Cochrane Database Syst Rev. 2021. PMID: 34753195 Free PMC article.
-
Is 18 F-fluoride PET/CT an Accurate Tool to Diagnose Loosening After Total Joint Arthroplasty?Clin Orthop Relat Res. 2025 Mar 1;483(3):415-428. doi: 10.1097/CORR.0000000000003228. Epub 2024 Sep 11. Clin Orthop Relat Res. 2025. PMID: 39293088
-
¹⁸F-FDG PET/CT: a review of diagnostic and prognostic features in multiple myeloma and related disorders.Clin Exp Med. 2015 Feb;15(1):1-18. doi: 10.1007/s10238-014-0308-3. Epub 2014 Sep 14. Clin Exp Med. 2015. PMID: 25218739
Cited by
-
PET Oncological Radiopharmaceuticals: Current Status and Perspectives.Molecules. 2022 Oct 11;27(20):6790. doi: 10.3390/molecules27206790. Molecules. 2022. PMID: 36296381 Free PMC article. Review.
-
Imaging at the nexus: how state of the art imaging techniques can enhance our understanding of cancer and fibrosis.J Transl Med. 2024 Jun 13;22(1):567. doi: 10.1186/s12967-024-05379-1. J Transl Med. 2024. PMID: 38872212 Free PMC article. Review.
-
Simplified and Highly-reliable automated production of [18F]FSPG for clinical studies.Res Sq [Preprint]. 2023 Jun 26:rs.3.rs-3031030. doi: 10.21203/rs.3.rs-3031030/v1. Res Sq. 2023. Update in: EJNMMI Radiopharm Chem. 2023 Jul 24;8(1):15. doi: 10.1186/s41181-023-00200-8. PMID: 37461634 Free PMC article. Updated. Preprint.
-
Is System xc- a Suitable Target for Tumour Detection and Response Assessment with Imaging?Cancers (Basel). 2023 Nov 24;15(23):5573. doi: 10.3390/cancers15235573. Cancers (Basel). 2023. PMID: 38067277 Free PMC article. Review.
-
The feasibility of quantitative assessment of dynamic 18F-fluorodeoxyglucose PET in Takayasu's arteritis: a pilot study.Eur J Nucl Med Mol Imaging. 2023 Dec;51(1):81-92. doi: 10.1007/s00259-023-06429-4. Epub 2023 Sep 11. Eur J Nucl Med Mol Imaging. 2023. PMID: 37691022
References
-
- Ferguson SD . Malignant gliomas: diagnosis and treatment . Dis Mon 2011. ; 57 ( 10 ): 558 – 569 . - PubMed
-
- Shah AH , Snelling B , Bregy A , et al. . Discriminating radiation necrosis from tumor progression in gliomas: a systematic review what is the best imaging modality? J Neurooncol 2013. ; 112 ( 2 ): 141 – 152 . - PubMed
