. 2022 Feb 22;7(1):e0125521.
doi: 10.1128/msystems.01255-21. Epub 2022 Feb 22.

Metabolic Diversity and Aero-Tolerance in Anammox Bacteria from Geochemically Distinct Aquifers

Affiliations

Metabolic Diversity and Aero-Tolerance in Anammox Bacteria from Geochemically Distinct Aquifers

Olivia E Mosley et al. mSystems. .

Abstract

Anaerobic ammonium oxidation (anammox) is important for converting bioavailable nitrogen into dinitrogen gas, particularly in carbon-poor environments. However, the diversity and prevalence of anammox bacteria in the terrestrial subsurface-a typically oligotrophic environment-are little understood. To determine the distribution and activity of anammox bacteria across a range of aquifer lithologies and physicochemistries, we analyzed 16S rRNA genes and quantified hydrazine synthase genes and transcripts sampled from 59 groundwater wells and metagenomes and metatranscriptomes from an oxic-to-dysoxic subset. Data indicate that anammox and anammox-associated bacteria (class "Candidatus Brocadiae") are prevalent in the aquifers studied, and that anammox community composition is strongly differentiated by dissolved oxygen (DO), but not ammonia/nitrite. While "Candidatus Brocadiae" diversity decreased with increasing DO, "Candidatus Brocadiae" 16S rRNA genes and hydrazine synthase (hzsB) genes and transcripts were detected across a wide range of bulk groundwater DO concentrations (0 to 10 mg/L). Anammox genes and transcripts correlated significantly with those involved in aerobic ammonia oxidation (amoA), potentially representing a major source of nitrite for anammox. Eight "Candidatus Brocadiae" genomes (63 to 95% complete), representing 2 uncharacterized families and 6 novel species, were reconstructed. Six genomes have genes characteristic of anammox, all for chemolithoautotrophy. Anammox and aerotolerance genes of up to four "Candidatus Brocadiae" genomes were transcriptionally active under oxic and dysoxic conditions, although activity was highest in dysoxic groundwater. The coexpression of nrfAH nitrite reductase genes by "Candidatus Brocadiae" suggests active regeneration of ammonia for anammox. Our findings indicate that anammox bacteria contribute to loss of fixed N across diverse anoxic-to-oxic aquifer conditions, which is likely supported by nitrite from aerobic ammonia oxidation. IMPORTANCE Anammox is increasingly shown to play a major role in the aquatic nitrogen cycle and can outcompete heterotrophic denitrification in environments low in organic carbon. Given that aquifers are characteristically oligotrophic, anammox may represent a major route for the removal of fixed nitrogen in these environments, including agricultural nitrogen, a common groundwater contaminant. Our research confirms that anammox bacteria and the anammox process are prevalent in aquifers and occur across diverse lithologies (e.g., sandy gravel, sand-silt, and volcanic) and groundwater physicochemistries (e.g., various oxygen, carbon, nitrate, and ammonium concentrations). Results reveal niche differentiation among anammox bacteria largely driven by groundwater oxygen contents and provide evidence that anammox is supported by proximity to oxic niches and handoffs from aerobic ammonia oxidizers. We further show that this process, while anaerobic, is active in groundwater characterized as oxic, likely due to the availability of anoxic niches.

Keywords: aero-tolerance; ammonia oxidizers; anammox; aquifer; groundwater; “Candidatus Brocadiae”.


Conflict of interest statement

The authors declare no conflict of interest.

Figures

FIG 1
FIG 1
Box plot and stacked bar graphs showing the prevalence, relative abundance, and diversity of anammox bacteria (“Ca. Brocadiae”), based on 16S rRNA gene amplicon data. (a) Number of OTUs identified as “Ca. Brocadiae” relative to other bacteria (p:Other) and non-anammox Planctomycetes (p:Other Planctomycetes) across 80 samples. The horizontal line represents the median number of OTUs present. (b) Structure of the anammox bacterial community observed in 60 samples where “Ca. Brocadiae” were identified, ordered by DO concentration. (c) Structure of the anammox bacterial community observed in groundwater (left) and biomass-enriched groundwater (right), ordered by groundwater DO concentration. Black points show DO content. Bars represent different genera within the class “Ca. Brocadiae.” g, genus; f, family; o, order; c, class; p, phylum.
FIG 2
FIG 2
Diversity analysis and an ordination plot showing the environmental variables and factors influencing the structure of the anammox community. (a) Box plots represent observed OTUs (richness) and inverse Simpson diversity at anoxic, suboxic, dysoxic, and oxic sites (***, P < 0.01; Wilcoxon test). (b) Distance-based redundancy analysis of the 16S amplicon data from the 60 groundwater samples using a Bray-Curtis dissimilarity matrix between samples based on OTU abundance. Vectors show significant environmental variables (excluding ORP due to missing values), constraining the variability in community composition (P < 0.05). “Ca. Brocadiae” OTUs were added to the ordination using species scores (colored squares), and the 5 OTUs shown are identified to the lowest level of taxonomy (g, genus; f, family; o, order; c, class; p, phylum). Several amplicon sequence variants (ASVs) matched each of the 5 OTUs shown with 99 to 100% identity; OTU75 (9 ASVs), OTU74 (6 ASVs), OTU335 (5 ASVs), OTU363 (6 ASVs), and OTU273 (9 ASVs).
FIG 3
FIG 3
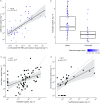
Correlations between 16S rRNA gene amplicon data, aerobic ammonia oxidizers (archaea and bacteria), and abundance of hydrazine synthase genes and transcripts from ddPCR data. (a) Correlation of hzsB gene copies per liter of groundwater (log10) and number of “Ca. Brocadiae” (log10) gene amplicon sequences from the rarefied OTU table with samples containing the class “Ca. Brocadiae,” showing strong agreement between quantitative data for the hzsB anammox functional marker gene and “Ca. Brocadiae” relative abundances. (b) Box plot representing log10 abundance of hzsB genes for genes and transcripts. Black open circles represent means and horizontal lines represent the medians of gene copies per liter. Purple gradients for panels a and b correspond to DO concentration. (c) Correlation of amoA genes (log10) and hzsB genes (log10) copies per liter of groundwater using Spearman’s correlation for genetic potential (DNA). (d) Correlation of amoA genes (log10) and hzsB genes (log10) copies per liter of groundwater using Spearman’s correlation in transcripts (RNA). The gray dashed line shows the theoretical 1:1 ratio.
FIG 4
FIG 4
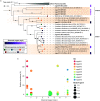
Phylogenetic distribution and relative abundance of “Ca. Brocadiae” MAGs. (a) Maximum-likelihood phylogenomic tree of 28 Planctomycetes genomes based on 120 concatenated bacterial marker genes (GTDB-Tk) (68 to 114 genes present) with 5,040 amino acid sites using the LG+F+R5 model of substitution and 1,000 bootstraps. The purple gradient represents the DO concentration at the site with highest relative genome abundance for that genome. Colored tiles represent the environment of recovery for the reference genomes. Bootstrap values shown as black circles equal 100%. The scale bar indicates the number of substitutions per site. Sequences from this study are shown in bold font, with both the study identifier and GTDB classification given. Orange shading represents clades of “Ca. Brocadiae” genomes recently recovered from aquifers. See Table S3 for reference genome details. (b) “Ca. Brocadiae” genome relative abundance across DO concentration at each site (relative to other “Ca. Brocadiae”). Bubble size corresponds to nitrate concentration at each site.
FIG 5
FIG 5
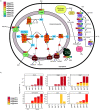
Overview of the predicted metabolic pathways of characterized anammox bacteria built from the summarized annotated data from the reconstructed genomes and mapped transcripts. (a) Metabolic pathways present in MAGs. Nxr, nitrite:nitrate oxidoreductase; Nir, nitrite reductase; Nrf, nitrite reductase forming ammonium; HZS, hydrazine synthase; HDH, hydrazine dehydrogenase; AmtB, ammonium transporters; FocA, nitrite transporters; NarK, nitrite/nitrate transporter; ETM, electron transfer module from quinone pool to HZS (composed of kuste2856 and kuste2855); R/b, Rieske/cytochrome b (bc1) complexes, R/b-2 (kustd1480-85), and R/b-3 (kuste4569-74); F-type ATPase, F-type ATP synthase (MAGs containing ≥50% of subunits); GAP, glyceraldehyde 3-phosphate; EMP, Embden-Meyerhof-Parnas pathway; FDH, formate dehydrogenase; FHS, formate–tetrahydrofolate ligase; FolD, methylenetetrahydrofolate dehydrogenase; MetF, methylenetetrahydrofolate reductase; AcsE, 5-methyltetrahydrofolate:corrinoid; AcsB, acetyl-CoA synthase; AcsA, anaerobic carbon-monoxide dehydrogenase catalytic subunit; PPP, pentose phosphate pathway; TCA, tricarboxylic acid cycle. Colors represent genomes from this study, numbers and numbers of copies present. *, partial HzsA subunit. (b) Log10 TPM values for active genes for hydrazine synthase, hydrazine dehydrogenase, and nitrite reductase forming ammonium from groundwater characterized as oxic (gwj09 from well SR1 and gwj11 from well SR2) and dysoxic (gwj13-14 from well E1 and gwj15-16 from well N3). Samples gwj14 and gwj16 are sonicated groundwater.
FIG 6
FIG 6
Plot of dissolved nitrogen versus dissolved argon concentrations at sites sampled for metagenomics analysis. Dissolved Ar and N2 are expressed in milliliters of the respective gas at standard temperature (273.15 K) and pressure (101.325 kPa) per kg of water. Bold lines represents gas concentrations in water which are in equilibrium with the atmosphere at the given temperature. Arrows indicate competing processes that can alter gas concentrations, and gray dashed lines indicate excess air in groundwater relative to atmosphere (with upper and lower lines representing addition of unfractionated excess air relative to equilibrium concentrations at 10 and 15°C). The black horizontal arrow depicts additional excess N2 inferred to be from biological processes (denitrification or anammox). Reconstructed N2 data (in equilibrium with inert atmospheric gases), based on groundwater recharge temperatures and excess air concentrations derived from dissolved Ne and Ar data (shown as black circles). Recharge temperature is the temperature of recharging water at the time it enters the groundwater system. Excess air is dissolved air in excess of the equilibrium soluble amount at the given recharge temperature (thought to originate from processes such as bubble entrapment occurring during recharge and subsequent dissolution under increased hydrostatic pressure). The difference between these and the measured N2 data (numbered blue circles and their shift along the x axis relative to the corresponding numbered black circles) indicates the amount of N2 in excess, formed via denitrification and/or anammox at each site. Error bars show the combined statistical standard uncertainty from all processes and calculations contributing to the measurement uncertainty, expressed as 1 standard deviation. Groundwater from wells SR1-2, BW8, BW19, and RF2-3 is characterized as oxic, while groundwater from E1 and N3 is dysoxic-suboxic (Table S1).
FIG 7
FIG 7
Hydrazine synthase subunit B (hzsB) abundance (genes and transcripts copies) from 4 wells at sites sampled for metagenomic analysis.
FIG 8
FIG 8
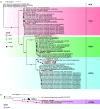
Phylogenetic tree of the recovered hydrazine synthase protein subunits from “Ca. Brocadiae.” (a) Phylogenetic tree with 65 protein sequences of hydrazine synthase subunits with 964 amino acid sites, built using the WAG+G4 model using 1,000 bootstraps. The hydrazine synthase (HZS) alpha, beta, and gamma proteins were predicted from protein-coding sequences recovered from genomes in the study (red) and other HZS protein sequences available from the UniProt database. HDH, hydrazine dehydrogenase. Bold black sequences are from the representative model organism “Ca. Kuenenia stuttgartiensis.” Circles represent >50% bootstrap values. The scale bar represents the number of substitutions per site. (b) Phylogenetic tree of 10 fused HZS beta-gamma predicted protein sequences, and another 6 HzsA (alpha subunit) sequences, made using 903 amino acid sites and built using the WAG+G4 model (1,000 bootstraps). Circles represent >75% bootstrap values; the red sequence was recovered in this study.

Similar articles

Cited by

References

    1. Rivett MO, Buss SR, Morgan P, Smith JWN, Bemment CD. 2008. Nitrate attenuation in groundwater: a review of biogeochemical controlling processes. Water Res 42:4215–4232. doi:10.1016/j.watres.2008.07.020. - DOI - PubMed
    1. Jetten MSM. 2008. The microbial nitrogen cycle. Environ Microbiol 10:2903–2909. doi:10.1111/j.1462-2920.2008.01786.x. - DOI - PubMed
    1. Strous M, Fuerst JA, Kramer EHM, Logemann S, Muyzer G, Van De Pas-Schoonen KT, Webb R, Kuenen JG, Jetten MSM. 1999. Missing lithotroph identified as new planctomycete. Nature 400:446–449. doi:10.1038/22749. - DOI - PubMed
    1. Oshiki M, Satoh H, Okabe S. 2016. Ecology and physiology of anaerobic ammonium oxidizing bacteria. Environ Microbiol 18:2784–2796. doi:10.1111/1462-2920.13134. - DOI - PubMed
    1. Zhang L, Okabe S. 2020. Ecological niche differentiation among anammox bacteria. Water Res 171:115468. doi:10.1016/j.watres.2020.115468. - DOI - PubMed

Publication types

LinkOut - more resources