Meta-Analysis
. 2022 Aug;32(8):5189-5200.
doi: 10.1007/s00330-022-08603-y. Epub 2022 Feb 22.

Diagnostic accuracy of coronary computed tomography angiography for the evaluation of obstructive coronary artery disease in patients referred for transcatheter aortic valve implantation: a systematic review and meta-analysis

Affiliations
Meta-Analysis

Diagnostic accuracy of coronary computed tomography angiography for the evaluation of obstructive coronary artery disease in patients referred for transcatheter aortic valve implantation: a systematic review and meta-analysis

Marco Gatti et al. Eur Radiol. 2022 Aug.

Abstract

Objective: To evaluate the diagnostic accuracy of coronary computed tomography angiography (CCTA) for the evaluation of obstructive coronary artery disease (CAD) in patients referred for transcatheter aortic valve implantation (TAVI).

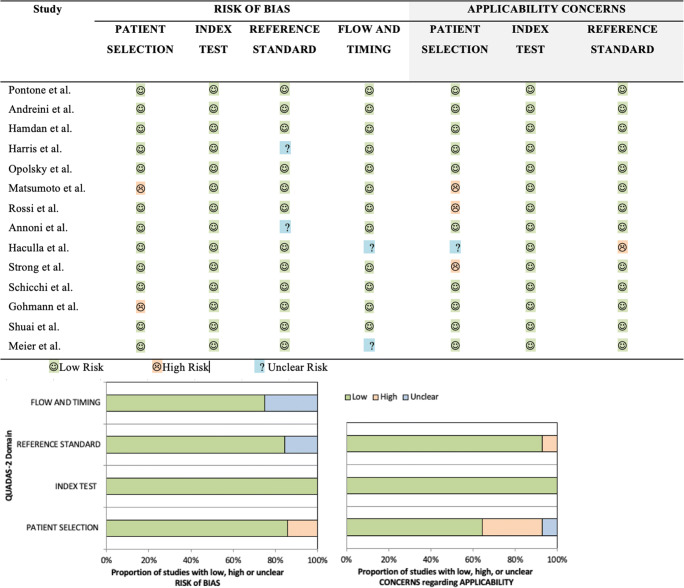
Methods: EMBASE, PubMed/MEDLINE, and CENTRAL were searched for studies reporting accuracy of CCTA for the evaluation of obstructive CAD compared with invasive coronary angiography (ICA) as the reference standard. QUADAS-2 tool was used to assess the risk of bias. A bivariate random effects model was used to analyze, pool, and plot the diagnostic performance measurements across studies. Pooled sensitivity, specificity, positive ( + LR) and negative (-LR) likelihood ratio, diagnostic odds ratio (DOR), and hierarchical summary ROC curve (HSROC) were evaluated. Prospero registration number: CRD42021252527.

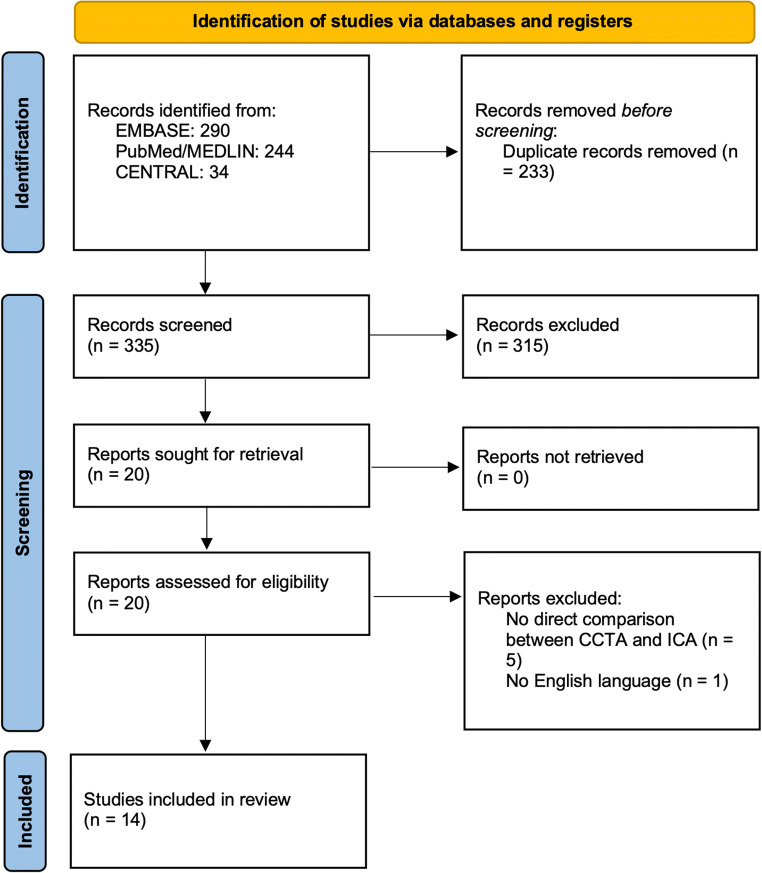
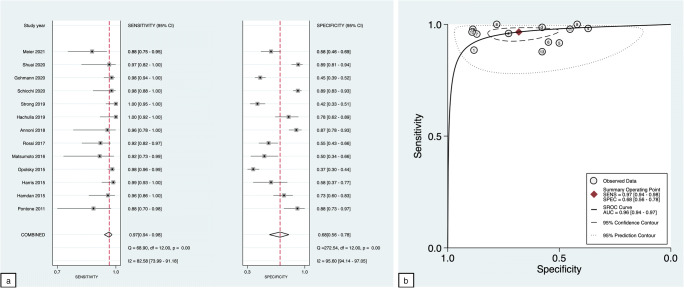
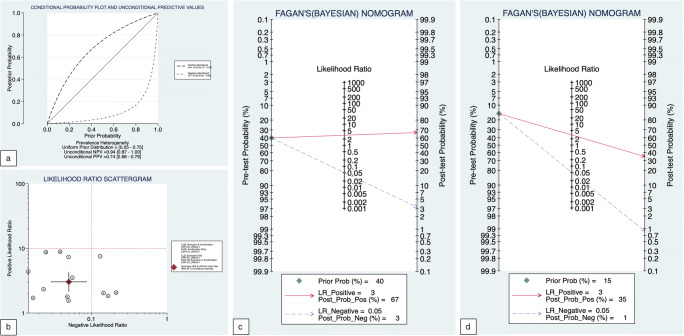
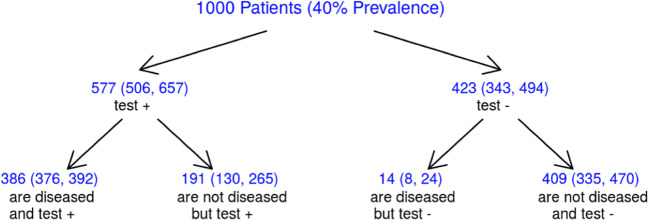
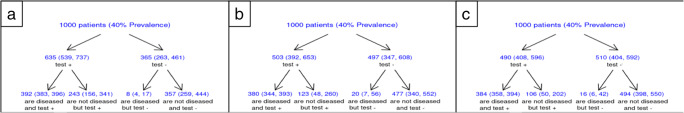
Results: Fourteen studies (2533 patients) were included. In the intention-to-diagnose patient-level analysis, sensitivity and specificity for CCTA were 97% (95% CI: 94-98%) and 68% (95% CI: 56-68%), respectively, and + LR and -LR were 3.0 (95% CI: 2.1-4.3) and 0.05 (95% CI: 0.03 - 0.09), with DOR equal to 60 (95% CI: 30-121). The area under the HSROC curve was 0.96 (95% CI: 0.94-0.98). No significant difference in sensitivity was found between single-heartbeat and other CT scanners (96% (95% CI: 90 - 99%) vs. 97% (95% CI: 94-98%) respectively; p = 0.37), whereas the specificity of single-heartbeat scanners was higher (82% (95% CI: 66-92%) vs. 60% (95% CI: 46 - 72%) respectively; p < 0.0001). Routine CCTA in the pre-TAVI workup could save 41% (95% CI: 34 - 47%) of ICAs if a disease prevalence of 40% is assumed.

Conclusions: CCTA proved an excellent diagnostic accuracy for assessing obstructive CAD in patients referred for TAVI; the use of single-heartbeat CT scanners can further improve these findings.

Key points: • CCTA proved to have an excellent diagnostic accuracy for assessing obstructive CAD in patients referred for TAVI. • Routine CCTA in the pre-TAVI workup could save more than 40% of ICAs. • Single-heartbeat CT scanners had higher specificity than others in the assessment of obstructive CAD in patients referred for TAVI.

Keywords: Aortic valve stenosis; Computed tomography angiography; Coronary artery disease; Transcatheter aortic valve replacement.


Conflict of interest statement

The authors of this manuscript declare no relationships with any companies whose products or services may be related to the subject matter of the article.

Figures

Fig. 1
Fig. 1
Flow diagram
Fig. 2
Fig. 2
Quality assessment of diagnostic accuracy studies 2 (QUADAS-2) tool for risk of bias and applicability concern. Green represents low; yellow, high; and blue, unclear risk. On the top panel, QUADAS-2 was reported for each study and summarized in a bar graph on the bottom panel by stacked bars for each item
Fig. 3
Fig. 3
Summary forest plot is shown as paired plots, with sensitivity and specificity paired (a). HSROC plot at a patient-based level considering positive the nonvaluable segments with confidence and prediction regions around mean operating sensitivity and specificity point (b)
Fig. 4
Fig. 4
a The conditional probability modifying plot is a graphical sensitivity analysis of predictive value along a prevalence continuum designating low-risk to high-risk populations. It shows distinct curves for positive and negative testing. The user draws a vertical line from the chosen pre-test probability to the appropriate likelihood ratio line, then reads the post-test probability from the vertical scale. b The likelihood ratio scattergram represents the summary point of likelihood ratios calculated as functions of mean sensitivity and specificity. The summary point is located in the left lower quadrant: the CCTA has a likelihood ratio positive < 10 and a likelihood ratio negative < 0.1. Based on these considerations, the CCTA in patients referred for TAVI is useful for exclusion of CAD (when negative) rather than confirmation (when positive). c, d Fagan’s nomograms, with estimated pretest probability of 40% and 15%, respectively. A Fagan plot has a vertical axis on the left with the prior log-odds, a vertical axis in the middle with the log-likelihood ratio, and a vertical axis on the right with the posterior log-odds. The lines are then traced from the prior probability on the left to the likelihood ratios in the center, and then to the posterior probabilities on the right. Both plots highlight the strength of the CCTA in excluding the presence of CAD, with residual post-test probabilities of 3% and 1%, respectively
Fig. 5
Fig. 5
CCTA’s estimated impact in 1000 patients referred for TAVI. The numbers in brackets represent 95% confidence intervals
Fig. 6
Fig. 6
Impact of high temporal resolution CT scanners (i.e., dual-source CTs) (a), whole-heart coverage CT scanner (b), and single-heartbeat CT scanner (c) in 1000 patients referred for TAVI. The numbers in brackets represent 95% confidence intervals

References

    1. Baumgartner H, Falk V, Bax JJ, et al. 2017 ESC/EACTS Guidelines for the management of valvular heart disease. Eur Heart J. 2017;38:2739–2791. doi: 10.1093/eurheartj/ehx391. - DOI - PubMed
    1. Knuuti J, Wijns W, Saraste A, et al. 2019 ESC Guidelines for the diagnosis and management of chronic coronary syndromes. Eur Heart J. 2020;41:407–477. doi: 10.1093/eurheartj/ehz425. - DOI - PubMed
    1. van den Boogert TPW, Vendrik J, Claessen BEPM, et al. CTCA for detection of significant coronary artery disease in routine TAVI work-up : a systematic review and meta-analysis. Neth Heart J. 2018;26:591–599. doi: 10.1007/s12471-018-1149-6. - DOI - PMC - PubMed
    1. Chaikriangkrai K, Jhun HY, Shantha GPS, et al. Diagnostic accuracy of coronary computed tomography before aortic valve replacement: systematic review and meta-analysis. J Thorac Imaging. 2018;33:207–216. doi: 10.1097/RTI.0000000000000322. - DOI - PubMed
    1. Andreini D, Mushtaq S, Pontone G, et al. Diagnostic performance of coronary CT angiography carried out with a novel whole-heart coverage high-definition CT scanner in patients with high heart rate. Int J Cardiol. 2018;257:325–331. doi: 10.1016/j.ijcard.2017.10.084. - DOI - PubMed

MeSH terms