. 2022 Apr;167(4):1041-1049.
doi: 10.1007/s00705-022-05392-z. Epub 2022 Feb 22.

Development of an immunofluorescence assay for detection of SARS-CoV-2

Affiliations

Development of an immunofluorescence assay for detection of SARS-CoV-2

Yafit Atiya-Nasagi et al. Arch Virol. 2022 Apr.

Abstract

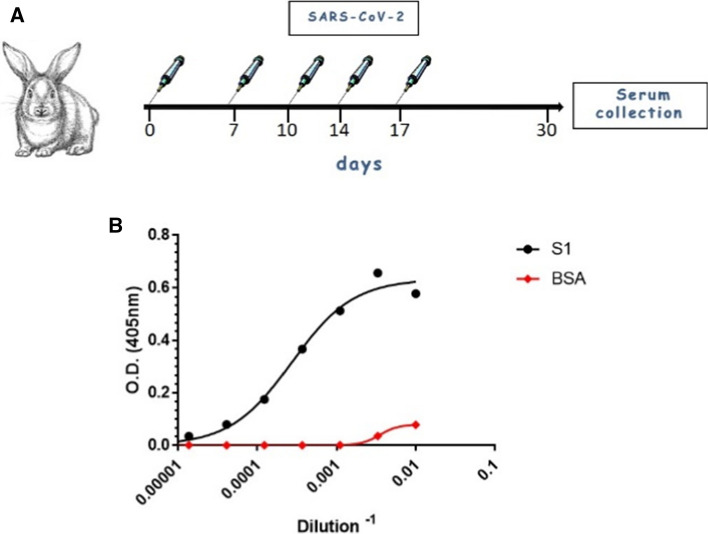
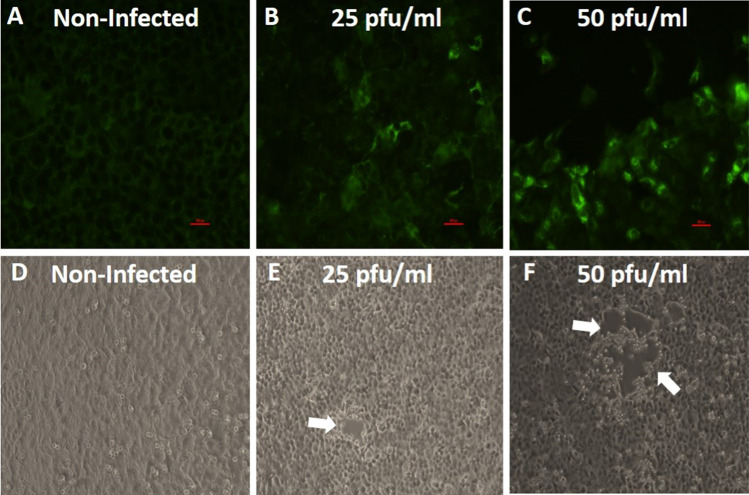
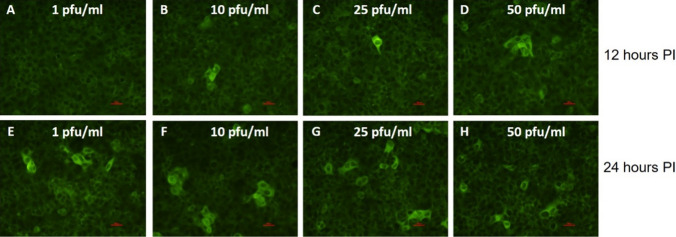
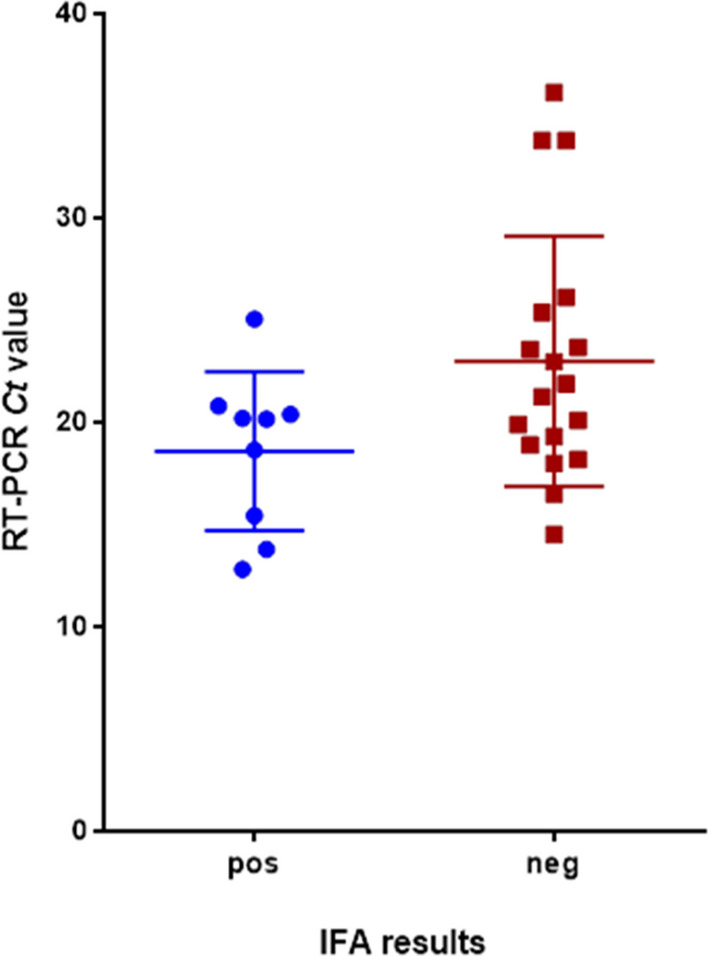
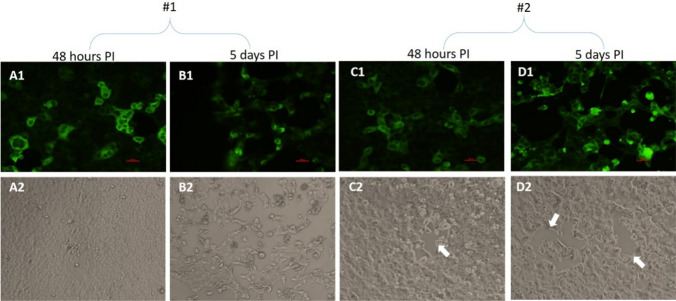
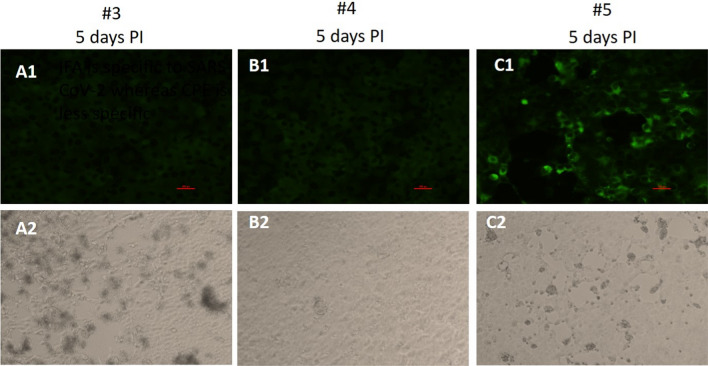
SARS-CoV-2, the etiologic agent of the COVID-19 pandemic, emerged as the cause of a global crisis in 2019. Currently, the main method for identification of SARS-CoV-2 is a reverse transcription (RT)-PCR assay designed to detect viral RNA in oropharyngeal (OP) or nasopharyngeal (NP) samples. While the PCR assay is considered highly specific and sensitive, this method cannot determine the infectivity of the sample, which may assist in evaluation of virus transmissibility from patients and breaking transmission chains. Thus, cell-culture-based approaches such as cytopathic effect (CPE) assays are routinely employed for the identification of infectious viruses in NP/OP samples. Despite their high sensitivity, CPE assays take several days and require additional diagnostic tests in order to verify the identity of the pathogen. We have therefore developed a rapid immunofluorescence assay (IFA) for the specific detection of SARS-CoV-2 in NP/OP samples following cell culture infection. Initially, IFA was carried out on Vero E6 cultures infected with SARS-CoV-2 at defined concentrations, and infection was monitored at different time points. This test was able to yield positive signals in cultures infected with 10 pfu/ml at 12 hours postinfection (PI). Increasing the incubation time to 24 hours reduced the detectable infective dose to 1 pfu/ml. These IFA signals occur before the development of CPE. When compared to the CPE test, IFA has the advantages of specificity, rapid detection, and sensitivity, as demonstrated in this work.


Conflict of interest statement

The authors have no conflicts of interest to declare that are relevant to the content of this article.

Figures

Fig. 1
Fig. 1
(A) Rabbit immunization. Rabbits were inoculated five times intravenously with 106 PFU of live SARS-CoV-2 on days 0, 7, 10, 14, and 17 PI. Serum was collected 14 days after the final dose. (B) Binding curves of IgG polyclonal antibodies from rabbit serum were obtained by ELISA against the S1 subunit of the spike glycoprotein. Points represent the average of duplicates ± SEM
Fig. 2
Fig. 2
(A-C) Vero E6 cells were either mock infected or infected with SARS-CoV-2 at the indicated concentrations for 48 hours and then fixed and immunolabeled with immunized rabbit serum and a secondary goat anti Rb-FITC antibody. (A) Uninfected cells exhibit a low fluorescent background. (B and C) Significant infection of the cells (as indicated by green color) could be seen at concentrations of 25 and 50 pfu/ml at 48 hours PI. (D-F) Vero E6 cells were either mock infected or infected with the indicated concentrations of SARS-CoV-2 and then incubated for 48 hours and monitored for CPE development. Undefined clear areas suggesting the development of CPE (white arrows) were seen when concentrations of 25 and 50 pfu/ml were used for infection. Uninfected cells did not show an observable cytopathic effect. Bar = 100 µm
Fig. 3
Fig. 3
Detection of SARS-CoV-2 in Vero E6 cells using an indirect immunofluorescence assay. (A-H) Vero E6 cells were seeded in 8-well LabTek chambers and incubated for 24 hours at 37 °C to allow cell adhesion. Cells were infected with SARS-CoV-2 at concentrations of 1-50 pfu/ml for 12 hours (A-D) or 24 hours (E-H) and then fixed and immunolabeled with 1:100-diluted SARS-CoV-2-immunized rabbit serum, followed by the addition of FITC-conjugated anti-rabbit IgG (green color). Bar = 100 µm
Fig. 4
Fig. 4
Correlation between RT real-time PCR of SARS-CoV-2 (Ct value) and IFA results. Forty-four NO/NP clinical specimens were tested by RT real-time PCR for SARS-CoV-2 RNA and for infectious virus using the newly developed IFA. As shown, samples with Ct > 26 were negative in the IFA. No strict correlation was observed with samples with Ct < 18
Fig. 5
Fig. 5
Vero E6 cells were infected with two confirmed SARS-CoV-2-positive NP/OP samples (#1 and #2) for 48 hours or five days and then processed for IFA (panels A1-D1) and CPE assays (panels A2-D2). (A1-D1) Representative IFA images showing prominent infection of the cells (green color). (A2 and B2) Representative light microscopy images showing no visible CPE at 48 hours PI for sample #1. At five days PI, CPE was clearly observed. (C2 and D2) The CPE was less definitive in the case of sample #2. Some clear areas in the cell cultures were observed, possibly representing the onset of CPE (white arrows)
Fig. 6
Fig. 6
Vero E6 cells were infected for five days with three confirmed SARS-CoV-2-positive NP/OP samples (#3, #4, #5) and then processed for IFA (panels A1-C1) and CPE assays (panels A2-C2). (A1-C1) Representative IFA images showing no infection with samples #3 and #4 or prominent infection of the cells in the case of sample #5 (green color). (A2) Representative light microscope images showing nonspecific CPE in the case of sample #3. (B2) In agreement with the IFA results, no CPE was seen in the case of sample #4. (C2) The onset of CPE was observed in the cell cultures after infection with sample #5. The CPE observed is in agreement with the IFA results obtained with this specific sample

Similar articles

References

    1. Walls AC, et al. Structure, function, and antigenicity of the SARS-CoV-2 spike glycoprotein. Cell. 2020;181(2):281–292.e6. doi: 10.1016/j.cell.2020.02.058. - DOI - PMC - PubMed
    1. Wang Z, et al. Transmission and prevention of SARS-CoV-2. Biochem Soc Trans. 2020;48(5):2307–2316. doi: 10.1042/BST20200693. - DOI - PubMed
    1. Chan JF et al (2020) Improved molecular diagnosis of COVID-19 by the novel, highly sensitive and specific COVID-19-RdRp/Hel real-time reverse transcription-PCR assay validated in vitro and with clinical specimens. J Clin Microbiol 58(5) - PMC - PubMed
    1. Berg MG, et al. Development of the RealTime SARS-CoV-2 quantitative Laboratory Developed Test and correlation with viral culture as a measure of infectivity. J Clin Virol. 2021;143:104945. doi: 10.1016/j.jcv.2021.104945. - DOI - PMC - PubMed
    1. Rhoads D, et al. College of American Pathologists (CAP) Microbiology Committee Perspective: caution must be used in interpreting the cycle threshold (Ct) value. Clin Infect Dis. 2021;72(10):e685–e686. doi: 10.1093/cid/ciaa1199. - DOI - PubMed