Clinical Trial
. 2022 Apr 8;7(7):e157031.
doi: 10.1172/jci.insight.157031.

Durability of ChAdOx1 nCoV-19 vaccination in people living with HIV

Affiliations
Clinical Trial

Durability of ChAdOx1 nCoV-19 vaccination in people living with HIV

Ane Ogbe et al. JCI Insight. .

Abstract

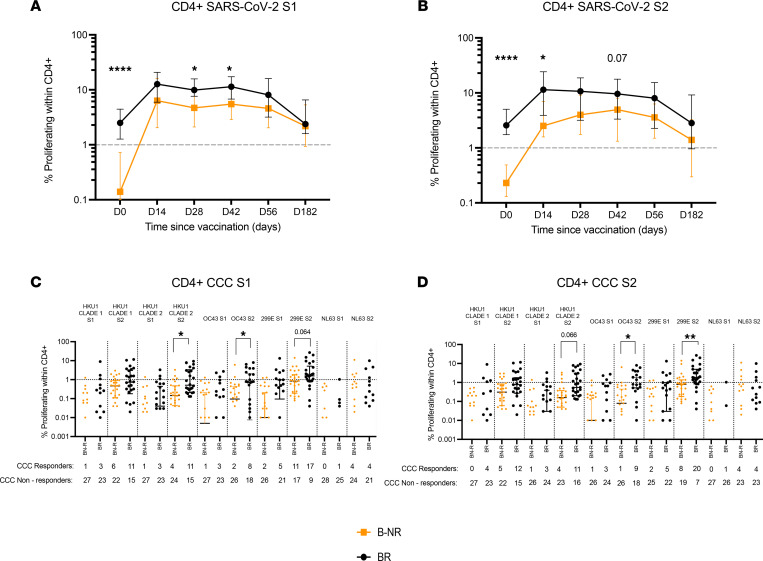
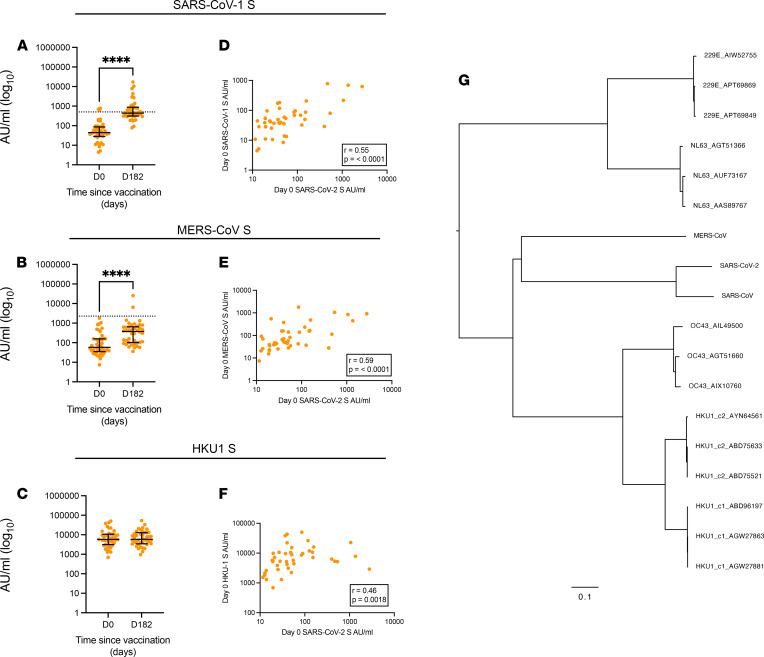
Duration of protection from SARS-CoV-2 infection in people living with HIV (PWH) following vaccination is unclear. In a substudy of the phase II/III the COV002 trial (NCT04400838), 54 HIV+ male participants on antiretroviral therapy (undetectable viral loads, CD4+ T cells > 350 cells/μL) received 2 doses of ChAdOx1 nCoV-19 (AZD1222) 4-6 weeks apart and were followed for 6 months. Responses to vaccination were determined by serology (IgG ELISA and Meso Scale Discovery [MSD]), neutralization, ACE-2 inhibition, IFN-γ ELISpot, activation-induced marker (AIM) assay and T cell proliferation. We show that, 6 months after vaccination, the majority of measurable immune responses were greater than prevaccination baseline but with evidence of a decline in both humoral and cell-mediated immunity. There was, however, no significant difference compared with a cohort of HIV-uninfected individuals vaccinated with the same regimen. Responses to the variants of concern were detectable, although they were lower than WT. Preexisting cross-reactive T cell responses to SARS-CoV-2 spike were associated with greater postvaccine immunity and correlated with prior exposure to beta coronaviruses. These data support the ongoing policy to vaccinate PWH against SARS-CoV-2, and they underpin the need for long-term monitoring of responses after vaccination.

Keywords: AIDS/HIV; Adaptive immunity; COVID-19; Cellular immune response; T cells.


Figures

Figure 1
Figure 1. PWH show higher baseline immune activation and exhaustion.
(A) Schematic showing vaccination schedule for ChAdOx1 nCoV-19 in PWH. (BG) Frequency of (B) CD38+ HLA-DR+, (C) PD1+, and (D) TbetloEomeshi cells within CD4+ and (E) CD38+ HLA-DR+, (F) PD1+, and (G) TbetloEomeshi cells within CD8+ T cells. Comparison of 2 groups by 2-tailed Mann-Whitney U test. *P ≤ 0.05, ***P ≤ 0.001, and ****P ≤ 0.0001. n = 48–54 for HIV+ volunteers and 10 for HIV control proliferation assay. Data are shown as median ± IQR.
Figure 2
Figure 2. Antibody levels against SARS-CoV-2 six months after ChAdOx1 nCoV-19 vaccination.
(AC) IgG levels for SARS-CoV-2 (A) spike, (B) RBD, and (C) N protein measured at day 0 (baseline) and day 182 (6 months after vaccination) using the MSD ELISA assays. (D) Comparison between antibody kinetics in HIV+ and HIV across all available time points. (E and F) ACE-2 inhibition assay at baseline and 6 months after vaccination and live-virus focus reduction neutralization assay (FRNT) on n = 15 HIV+ donors on days 0, 28, 56 and 182. Comparison of 2 time points within the same group was done by Wilcoxon matched-pairs signed-rank test. Comparison of 2 groups was done by Mann-Whitney U test with Bonferroni-Dunn’s multiple-comparison test (Prism v9. B shows adjusted significant levels. **P ≤ 0.01 and ****P ≤ 0.000. Dotted lines in AC indicate cut-off points determined for each SARS-CoV-2 antigen (S, RBD, and N) based on prepandemic sera + 3 SD. n = 42–54 for HIV+ volunteers in MSD assay, in-house ELISA, and ACE-2 inhibition assay; 14–15 in FRNT assays; and 54 for HIV controls. Data are shown as median ± IQR.
Figure 3
Figure 3. T cell responses following ChAdOx1 nCoV-19 vaccination are durable in PWH.
(A) T cell response measured using peptides pools against SARS-CoV-2 S1 and S2 antigens by IFN-γ ELISpot across all time points. (B) Comparative analysis of IFN-γ T cell responses in HIV+ and HIV volunteers. (C and D) Proliferative T cell responses to (C) SARS-CoV-2 S1 and (D) SARS-CoV-2 S2 in CD4+ T cells across all available time points. (E and F) Proliferative T cell responses to (E) SARS-CoV-2 S1 and (F) SARS-CoV-2 S2 in CD8+ T cells across all available time points. Comparison of 2 time points within the same group was done by Wilcoxon matched-pairs signed-rank test. Comparison of 2 groups was done by 2-tailed Mann-Whitney U test or multiple Mann-Whitney U test (B) with Bonferroni-Dunn’s multiple-comparison test (Prism v9). *P ≤ 0.05, **P ≤ 0.01, ***P ≤ 0.001, and ****P ≤ 0.000. Dotted lines in CF indicate threshold for true positive based mean of DMSO controls + 3 SD. n = 48–54 for HIV+ volunteers and 54 for HIV controls. Data are shown as median ± IQR.
Figure 4
Figure 4. SARS-CoV-2–specific T cells are not preferentially biased for any CD4+ T cell subsets.
(AD) Ex vivo frequencies of (A) CXCR3+CCR6 (Th1), (B) CXCR3CCR6 (Th2), (C) CXCR3CCR6+ (Th17), and (D) CXCR5+ within CD4+ T cells in HIV+ volunteers measured at days 0, 42, and 182 using ex vivo T cell phenotyping. (E) Comparative analysis of frequencies of ex vivo CD4+ T cell frequencies in HIV+ and HIV volunteers at day 182 (6 months after vaccination). (F and G) Measurement of frequencies of antigen-specific T cells including SARS-CoV-2 S1 and S2, HIV gag, and CMVpp65 using activation-induced marker (AIM) assay in (F) CD4+ and (G) CD8+ T cells. Using ‘or’ Boolean gating on FlowJo, antigen specific CD4+ T cells were: CD25+CD134(OX40)+, CD25+CD137+, or CD25+CD69+; for CD8+ T cells, antigen specific cells were: CD25+CD137+ or CD25+CD69+. (HK) Frequencies of (H) CXCR3+ CCR6 (Th1), (I) CXCR3CCR6 (Th2), (J) CXCR3CCR6+ (Th17), and (K) CXCR5+ CD4+ T cells within antigen-specific (AIM+) T cells in HIV+ volunteers. Comparison of 2 time points within the same group was done by Wilcoxon matched-pairs signed-rank test. Comparison of 2 groups was done by 2-tailed Mann-Whitney U test. *P ≤ 0.05, **P ≤ 0.01, ***P ≤ 0.001, and ****P ≤ 0.000. n = 48 – 54 for HIV+ volunteers in ex vivo phenotyping assay, 20 for HIV+ volunteers in AIM assay, and 10 for HIV control in ex vivo phenotyping assay. Data are shown as median ± IQR.
Figure 5
Figure 5. Responses to VOCs are preserved at 6 months after ChAdOx1 nCoV-19 vaccination in PWH.
(A) ACE-2 binding inhibition assay for Alpha, Beta, and Gamma VOCs measured at day 0 (baseline) and at day 182 (6 months after vaccination) in HIV+ volunteers. (B) Comparison between ACE-2 binding inhibition of SARS-CoV-2 WT strain and Alpha, Beta, and Gamma VOCs in HIV+ volunteers. (CF) Comparison between proliferative T cell responses to SARS-CoV-2 WT strain and Beta, Gamma, and Delta VOCs in (C) CD4+ S1, (D) CD4+ S2, (E) CD8+ S1, and (F) CD8+ S2 in HIV+ volunteers. (GJ) Comparative analysis of (G) CD4+ S1, (H) CD4+ S2, (I) CD8+ S1, and (J) CD8+ S2 T cells responses to VOCs in HIV+ (solid circles) and HIV (open circles). Comparison of 2 time points within the same group was done by Wilcoxon matched-pairs signed-rank test. Comparison of 2 groups was done by 2-tailed Mann-Whitney U test. Where indicated *P ≤ 0.05 and ****P ≤ 0.000. Dotted lines in CJ indicate threshold for true positive based mean of DMSO controls + 3 SD. n = 48–54 for ACE-2 inhibition assay in HIV+ volunteers, 20 for HIV+ VOC proliferative responses, and 10 for HIV control VOC responses in proliferation assay. Data are shown as median ± IQR.
Figure 6
Figure 6. Preexisting cross-reactive CD4+ T cell responses in PWH measured at baseline are associated with high-magnitude T cell responses after ChAdOx1 nCoV-19 vaccination.
(A and B) Baseline CD4+ SARS-CoV-2 responses were split into baseline responders (BR, proliferation > 1%, black circles and black lines) and baseline nonresponders (B-NR, proliferation < 1%, yellow circles and yellow lines), and CD4+ T cell responses after vaccination were analyzed at all available time points for (A) SARS-CoV-2 S1 and (B) SARS-CoV-2 S2. (C and D) T cells responses targeting (C) S1 and (D) S2 proteins in endemic CCCs are measured at baseline in BR and B-NR. Comparison of 2 time points within the same group was done by Wilcoxon matched-pairs signed-rank test. Comparison of 2 groups was done by 2-tailed Mann-Whitney U test with Bonferroni-Dunn’s multiple-comparison test (Prism v9). A and B show adjusted significant levels. CCC responses among participants were compared using Fisher’s exact test and listed in Supplemental Table 3. P values as indicated or *P ≤ 0.05, **P ≤ 0.01, and ****P ≤ 0.000. Dotted lines indicate threshold for true positive based mean of DMSO controls + 3 SD. n = 48–54 for HIV+ volunteers. Data are shown as median ± IQR.
Figure 7
Figure 7. Cross-reactive humoral immune responses among Beta CoVs.
(AC) Antibody titres against (A) SARS-CoV, (B) MERS-CoV, and (C) HKU1 spike proteins measured at day 0 (baseline) and day 182 (6 months after vaccination) in HIV+ participants. (DF) Correlation between baseline antibody titres for SARS-CoV-2 and (D) SARS-CoV-1, (E) MERS-CoV, and (F) HKU1 spike protein at baseline. (G) Phylogenetic tree showing relationship between coronaviruses. Correlation was performed via Spearman’s rank correlation coefficient, and comparison of 2 time points within the same group was done by Wilcoxon matched-pairs signed-rank test. ****P ≤ 0.0001. Dotted lines in A and B indicate cut-off points determined for each SARS-CoV-2 antigen based on prepandemic sera + 3 SD. n = 48–54 for HIV+ volunteers. Data are shown as median ± IQR.

References

    1. WHO. WHO Coronavirus (COVID-19) Dashboard. https://covid19.who.int/ Updated September 17, 2021. Accessed September 17, 2021.
    1. Mellor MM, et al. Risk of adverse coronavirus disease 2019 outcomes for people living with HIV. AIDS. 2021;35(4):1–F10. - PMC - PubMed
    1. Sheth AN, et al. Influenza susceptibility, severity, and shedding in HIV-infected adults: a review of the literature. Clin Infect Dis. 2011;52(2):219–227. doi: 10.1093/cid/ciq110. - DOI - PMC - PubMed
    1. Abadom TR, et al. Risk factors associated with hospitalization for influenza-associated severe acute respiratory illness in South Africa: A case-population study. Vaccine. 2016;34(46):5649–5655. doi: 10.1016/j.vaccine.2016.09.011. - DOI - PMC - PubMed
    1. Tesoriero JM, et al. COVID-19 outcomes among persons living with or without diagnosed HIV infection in New York State. JAMA Netw Open. 2021;4(2):e2037069. doi: 10.1001/jamanetworkopen.2020.37069. - DOI - PMC - PubMed

Publication types

Substances

Associated data