. 2022 Apr 1;132(7):e148667.
doi: 10.1172/JCI148667.

Stromal oncostatin M cytokine promotes breast cancer progression by reprogramming the tumor microenvironment

Affiliations

Stromal oncostatin M cytokine promotes breast cancer progression by reprogramming the tumor microenvironment

Angela M Araujo et al. J Clin Invest. .

Erratum in

  • Stromal oncostatin M cytokine promotes breast cancer progression by reprogramming the tumor microenvironment.
    Araujo AM, Abaurrea A, Azcoaga P, López-Velazco JI, Manzano S, Rodriguez J, Rezola R, Egia-Mendikute L, Valdés-Mora F, Flores JM, Jenkins L, Pulido L, Osorio-Querejeta I, Fernández-Nogueira P, Ferrari N, Viera C, Martín-Martín N, Tzankov A, Eppenberger-Castori S, Alvarez-Lopez I, Urruticoechea A, Bragado P, Coleman N, Palazón A, Carracedo A, Gallego-Ortega D, Calvo F, Isacke CM, Caffarel MM, Lawrie CH. Araujo AM, et al. J Clin Invest. 2022 Oct 3;132(19):e165107. doi: 10.1172/JCI165107. J Clin Invest. 2022. PMID: 36169029 Free PMC article. No abstract available.

Abstract

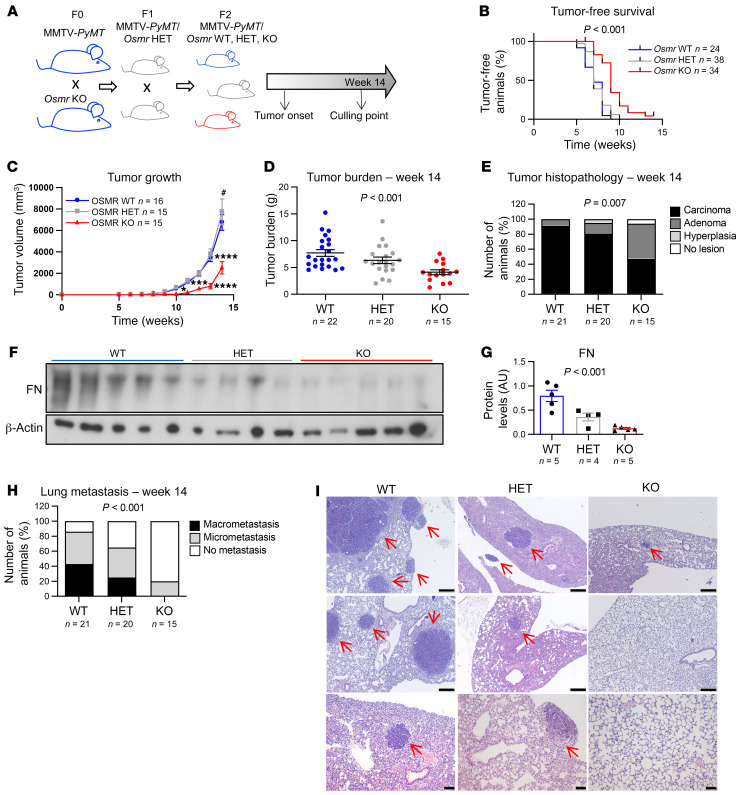
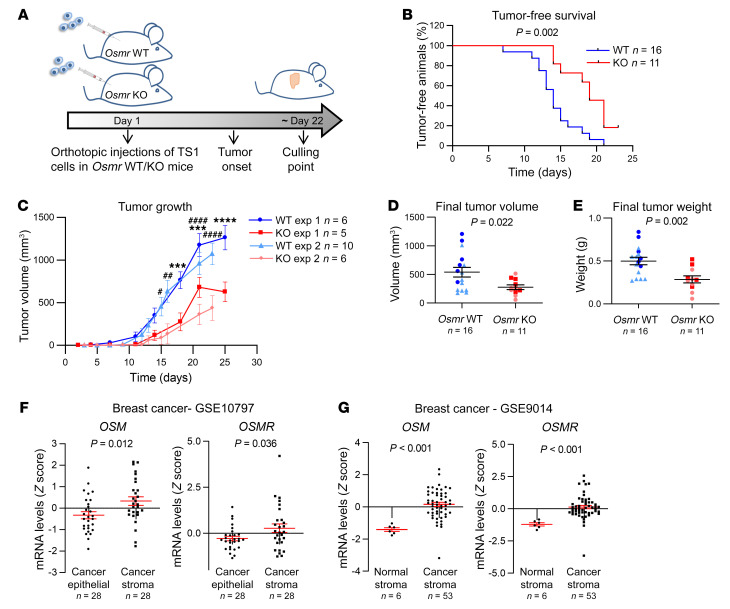
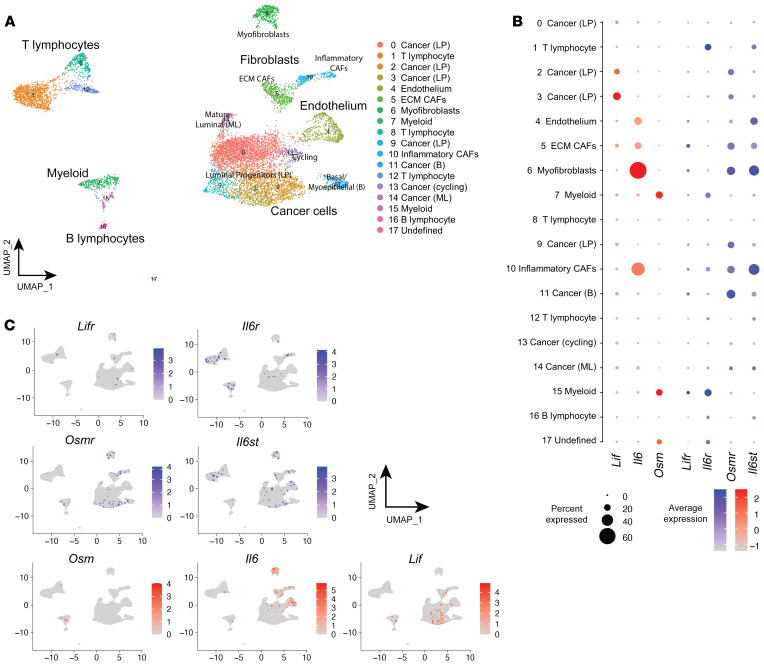
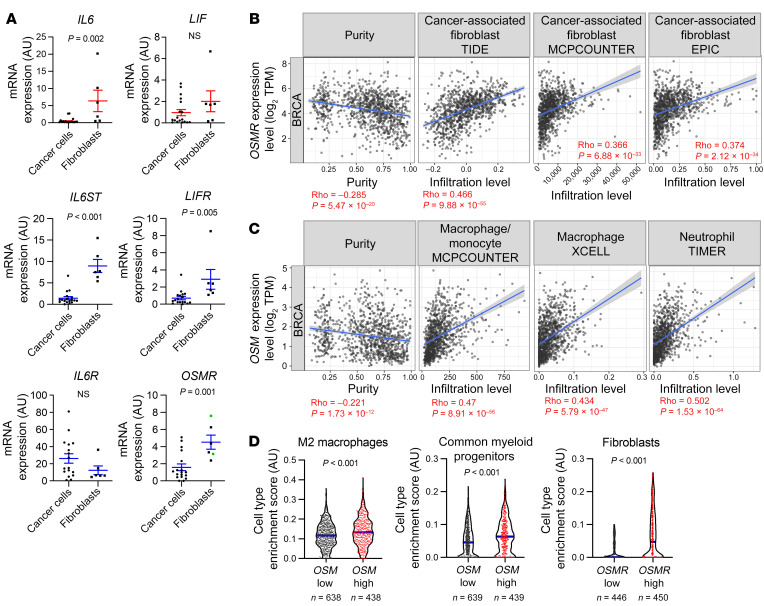
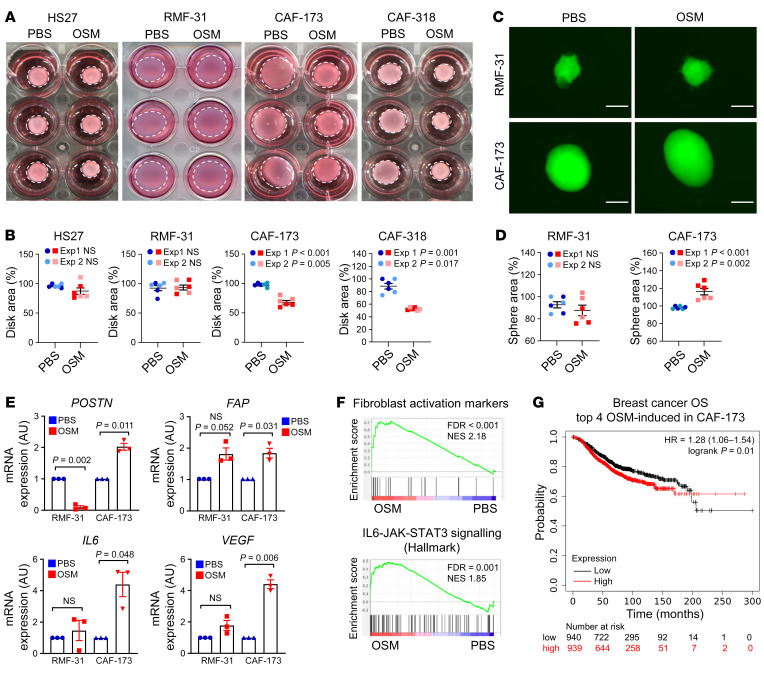
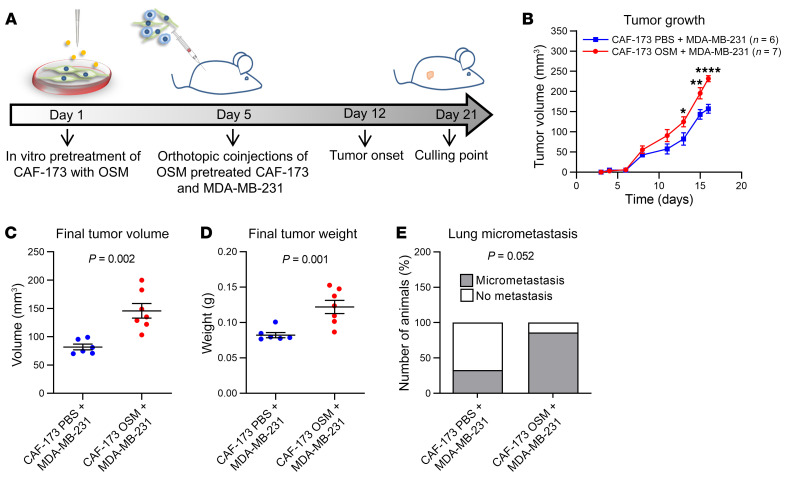
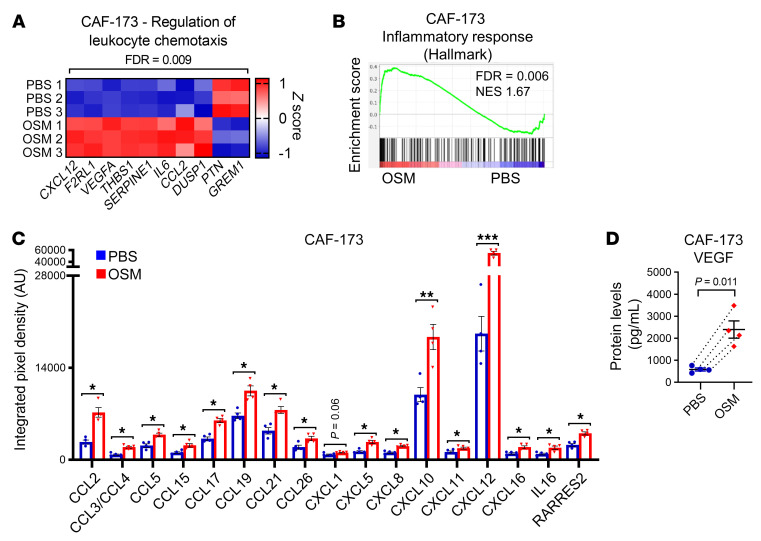
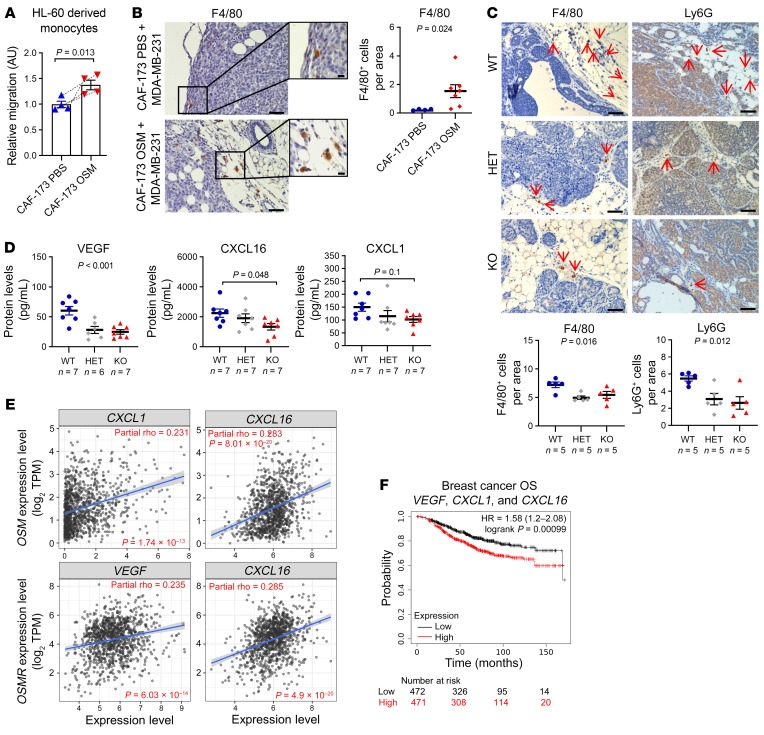
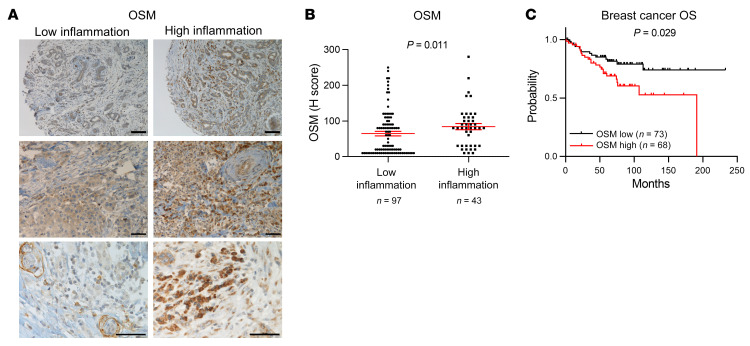
The tumor microenvironment (TME) is reprogrammed by cancer cells and participates in all stages of tumor progression. The contribution of stromal cells to the reprogramming of the TME is not well understood. Here, we provide evidence of the role of the cytokine oncostatin M (OSM) as central node for multicellular interactions between immune and nonimmune stromal cells and the epithelial cancer cell compartment. OSM receptor (OSMR) deletion in a multistage breast cancer model halted tumor progression. We ascribed causality to the stromal function of the OSM axis by demonstrating reduced tumor burden of syngeneic tumors implanted in mice lacking OSMR. Single-cell and bioinformatic analysis of murine and human breast tumors revealed that OSM expression was restricted to myeloid cells, whereas OSMR was detected predominantly in fibroblasts and, to a lower extent, cancer cells. Myeloid-derived OSM reprogrammed fibroblasts to a more contractile and tumorigenic phenotype and elicited the secretion of VEGF and proinflammatory chemokines CXCL1 and CXCL16, leading to increased myeloid cell recruitment. Collectively, our data support the notion that the stromal OSM/OSMR axis reprograms the immune and nonimmune microenvironment and plays a key role in breast cancer progression.

Keywords: Breast cancer; Chemokines; Cytokines; Inflammation; Oncology.


Figures

Figure 1
Figure 1. Deletion of OSMR in the MMTV-PyMT model hampers tumor progression and reduces metastasis.
(A) Experimental set-up of the in vivo experiment designed to assess the importance of OSMR signaling in disease progression of the MMTV-PyMT mouse model. F0, F1, and F2 are different filial generations. (BD) Kaplan-Meier curves for tumor-free survival (B), tumor growth (C), and final tumor burden (D) in MMTV-PyMT Osmr-WT, MMTV-PyMT Osmr-HET (heterozygous), and MMTV-PyMT Osmr-KO mice. (E) Histopathological analysis of tumors at week 14. Graph represents percentage of mice bearing carcinomas, adenomas, hyperplasia, and no lesions in mammary glands. P value was determined by comparing the number of mice with malignant carcinoma versus nonmalignant phenotypes (adenoma, hyperplasia) and no lesions using the χ2 test. (F and G) Western blot (F) and densitometric analysis (G) of fibronectin (FN) protein levels in tumors at week 14 from animals of the different genotypes. (H) Percentage of animals with lung metastases at 14 weeks of age. P value was determined by comparing animals with metastasis (macro and micro) versus without metastasis using the χ2 test. (I) Representative pictures of lung metastases at week 14 in MMTV-PyMT Osmr-WT, -HET, and -KO animals. Metastatic nodules are indicated with red arrows. Scale bars: 200 μm (top and middle rows) and 50 μm (bottom row). P values were calculated using the Mantel-Cox test (B), 2-way ANOVA with post hoc Dunnett’s multiple-comparison test (C), or 1-way ANOVA test (D and G). *P < 0.01; ***P < 0.001; ****P < 0.0001 KO vs. WT and #P < 0.05 HET vs. WT.
Figure 2
Figure 2. The stromal OSM/OSMR axis promotes breast cancer progression.
(A) Experimental setup of the in vivo experiment designed to assess the importance of OSMR signaling in the tumor microenvironment, in which TS1 cells were orthotopically injected into the mammary fat pad of Osmr-WT and -KO mice. (BE) Kaplan-Meier curves for tumor-free survival (B), tumor growth (C), and final tumor volume (D) and weight (E) after dissection of orthotopic tumors described in A. Two independent experiments were performed, and the results were combined in B, D, and E. (F and G) OSM and OSMR mRNA expression in paired cancer epithelial versus cancer stroma (F, GSE10797) and normal stroma versus cancer stroma breast cancer samples (G, GSE9014). Data were downloaded from NCBI GEO data sets. P values were calculated using the Mantel-Cox test (B), 2-way ANOVA with post hoc Sidak’s multiple-comparison test (C), or unpaired, 2-tailed Student’s t test (DG). ***P < 0.001, ****P < 0.0001 for experiment 1 and #P < 0.05, ##P < 0.01,####P < 0.001 for experiment 2.
Figure 3
Figure 3. The OSM/OSMR signaling module exhibits a distinct microenvironment-restricted expression.
(A) UMAP plot showing cell clusters defined in each of the main cell lineages. Column legend depicts the main cell lineage of origin for each cluster, showing 7 clusters of epithelial origin, 6 immune, and 4 stromal. LP, luminal progenitors; ECM, extracellular matrix; CAF, cancer-associated fibroblast; B, basal; ML, mature luminal. (B) Dot plot representing the expression level (red or blue jet) and the number of expressing cells (dot size) of the indicated genes in each cluster. (C) Feature UMAP plots showing the expression of the indicated genes in each of the main cell clusters.
Figure 4
Figure 4. OSM and OSMR expression in human breast cancer microenvironment.
(A) mRNA expression levels of the indicated IL-6 family members and associated receptors analyzed by RT-qPCR in a panel of breast cancer cell lines (n = 18) and immortalized fibroblasts (n = 6). In the OSMR graph, green and dark dots represent normal mammary fibroblasts and CAFs, respectively. P values were determined using the unpaired, 2-tailed Student’s t test. (B and C) Correlation of OSMR (B) and OSM (C) expression with tumor purity and infiltration level of indicated cell types in breast cancer samples. Data were downloaded from the TIMER web platform (n = 1,100). Spearman’s correlation coefficients and P values are shown. TPM, transcript count per million reads. (D) Truncated violin plots showing cell type enrichment of the indicated populations in breast tumors according to high (top quartile) or low (lowest quartile) OSM or OSMR expression. Data were obtained using the xCell web resource on 1,809 breast cancer samples from the Kaplan-Meier Plotter website. P values were determined using Mann-Whitney test.
Figure 5
Figure 5. OSM activates cancer-associated fibroblasts (CAFs) in vitro, promoting their contractility and proliferation.
(A and B) Representative pictures of collagen contraction assays (A) and quantification of collagen disk areas (B) of fibroblasts pretreated in monolayer with PBS or OSM. (C and D) Representative pictures (C) and area quantification (D) of 3D sphere proliferation assays of fibroblasts treated with PBS or OSM. Scale bars: 200 μm. In B and D, 2 independent experiments are plotted (experiments 1 and 2) and P values were calculated using the unpaired, 2-tailed Student’s t test. (E) RT-qPCR analysis of mRNA levels of activation markers in normal fibroblasts (RMF-31) and CAFs (CAF-173) cultured in 3D with PBS or OSM. n = 3 independent experiments. P values were determined using paired, 2-tailed Student’s t tests. (F) Gene set enrichment analysis (GSEA) showing enrichment of the indicated signatures in microarray data of CAF-173 treated with OSM. Data for the fibroblast activation signature were derived from Sahai et al. (4). NES, normalized enrichment score. (G) Kaplan-Meier curves showing overall survival (OS) for breast cancer patients according to the high or low expression in tumor samples of top 4 genes induced by OSM in CAF-173. Data were obtained using the Kaplan-Meier Plotter website. P value was calculated using the Mantel-Cox test and high and low expression levels were stratified by median values.
Figure 6
Figure 6. OSM activates cancer-associated fibroblasts (CAFs) in vivo, promoting tumor progression.
(A) Experimental setup of the in vivo experiment designed to assess the contribution of OSMR activation in fibroblasts to cancer progression. CAF-173 were pretreated with OSM or PBS for 4 days prior to injection and were coinjected with MDA-MB-231 (500,000 cells per cell line) in matrigel (1:1 ratio) in the mammary gland fat pad of nude mice. n = 6 animals with MDA-MB-231 and PBS-treated CAF-173 cells injected, and n = 7 animals with MDA-MB-231 and OSM-treated CAF-173 cells injected. (BD) Tumor growth (B) and final tumor volume (C) and weight (D) after dissection of orthotopic tumors described in A. (E) Percentage of animals described in A with lung micrometastasis assessed using qPCR analysis of genomic human Alu sequences. Graph represents the percentage of animals with detectable qPCR signal. P values were calculated using 2-way ANOVA with post hoc Sidak’s multiple-comparison test (B), unpaired, 2-tailed Student’s t test (C and D), or χ2 test (E). *P < 0.05; **P < 0.01; ****P < 0.0001.
Figure 7
Figure 7. OSM/OSMR signaling in cancer-associated fibroblasts (CAFs) induces cytokine secretion.
(A) Heatmap showing normalized mRNA expression of genes induced by OSM in CAF-173 and included in the indicated Gene Ontology (GO) pathway. (B) Gene set enrichment analysis (GSEA) showing enrichment of inflammatory hallmark signature in microarray expression data of CAF-173 spheres treated with 30 ng/mL OSM for 4 days. NES, normalized enrichment score. (C and D) Chemokine array analysis (C) and VEGF levels (D) in conditioned media from CAF-173 treated with PBS or 30 ng/mL OSM for 72 hours. *P < 0.05, **P < 0.01, ***P < 0.001. P values were determined using paired, 2-tailed Student’s t tests; n = 4 independent experiments.
Figure 8
Figure 8. OSM/OSMR signaling induces myeloid recruitment.
(A) Effect of conditioned media from CAF-173 treated with PBS (control) or 10 ng/mL OSM for 72 hours on HL-60–derived monocyte migration, n = 4 independent experiments. (B) Representative pictures and quantification of F4/80 immunohistochemical staining in tumors derived from MDA-MB-231/CAF-173 coinjections described in Figure 6A. Quantification was performed by manual counting of positive cells per area in a total of 12 to 19 pictures per tumor and 4 to 7 tumors per group. Scale bars: 100 μm (large pictures) and 10 μm (insets). (C) Representative pictures and quantification of F4/80 and Ly6G immunohistochemical staining in tumors from MMTV-PyMT Osmr-WT, -HET, and -KO mice at 14 weeks of age, described in Figure 1A. Quantification was performed by manual counting of positive cells per area in a total of 8 pictures per tumor and 5 tumors per group. Scale bars: 50 μm. (D) VEGF, CXCL1, and CXCL16 levels in plasma from MMTV-PyMT Osmr-WT, -HET, and -KO mice at 14 weeks of age analyzed by Luminex assay. In AD, P values between the different groups were determined using paired (A) or unpaired (B) 2-tailed Student’s t test, 1-way ANOVA (C), or 1-way ANOVA with post hoc Dunnett’s multiple-comparison test (D). (E) Correlation of OSM and OSMR levels with VEGF, CXCL1, and CXCL16 expression in breast cancer samples. Data were downloaded from the TIMER web platform (n = 1,100). Spearman’s correlation coefficients and P values are shown. TPM, transcript count per million reads. (F) Kaplan-Meier curves showing overall survival (OS) for breast cancer samples according to the expression of VEGF, CXCL1, and CXCL16. Data were downloaded from Kaplan-Meier Plotter. P value was determined using the Mantel-Cox test and high and low expression levels were stratified by median value.
Figure 9
Figure 9. OSM expression associates with increased inflammation and decreased overall survival in human breast cancer samples.
(A and B) Representative pictures (A) and quantification (B) of OSM immunohistochemical staining in samples from breast cancer patients with high and low inflammation. Scale bars: 100 μm (top row) and 50 μm (middle and bottom rows). P value was determined using Mann-Whitney test. (C) Kaplan-Meier curves showing overall survival (OS) for breast cancer patients analyzed in A and B, with high versus low OSM expression. P value was determined using the Mantel-Cox test and high and low expression levels were stratified by median value.

References

    1. Quail DF, Joyce JA. Microenvironmental regulation of tumor progression and metastasis. Nat Med. 2013;19(11):1423–1437. doi: 10.1038/nm.3394. - DOI - PMC - PubMed
    1. Hanahan D, Weinberg RA. Hallmarks of cancer: the next generation. Cell. 2011;144(5):646–674. doi: 10.1016/j.cell.2011.02.013. - DOI - PubMed
    1. Kalluri R. The biology and function of fibroblasts in cancer. Nat Rev Cancer. 2016;16(9):582–598. doi: 10.1038/nrc.2016.73. - DOI - PubMed
    1. Sahai E, et al. A framework for advancing our understanding of cancer-associated fibroblasts. Nat Rev Cancer. 2020;20(3):174–186. doi: 10.1038/s41568-019-0238-1. - DOI - PMC - PubMed
    1. Taniguchi K, Karin M. IL-6 and related cytokines as the critical lynchpins between inflammation and cancer. Semin Immunol. 2014;26(1):54–74. doi: 10.1016/j.smim.2014.01.001. - DOI - PubMed

Publication types

LinkOut - more resources