. 2022 Apr 1;132(7):e153920.
doi: 10.1172/JCI153920.

Sepsis promotes splenic production of a protective platelet pool with high CD40 ligand expression

Affiliations

Sepsis promotes splenic production of a protective platelet pool with high CD40 ligand expression

Colin Valet et al. J Clin Invest. .

Abstract

Platelets have a wide range of functions including critical roles in hemostasis, thrombosis, and immunity. We hypothesized that during acute inflammation, such as in life-threatening sepsis, there are fundamental changes in the sites of platelet production and phenotypes of resultant platelets. Here, we showed during sepsis that the spleen was a major site of megakaryopoiesis and platelet production. Sepsis provoked an adrenergic-dependent mobilization of megakaryocyte-erythrocyte progenitors (MEPs) from the bone marrow to the spleen, where IL-3 induced their differentiation into megakaryocytes (MKs). In the spleen, immune-skewed MKs produced a CD40 ligandhi platelet population with potent immunomodulatory functions. Transfusions of post-sepsis platelets enriched from splenic production enhanced immune responses and reduced overall mortality in sepsis-challenged animals. These findings identify a spleen-derived protective platelet population that may be broadly immunomodulatory in acute inflammatory states such as sepsis.

Keywords: Hematology; Hematopoietic stem cells; Innate immunity; Platelets; Stem cells.


Conflict of interest statement

Conflict of interest: The authors have declared that no conflict of interest exists.

Figures

Figure 1
Figure 1. Sepsis induces splenic megakaryopoiesis and platelet production.
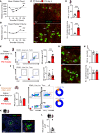
(A) Mean platelet count and (B) mean platelet volume after CS injection. n = 12 and n = 24 mice, respectively. 2PIVM images (C) and analysis (D) of MK and platelet production (arrows) in spleens from Pf4-mTmG mice 5 days after saline or CS injection. n = 7 and n = 5 mice, respectively. Scale bars: 50 μm. Enumeration and analysis of MKs in the spleen (E) and the BM (F) 5 days after saline or CS injection. n = 7 and n = 10 mice, respectively. 2PIVM images (G) and analysis (H) of MKs and platelet production (arrows) in BM from Pf4-mTmG mice, 5 days after saline or CS injection. Scale bars: 30 μm. n = 5 mice per group. (I) Enumeration and analysis of MKs in the lungs 5 days after saline or CS injection. n = 5 and n = 4 mice, respectively. (J) Analysis and frequency of intravascular (intravasc.) and extravascular (extravasc.) MKs in the lungs 5 days after saline or CS injection. n = 5 and n = 4 mice, respectively. (K) Representative images of a MK in a human spleen. Scale bars: 50 μm and 10 μm. (L) Enumeration of MKs per gram of human spleen (n = 7). Data indicate the mean ± SEM. ***P < 0.0001, by 2-tailed, unpaired Student’s t test and 2-way ANOVA.
Figure 2
Figure 2. Sepsis induces adrenergic-dependent MEP egress from the BM.
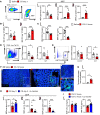
(A) Flow cytometric analysis of MEPs in the BM, blood, and spleen 3 days after saline or CS injection. n = 9 mice per group. (B) MegaCult colony-forming assay of BM and spleen MEPs 3 days after saline or CS injection. n = 10 and n = 8 mice, respectively. (C) BM CXCL12 and SCF levels 12 hours after saline or CS injection. n = 14 and n = 11, respectively. (D and E) Representative flow sorting of CD31+ endothelial and LepR+Tom+ stromal cells and expression of the retention factors Cxcl12 and Scf, as assessed by quantitative PCR (qPCR) 12 hours after saline or CS injection. (D) n = 9, n = 8 and n = 9, n = 6 and (E) n = 9, n = 8 and n = 8, n = 9 mice, respectively. FSC-A, forward scatter area. (F) Representative images and (G) quantification of tyrosine hydroxylase (TH) staining in the BM 12 hours after saline or CS injection. n = 5 and n = 4 mice, respectively. Scale bars: 100 μm and 50 μm. (H) Flow cytometric analysis of MEPs in the BM, blood, and spleen 3 days after CS injection with or without β3 receptor antagonism. n = 14 and n = 10 mice, respectively. (I) BM CXCL12 and SCF levels 12 hours after CS injection with or without β3 receptor antagonism. n = 10 mice per group. Data indicate the mean ± SEM. Significance was assessed using a 2-tailed, unpaired Student’s t test. *P < 0.05, **P < 0.005, and ***P < 0.0001. BMF, bone marrow fluid.
Figure 3
Figure 3. Sepsis promotes BM-derived MK engraftment and platelet production in the spleen.
(A) Flow cytometric analysis of GFP+ MEPs in the spleen 5 days after saline or CS injection. n = 7 mice per group. (B) Flow cytometric analysis of Tomato+ (Tom+) MKs in the spleen 5 days after saline or CS injection. n = 5 mice per group. (C) Flow cytometric analysis of adoptively transferred GFP+ MEPs in the spleen 3 days after saline or CS injection. n = 12 and n = 14 mice, respectively. (D) Flow cytometric analysis of adoptively transferred GFP+ MEPs in the spleen 3 days after CS injection and treatment with control IgG or SCF-neutralizing antibody. n = 13 and n = 14 mice, respectively. (E) Flow cytometric analysis of Tomato+ MKs in the spleen 2 weeks and 4 weeks after transplantation. n = 5 mice. (F) Percentage of donor-derived CD41+, Tomato+ platelets. n = 7 mice per group. *P < 0.05, **P < 0.005, and ***P < 0.0001, by 2-tailed, unpaired Student’s t test (AD) or 2-way ANOVA (F).
Figure 4
Figure 4. IL-3 drives MK maturation in the spleen during sepsis.
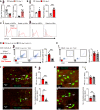
(A) Expression of Thpo and Il3 in the spleen as assessed by qPCR, 1 day after saline or CS injection. n = 10, n = 10 and n = 7, n = 10 mice, respectively. (B) Blood levels of TPO and IL-3 after saline injection 3 days after CS injection. n = 13, n = 9, n = 10 and n = 10, n = 8, and n = 9 mice, respectively. (C) Surface expression of IL-3Rα (CD123) on MEPs and MKs in the BM (left) and spleen (right). (D and E) Flow cytometric analysis of MKs in the spleen (D) and BM (E), 5 days after CS injection and treatment with anti-HRP or anti–IL-3–neutralizing antibody. n = 9 and n = 7 mice, respectively. Ctrl, control. (F and G) 2PIVM images (F) and analysis (G) of MKs and platelet production (arrows) in the spleen in Pf4-mTmG mice 5 days after CS injection and treatment with anti-HRP or anti–IL-3–neutralizing antibody. n = 4 and n = 5 mice, respectively. Scale bars: 50 μm. (H and I) 2PIVM images (H) and analysis (I) of MKs and platelet production (arrows) in the BM in Pf4-mTmG mice 5 days after CS injection and treatment with daily anti-HRP or anti–IL-3 antibody. Scale bars: 30 μm. n = 7 and n = 5 mice, respectively. Data indicate the mean ± SEM. **P < 0.005 and ***P < 0.0001, by 2-tailed, unpaired Student’s t test.
Figure 5
Figure 5. The spleen produces immune-skewed MKs.
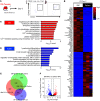
(A) Gating strategy for MKs in the spleen. (B) Pf4-Tomato+ MKs were sorted from the BM and spleen 5 days after sepsis, followed by mRNA isolation and sequencing. Relative mRNA expression from low (blue) to high (red) of the top 50 genes differentially increased in the BM versus spleen (upper part) and the top 50 genes differentially increased in the spleen versus BM (lower part). (FDR <0.05). (C and D) GO-BP analysis of genes upregulated in BM MKs (C) or upregulated in splenic MKs (D) 5 days after CS injection. The top 10 biological processes are shown. (E) BioVenn diagram of differentially expressed genes between BM and splenic (SP) MKs 5 days after saline or CS injection. (F) Volcano plots of DEG fold change between BM and splenic MKs 5 days after sepsis. n = 3 mice.
Figure 6
Figure 6. The spleen produces CD40Lhi platelets.
(A) Percentage and analysis of CD40L+ platelets 5 days after saline injection, CS injection, or CS injection into splenectomized mice. n = 8, n = 8, and n = 5 mice, respectively. (B) Percentage of CD40L+ donor-derived Tomato+ platelets 10 days after spleen transplantation. n = 7 mice per group. (C) CitH3-DNA complexes (NETs) after incubation of BM neutrophils with recombinant mouse CD40L or PMA. n = 8 mice per group. (D) Schematic of platelet, neutrophil, and MRSA coincubation experiments. (E and F) Bacterial CFU (E) and CitH3-DNA complexes (NETs) (F) after neutrophil, MRSA, and platelet (collected from saline-injected mice or 5 days after CS injection into mice) coincubation. (E) n = 10 mice per group and (F) n = 5 mice per group. (G and H) Bacterial CFU (G) and CitH3-DNA complexes (H) after neutrophil, MRSA, and platelet (collected from mice 5 days after CS injection) coincubation with or without treatment with an anti-CD40L–neutralizing antibody. n = 11 mice per group. Data indicate the mean ± SEM. *P < 0.05, **P < 0.005, and ***P < 0.0001, by 1-ANOVA (A and C), 2-way ANOVA (B), and 2-tailed, unpaired Student’s t test (EH).
Figure 7
Figure 7. Transfusion of post-sepsis platelets confers protection against sepsis.
(A) Schematic of septic mice transfused with platelets isolated on day 5 after saline or CS injection experiments. (B) Mean platelet counts, (C) bacterial CFU in the blood, (D) enumeration of neutrophils and Ly6Chi monocytes in the blood, (E) enumeration of neutrophil-platelet and Ly6Chi monocyte-platelet aggregates in the blood, (F) plasma TNF-α and IL-6 levels, (G) plasma AST levels, (H) BAL neutrophil count, (I) BAL protein levels, and (J) CitH3-DNA complexes (NETs) in the blood. n = 15–16 mice for all measurements. (K) Kaplan-Meier survival curve for mice transfused with 3 × 10⁸ platelets on day 5 after saline or CS injection. n = 15 mice per group. Data indicate the mean ± SEM. *P < 0.05 and ***P < 0.0001, by 2-tailed, unpaired Student’s t test (BJ) and Gehan-Breslow-Wilcoxon test (K).

References

    1. Lefrancais E, et al. The lung is a site of platelet biogenesis and a reservoir for haematopoietic progenitors. Nature. 2017;544(7648):105–109. doi: 10.1038/nature21706. - DOI - PMC - PubMed
    1. Pariser DN, et al. Lung megakaryocytes are immune modulatory cells. J Clin Invest. 2021;131(1):137377. - PMC - PubMed
    1. Jackson SP. Arterial thrombosis--insidious, unpredictable and deadly. Nat Med. 2011;17(11):1423–1436. doi: 10.1038/nm.2515. - DOI - PubMed
    1. Versteeg HH, et al. New fundamentals in hemostasis. Physiol Rev. 2013;93(1):327–358. doi: 10.1152/physrev.00016.2011. - DOI - PubMed
    1. Margraf A, Zarbock A. Platelets in inflammation and resolution. J Immunol. 2019;203(9):2357–2367. doi: 10.4049/jimmunol.1900899. - DOI - PubMed

Publication types