Clinical Trial
. 2022 Jun 14;6(11):3451-3457.
doi: 10.1182/bloodadvances.2021006783.

Lasting shift in the gut microbiota in patients with acute myeloid leukemia

Affiliations
Clinical Trial

Lasting shift in the gut microbiota in patients with acute myeloid leukemia

Armin Rashidi et al. Blood Adv. .

Abstract

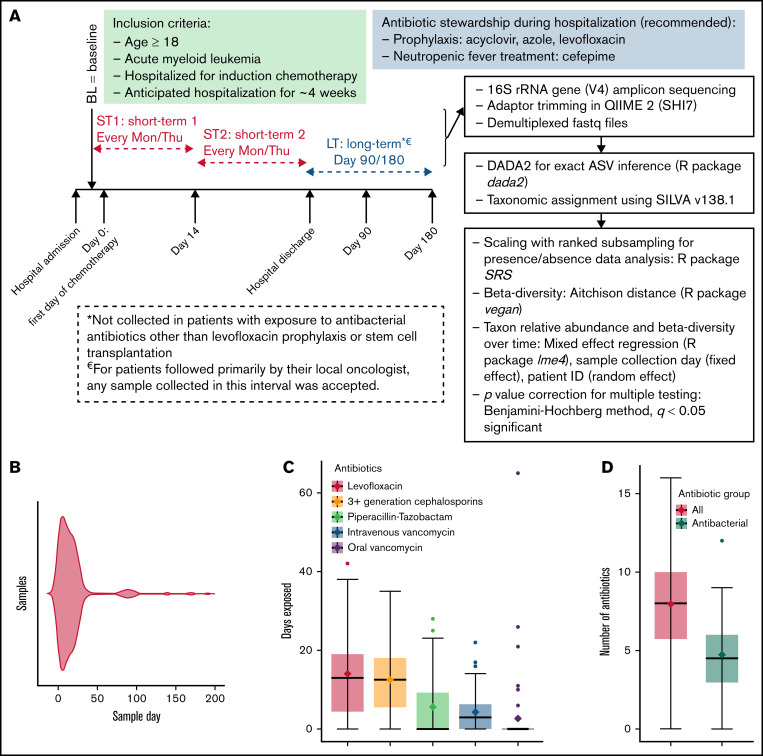
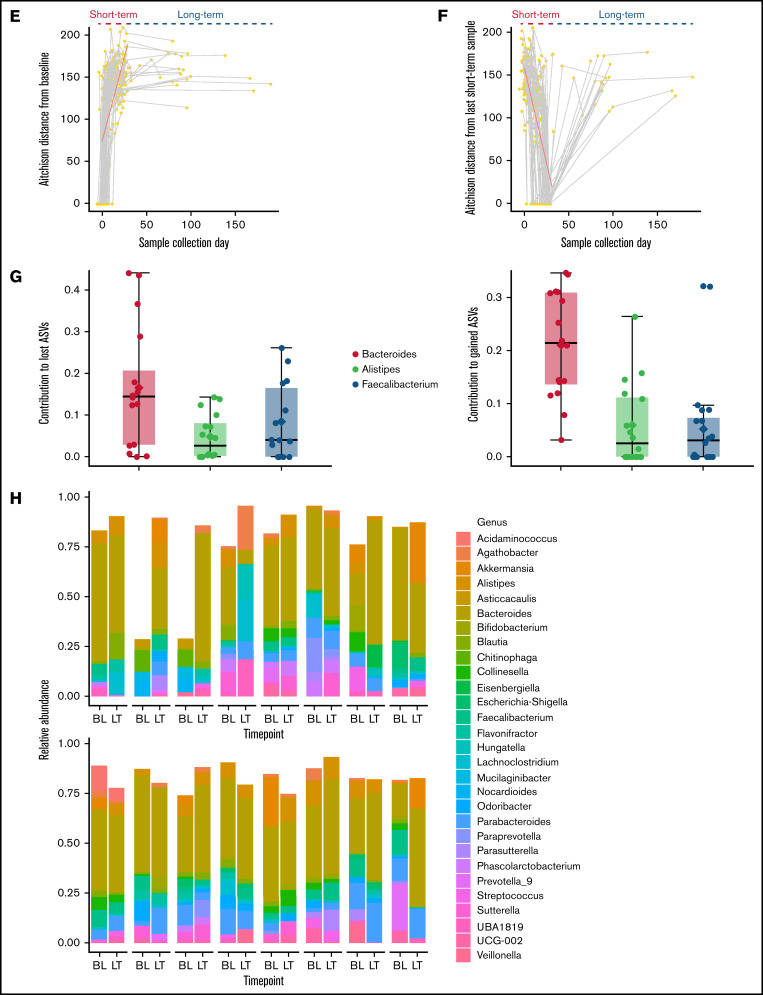
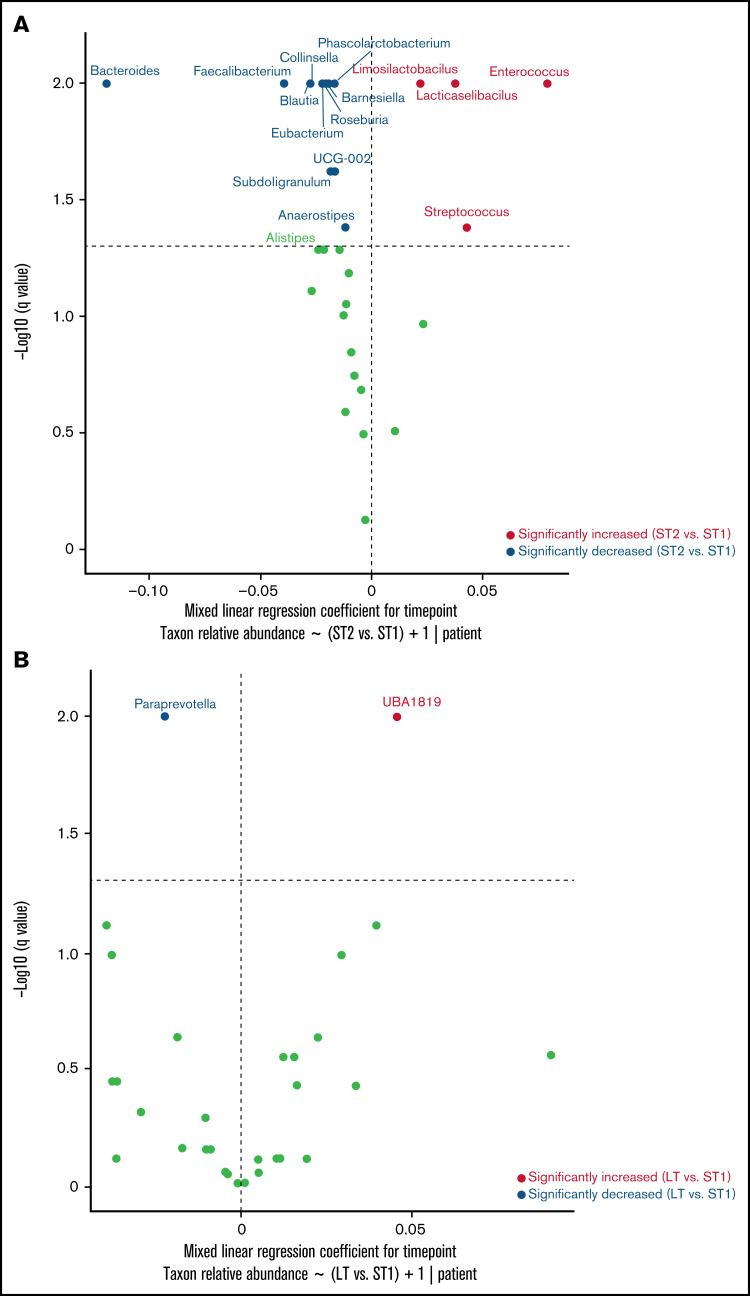
Previous studies have shown that the gut microbiota of patients with acute myeloid leukemia (AML) is disrupted during induction chemotherapy; however, the durability of microbiota changes is unknown. This is an important knowledge gap, because reduced microbiota diversity at the time of stem cell transplantation weeks to months after the initial chemotherapy has been associated with higher mortality after transplantation. By sequencing the gut microbiota in 410 longitudinal stool samples from 52 patients with AML, we found that, during inpatient chemotherapy, the gut microbiota is stressed beyond its ability to recover its original state. Despite major reductions in antibiotic pressure and other disturbances to the microbiota after hospital discharge, the trajectory of microbiota recovery yields new communities that are highly dissimilar to baseline. This lasting shift in the gut microbiota is relevant for subsequent phases of curative therapy and is a potential target for novel microbiota protective/restorative interventions. This trial was registered at www.clinicaltrials.gov as #NCT03316456.


Figures

Figure 1.
Figure 1.
Short- and long-term microbiota dynamics. (A) Study schema. Induction chemotherapy typically starts within a few days after admission and is completed by day 7. Bone marrow aplasia occurs around day 14, which we used to define early (ST1) vs late (ST2) short-term samples. (B) Violin plot shows sample distribution over time. The duration (C) and number (D) of all antibiotics and antibacterial antibiotics during the initial hospitalization. (E) Aitchison distance between each sample and the baseline sample from the same patient. Connected points represent samples from the same patient. (F) Aitchison distance between each sample and the last short-term sample from the same patient. Regression lines for short-term samples are derived from a linear mixed-effect regression, where patient ID was a random effect and sample collection day, measured from the first day of chemotherapy (E) or the last short-term sample (F), was a fixed effect. (G) The top 3 genera containing lost (left panel) and gained (right panel) ASVs between the baseline sample and the last long-term sample for each patient. The y-axis shows the proportion of such ASVs belonging to each genus. Each point represents data from 1 patient. (H) Genus-level relative abundances in baseline (BL) and last long-term (LT) samples from each of the 16 patients with long-term samples. The 5 most abundant genera in each sample were selected, and the combined set of genera generated from all samples was used to plot the stacked bars. Box plots in (C), (D), and (G) show the median (horizontal line), mean (diamond), and interquartile range.
Figure 1.
Figure 1.
Short- and long-term microbiota dynamics. (A) Study schema. Induction chemotherapy typically starts within a few days after admission and is completed by day 7. Bone marrow aplasia occurs around day 14, which we used to define early (ST1) vs late (ST2) short-term samples. (B) Violin plot shows sample distribution over time. The duration (C) and number (D) of all antibiotics and antibacterial antibiotics during the initial hospitalization. (E) Aitchison distance between each sample and the baseline sample from the same patient. Connected points represent samples from the same patient. (F) Aitchison distance between each sample and the last short-term sample from the same patient. Regression lines for short-term samples are derived from a linear mixed-effect regression, where patient ID was a random effect and sample collection day, measured from the first day of chemotherapy (E) or the last short-term sample (F), was a fixed effect. (G) The top 3 genera containing lost (left panel) and gained (right panel) ASVs between the baseline sample and the last long-term sample for each patient. The y-axis shows the proportion of such ASVs belonging to each genus. Each point represents data from 1 patient. (H) Genus-level relative abundances in baseline (BL) and last long-term (LT) samples from each of the 16 patients with long-term samples. The 5 most abundant genera in each sample were selected, and the combined set of genera generated from all samples was used to plot the stacked bars. Box plots in (C), (D), and (G) show the median (horizontal line), mean (diamond), and interquartile range.
Figure 2.
Figure 2.
Genus-level dynamics over time. A mixed-effects model was built for each genus in the form of relative abundance ∼ interval + 1|patient ID, with the interval defined according to Figure 1A. Horizontal lines represent q = 0.05. The significance of the regression coefficient for interval was estimated from 200 bootstraps, corrected for multiple testing by the Benjamini-Hochberg method, plotted along the y-axis, and used to determine whether the relative abundance of a genus changed between the intervals. The regression coefficient for interval was plotted along the x-axis. Points to the right (left) of the vertical line represent increased (decreased) genera at short-term 2 (ST2; panel A) or long-term (LT; panel B) relative to short-term 1 (ST1).

References

    1. Scheffer M, Bolhuis JE, Borsboom D, et al. . Quantifying resilience of humans and other animals. Proc Natl Acad Sci USA. 2018;115(47): 11883-11890. - PMC - PubMed
    1. Costello EK, Stagaman K, Dethlefsen L, Bohannan BJM, Relman DA. The application of ecological theory toward an understanding of the human microbiome. Science. 2012;336(6086):1255-1262. - PMC - PubMed
    1. Dethlefsen L, Relman DA. Incomplete recovery and individualized responses of the human distal gut microbiota to repeated antibiotic perturbation. Proc Natl Acad Sci USA. 2011;108(suppl 1):4554-4561. - PMC - PubMed
    1. Rashidi A, Kaiser T, Graiziger C, et al. . Specific gut microbiota changes heralding bloodstream infection and neutropenic fever during intensive chemotherapy. Leukemia. 2020;34(1):312-316. - PubMed
    1. Rashidi A, Kaiser T, Graiziger C, et al. . Gut dysbiosis during antileukemia chemotherapy versus allogeneic hematopoietic cell transplantation. Cancer. 2020;126(7):1434-1447. - PubMed

Publication types

Substances

Associated data