. 2022 Mar;114(2):110318.
doi: 10.1016/j.ygeno.2022.110318. Epub 2022 Feb 19.

Single molecule, long-read Apoer2 sequencing identifies conserved and species-specific splicing patterns

Affiliations

Single molecule, long-read Apoer2 sequencing identifies conserved and species-specific splicing patterns

Christina M Gallo et al. Genomics. 2022 Mar.

Abstract

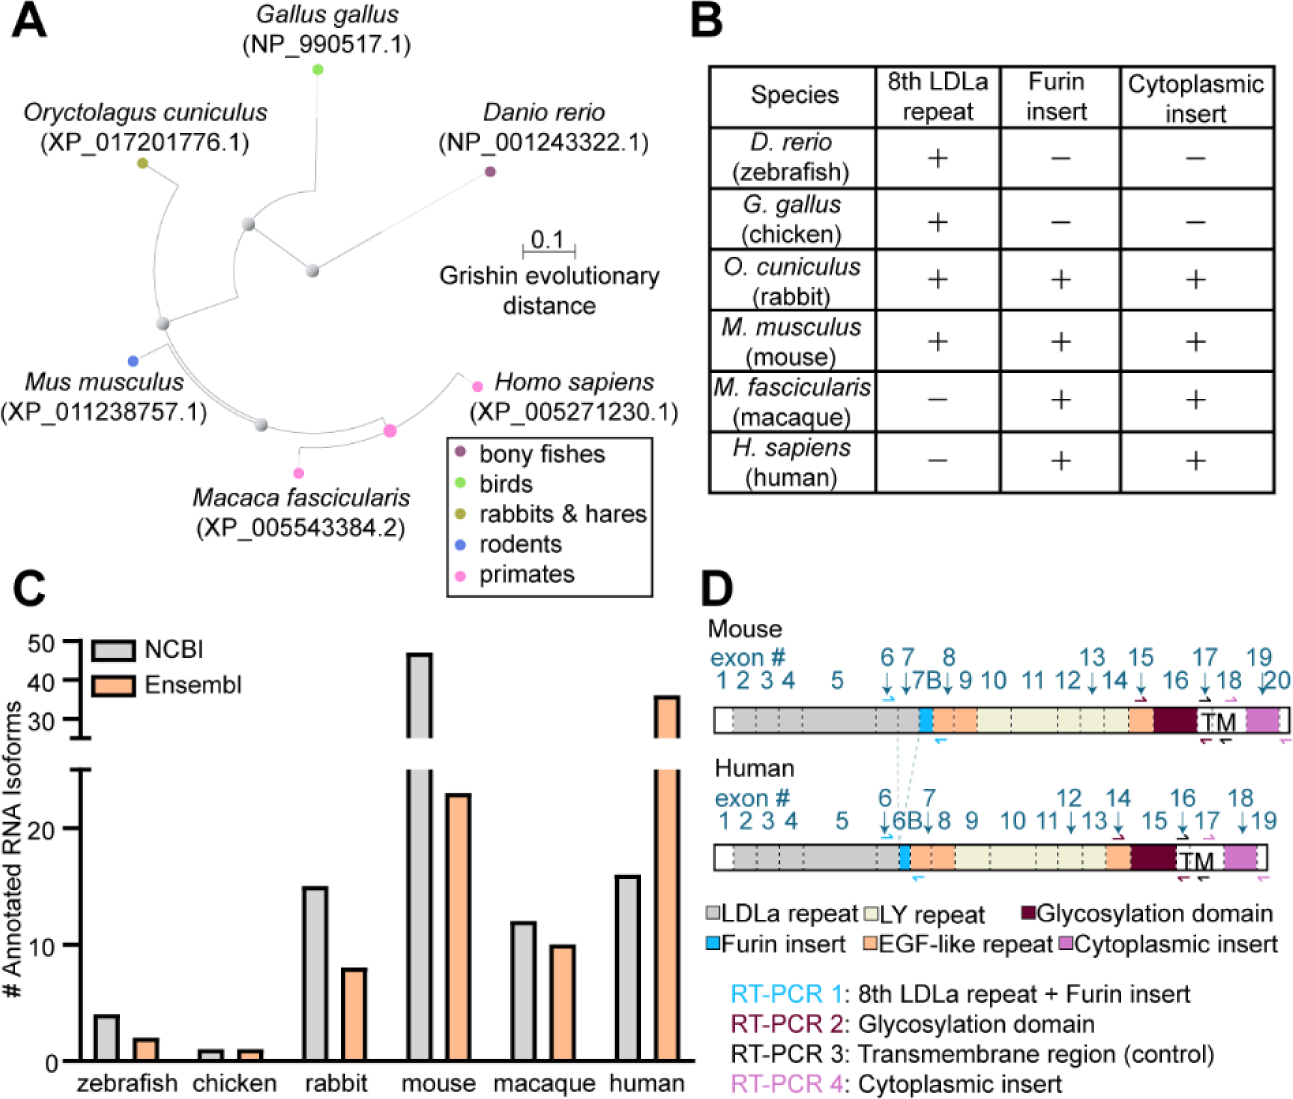
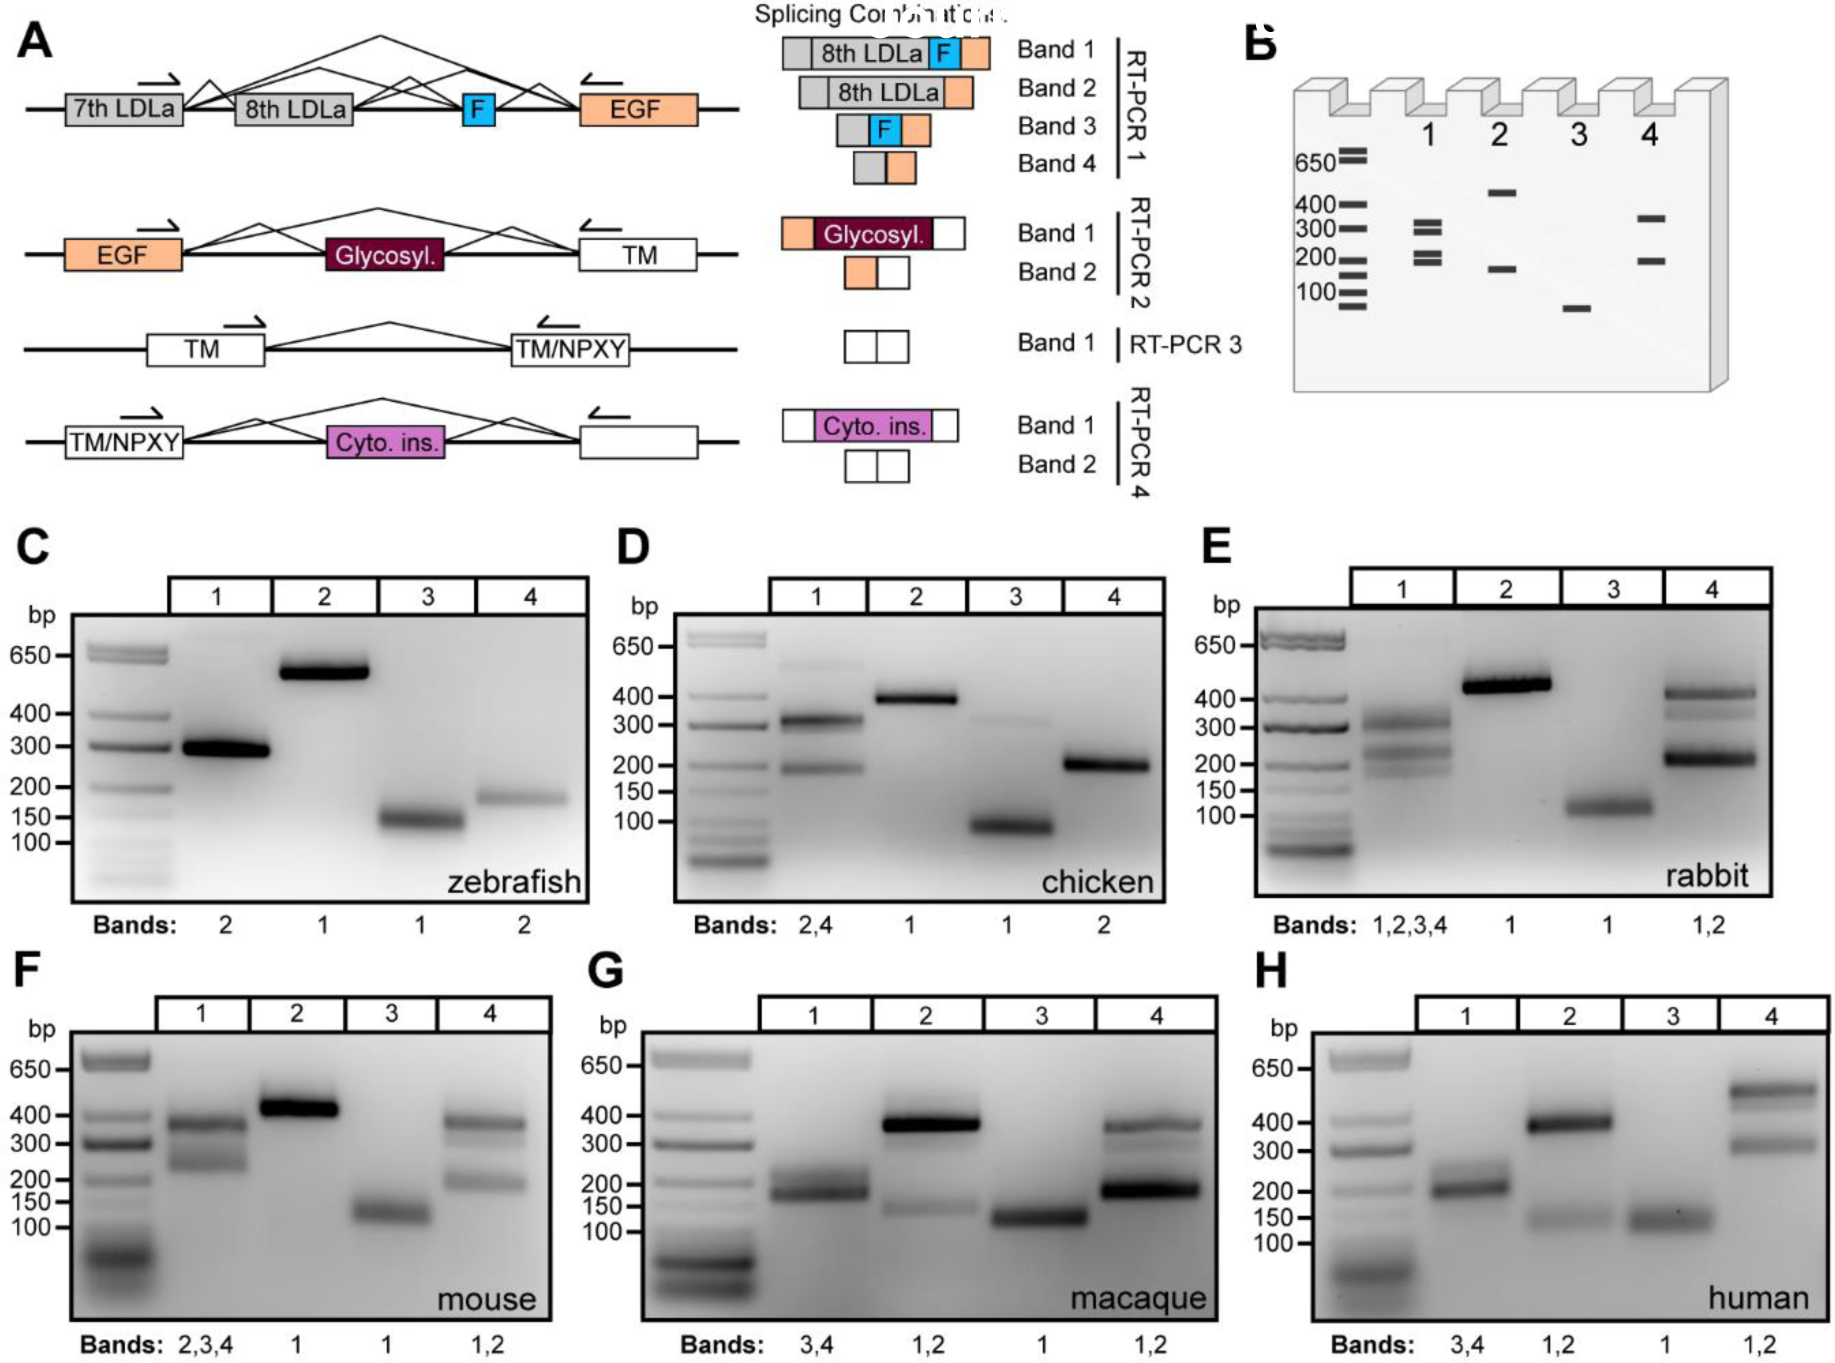
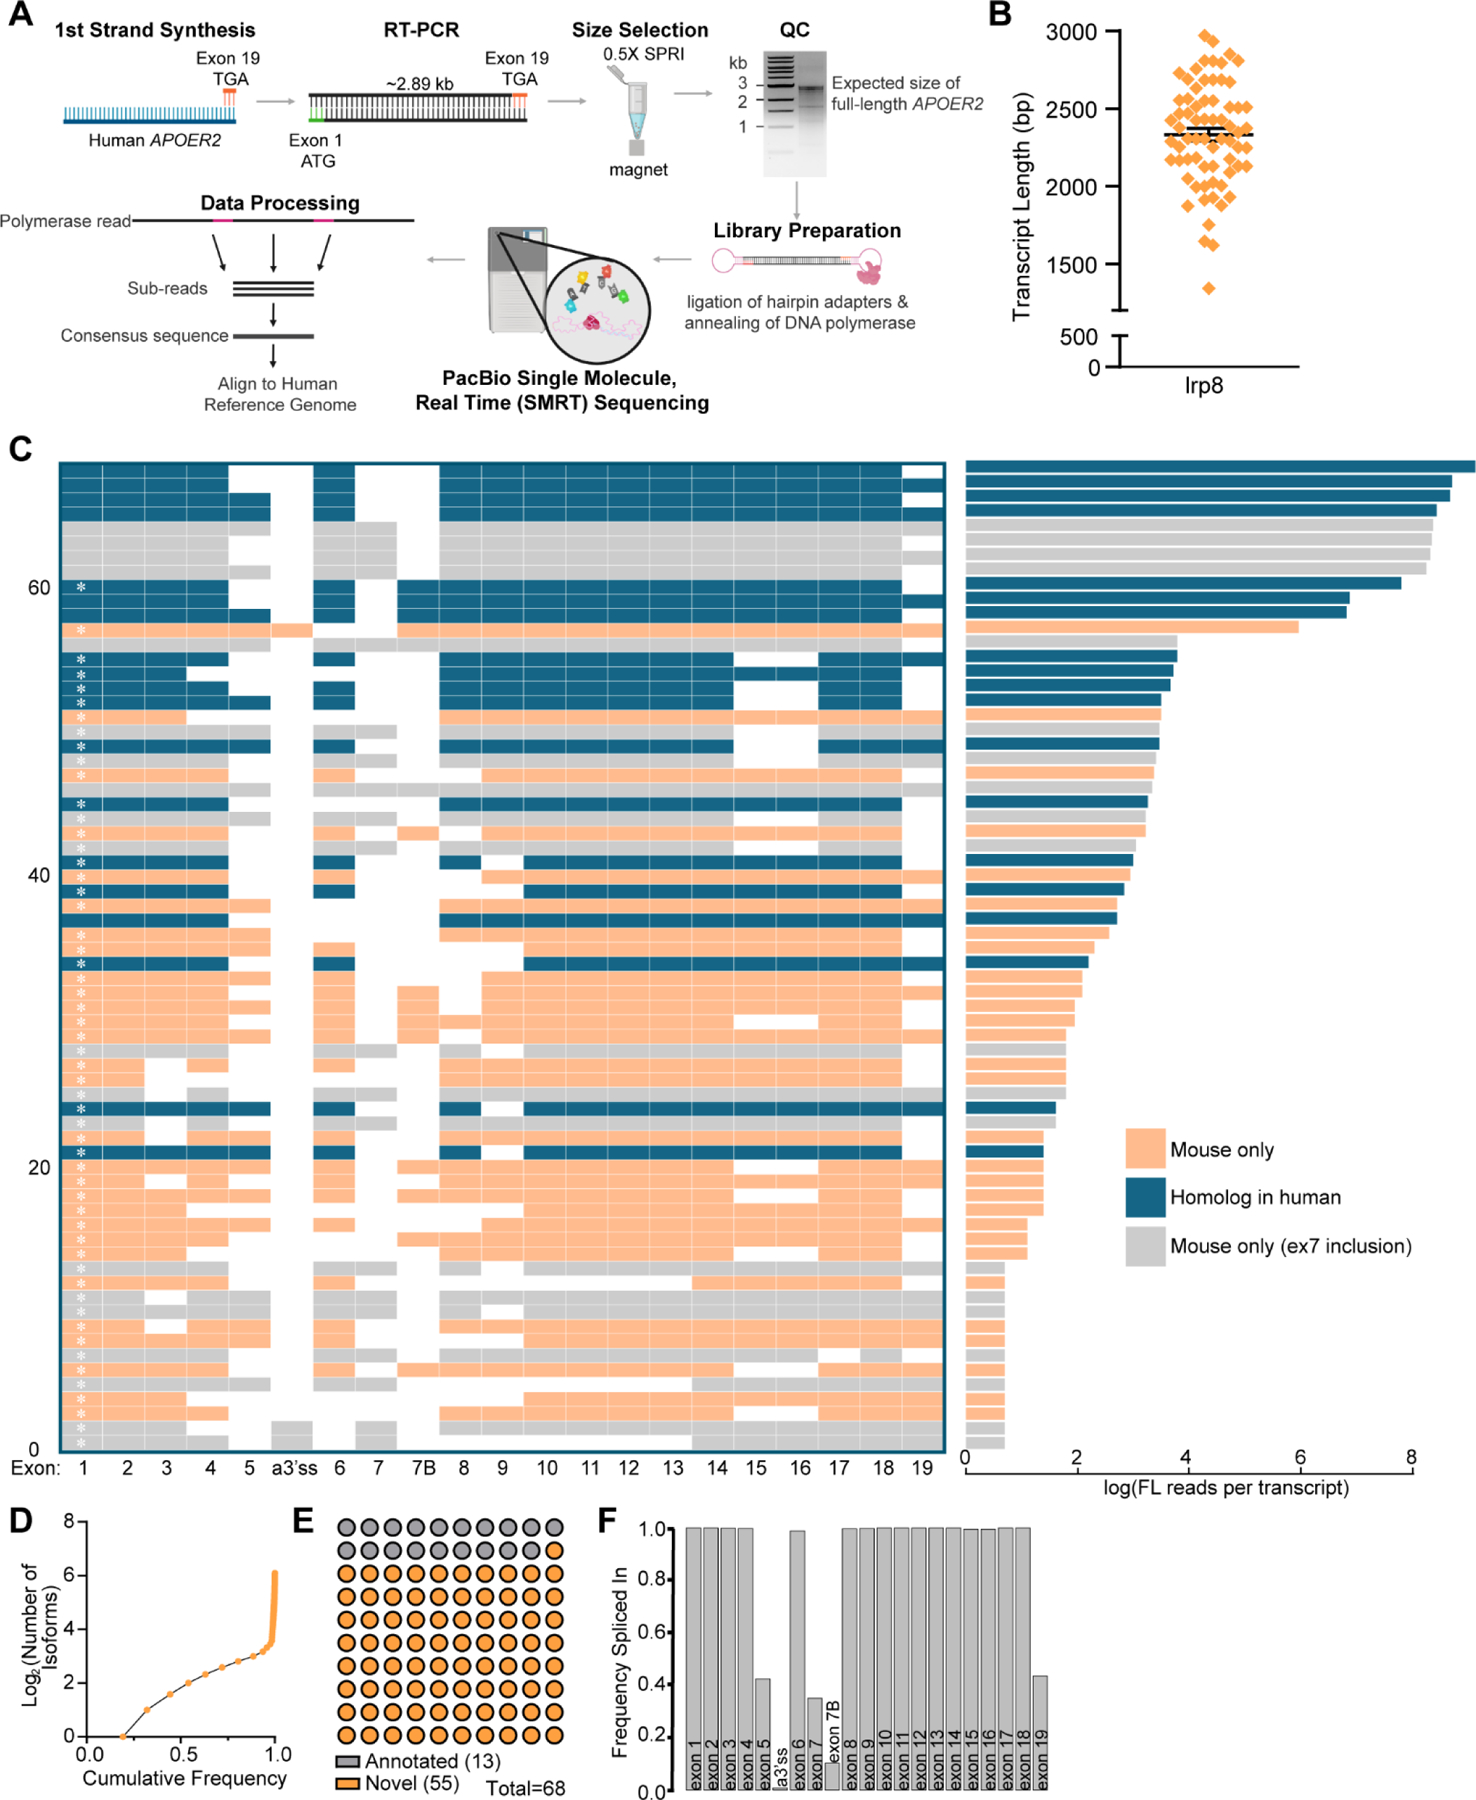
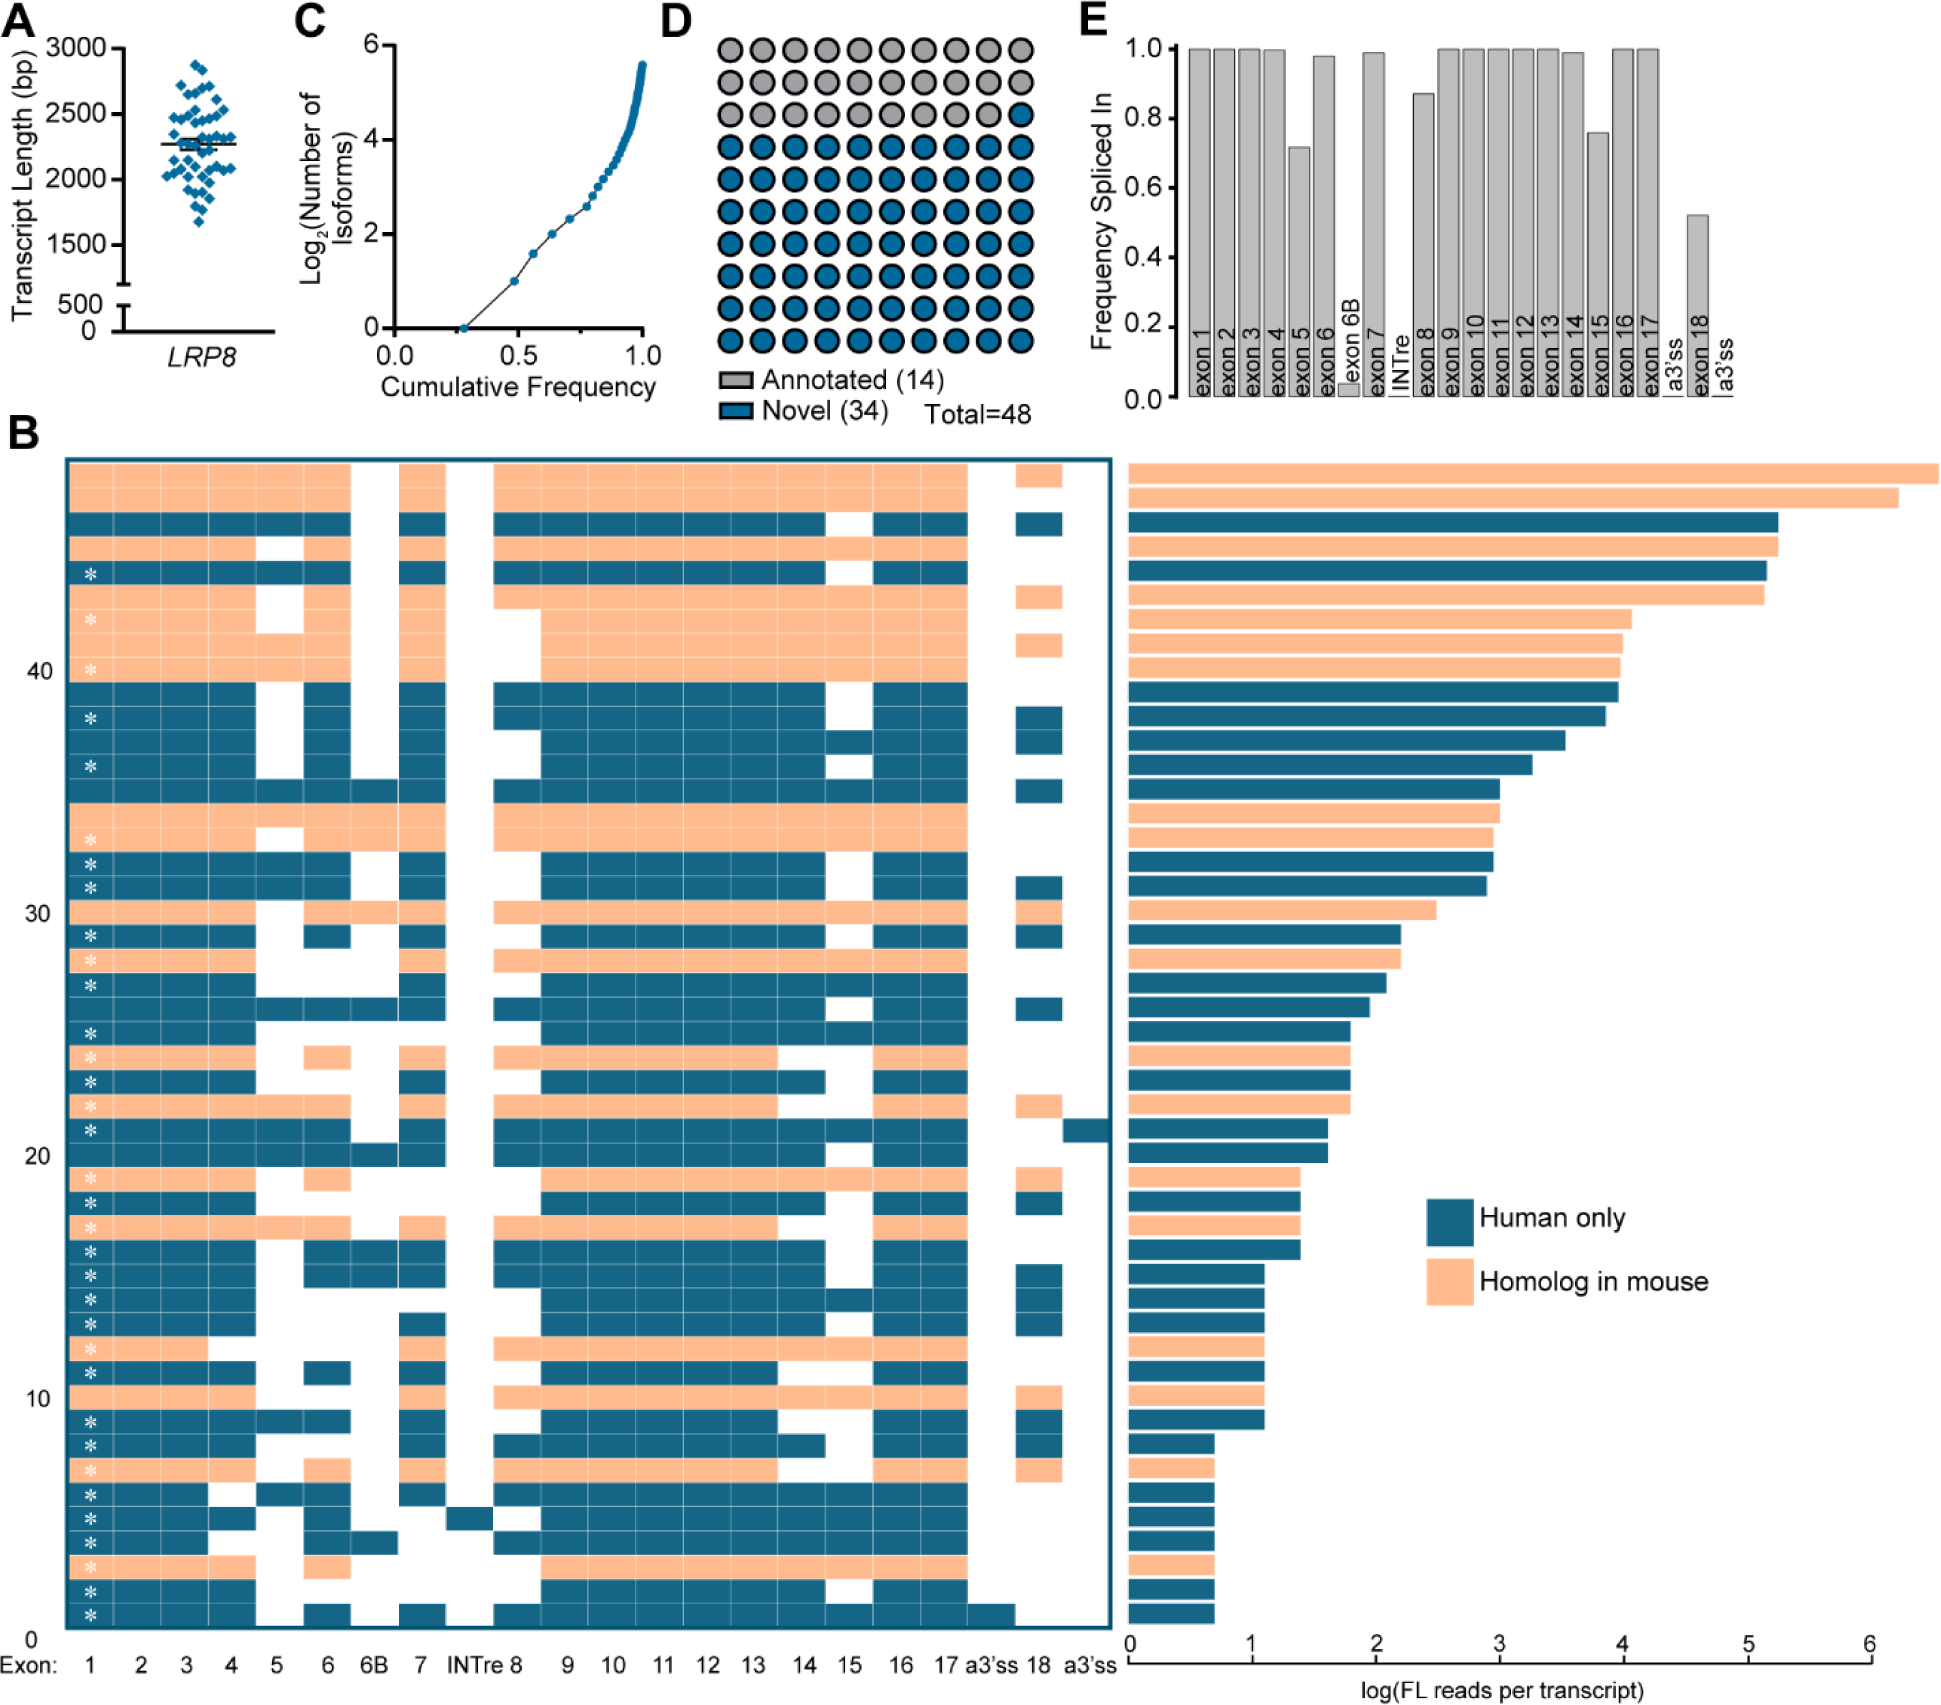
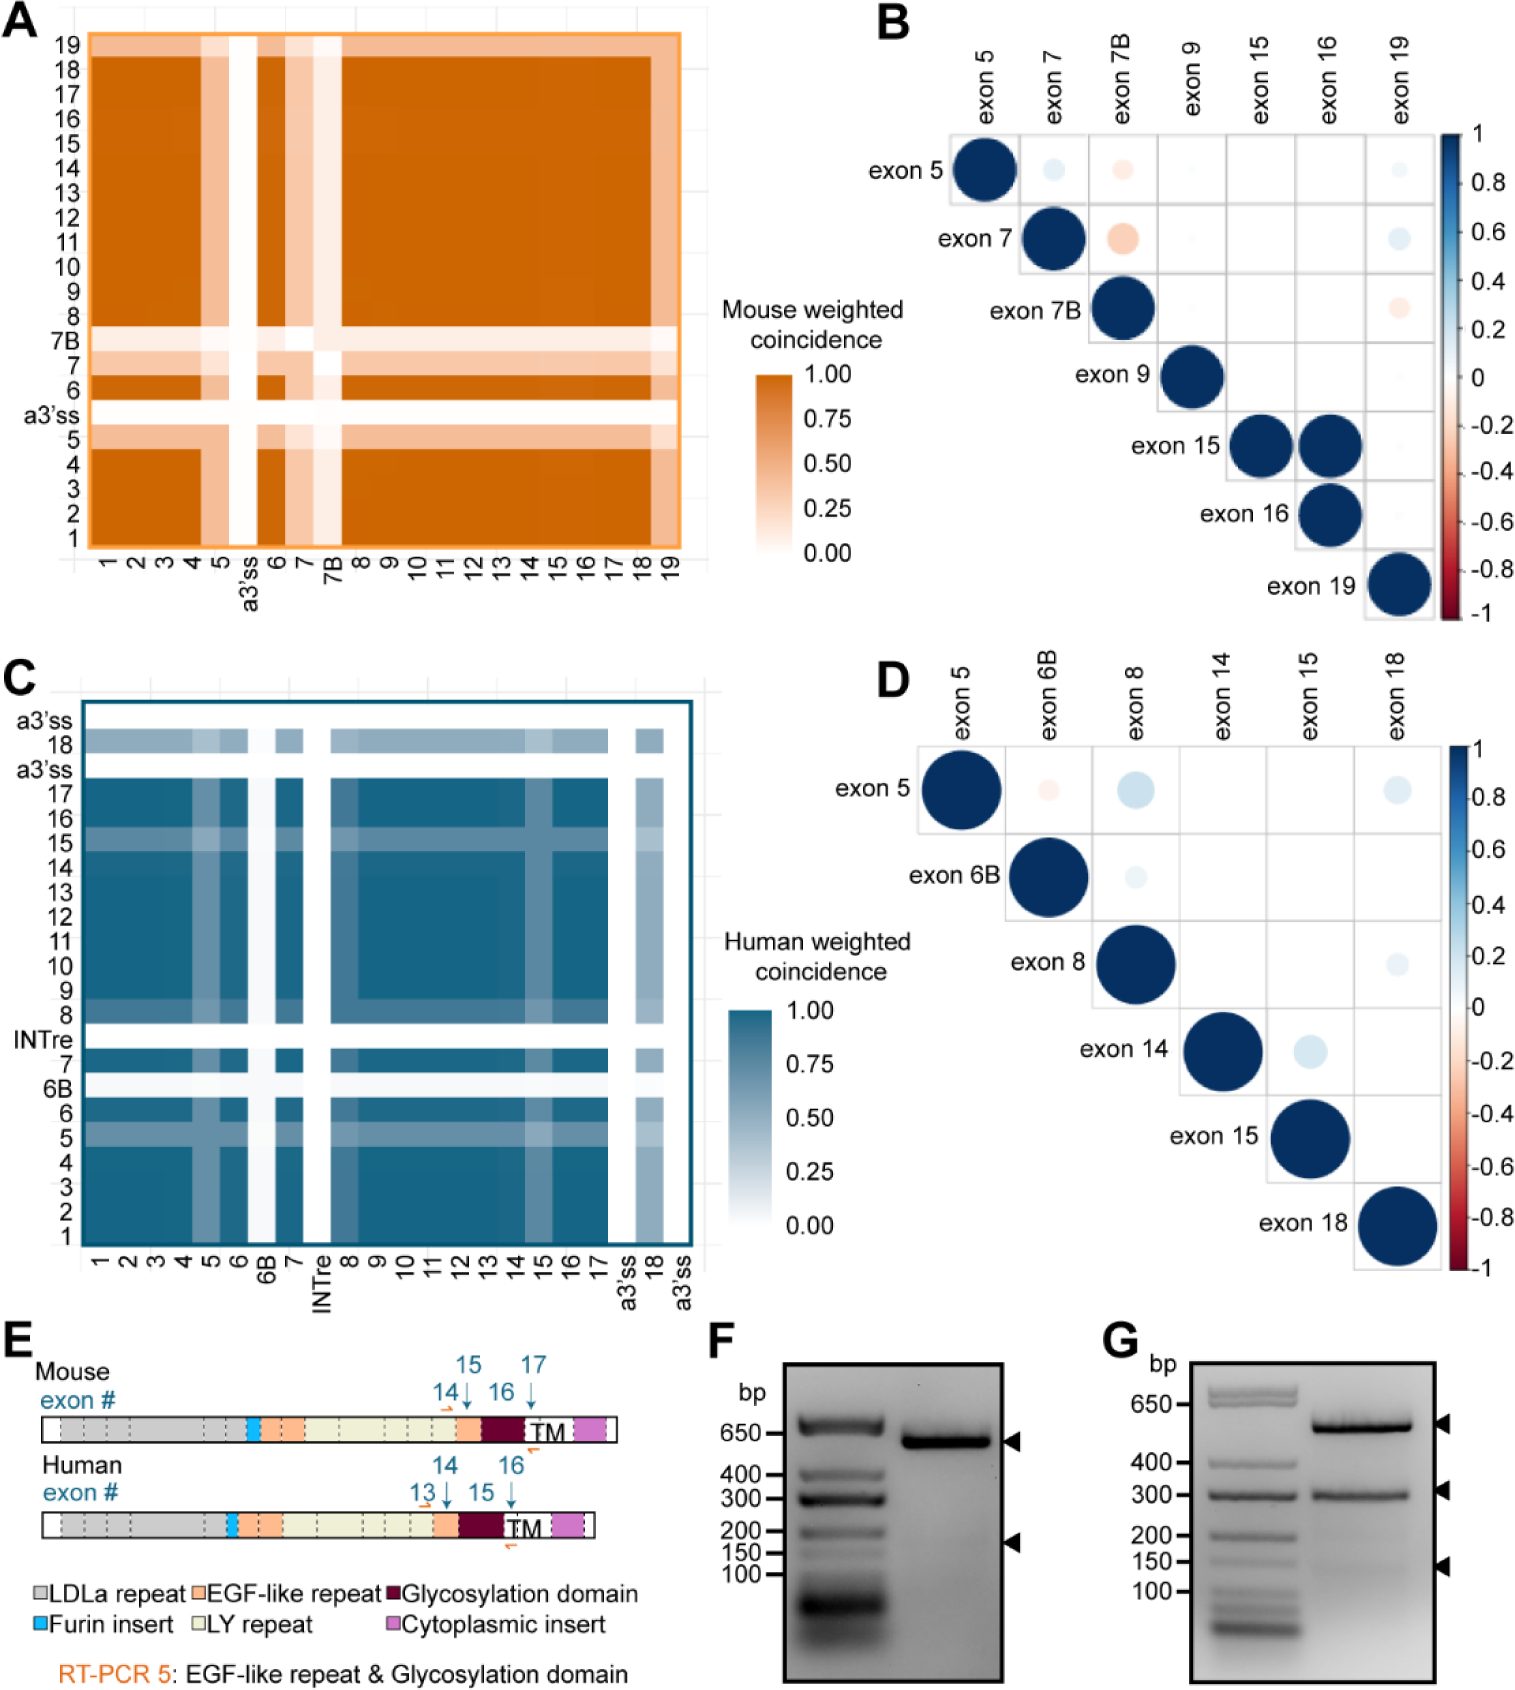
Apolipoprotein E receptor 2 (Apoer2) is a synaptic receptor in the brain that binds disease-relevant ligand Apolipoprotein E (Apoe) and is highly alternatively spliced. We examined alternative splicing (AS) of conserved Apoer2 exons across vertebrate species and identified gain of exons in mammals encoding functional domains such as the cytoplasmic and furin inserts, and loss of an exon in primates encoding the eighth LDLa repeat, likely altering receptor surface levels and ligand-binding specificity. We utilized single molecule, long-read RNA sequencing to profile full-length Apoer2 isoforms and identified 68 and 48 unique full-length Apoer2 transcripts in the mouse and human cerebral cortex, respectively. Furthermore, we identified two exons encoding protein functional domains, the third EGF-precursor like repeat and glycosylation domain, that are tandemly skipped specifically in mouse. Our study provides new insight into Apoer2 isoform complexity in the vertebrate brain and highlights species-specific differences in splicing decisions that support functional diversity.

Keywords: APOER2; Alternative splicing; LRP8.


Conflict of interest statement

The authors declare no competing interests.

Figures

Figure 1.
Figure 1.. Apoer2 protein and isoform diversity across vertebrates.
(A) Phylogenetic tree of Apoer2 spanning from Danio rerio (zebrafish) to Homo sapiens (humans) displaying Grishin evolutionary distance. (B) Table indicating presence or absence of Apoer2 protein domains of interest across vertebrates based off protein reference annotations. (C) Bar graph depicting the number of annotated Apoer2 isoforms for each vertebrate species in each the NCBI and Ensembl online databases. (D) Schematic of Apoer2 protein domains and corresponding coding exons in each mice and humans. RT-PCR primer schemes are indicated using arrows.
Figure 2.
Figure 2.. Apoer2 alternative splicing complexity in the brain increases across vertebrate evolution.
(A) Schematic demonstrating RT-PCR primer design along with the corresponding exon to protein functional domain each primer set amplifies. Expected splicing combinations are depicted on the right side along with a band number corresponding to the cartoon agarose gel (B) (generated using Biorender.com) depicting potential RT-PCR banding patterns if all combinations of cassette exon decisions are used. (C-H) Gels depicting RT-PCR analysis of Apoer2 alternative exons encoding the eighth LDLa repeat and furin insert (Lane 1), glycosylation domain (Lane 2), control transmembrane region (Lane 3) and cytoplasmic insert (Lane 4) across vertebrate species: (C) zebrafish, (D) chicken, (E) rabbit, (F) mouse, (G) macaque and (H) human. Bands in each lane are annotated below the gel according to the numbering displayed in (A).
Figure 3.
Figure 3.. Full-length Apoer2 isoform mapping in the murine cerebral cortex.
(A) Schematic depicting Apoer2 specific single molecule, long-read sequencing workflow (generated using Biorender.com). (B) Graph indicating mean transcript length ±SEM of unique murine Apoer2 isoforms detected in the cerebral cortex excluding RT-PCR primers. (C) Left: Transcript matrix depicting Apoer2 isoforms identified as individual rows. Transcripts with exons present in less than 10 unique transcripts before filtering were excluded, leaving 68 unique transcripts. Exons spliced in are colored, while skipped exons are white. Numbering at the left-hand margin indicates transcript number. A white asterisk inside of exon 1 indicates a novel or previously unannotated transcript. Right: Bar plot indicating the log of the total number of full-length reads of each corresponding transcript in the adjacent matrix. All transcripts and their corresponding number of reads are colored coded based on whether there is a corresponding homolog isoform in humans (blue), the transcript contains the mouse specific exon encoding the eighth LDLa repeat (grey), or whether the transcript is specific to mouse but does not contain the exon encoding the eighth LDLa repeat (orange). (D) Cumulative frequency of detected Apoer2 isoforms. (E) Graph indicating the proportion of detected transcripts that are either annotated in NCBI or Ensembl or novel. (F) Bar graph demonstrating the frequency at which each Apoer2 exon is spliced in based on the detected transcripts and their number of full-length reads.
Figure 4.
Figure 4.. APOER2 full length isoform mapping in the human cerebral cortex.
(A) Graph indicating the mean transcript length ±SEM of unique APOER2 isoforms detected in the human cerebral cortex excluding RT-PCR primers. (B) Left: Transcript matrix displaying APOER2 isoforms identified in the human cerebral cortex as individual rows. Exons spliced in are colored, while skipped exons are white. Numbering at the left-hand margin indicates transcript number. A white asterisk inside of exon 1 indicates a novel or previously unannotated transcript. Right: Bar graph displaying the log of the number of full-length reads per isoform in the adjacent transcript matrix. All transcripts and their corresponding number of reads are colored orange if there is a corresponding homolog isoform in mouse or blue if the isoform is specific to humans. (C) Cumulative frequency graph of detected APOER2 isoforms. (D) Parts of a whole graph demonstrating the number of detected transcripts found to be annotated in NCBI or Ensembl databases or novel. (E) Bar graph indicating the frequency at which each APOER2 exon is spliced in across all the detected isoforms weighted by their abundance.
Figure 5.
Figure 5.. Mouse Apoer2 exhibits tandem splicing of exons encoding the third EGF precursor-like repeat and glycosylation domain.
(A) Heatmap examining the coincidence of individual murine Apoer2 exons compared to every other exon. Coincidence was calculated as the number of times the exons in each comparison pair were both spliced into the same transcript divided by the total number of transcripts. (B) Correlation matrix depicting Pearson’s correlation coefficient of alternatively spliced murine Apoer2 exons. Color indicates value of Pearson’s coefficient and size of dot indicates magnitude of significance, with a cutoff of p<0.01. (C) Heatmap displaying coincidence value for human cerebral cortex APOER2 exons. (D) Correlation matrix of Pearson’s correlation coefficient analysis of human alternatively spliced APOER2 exons. Significance is p<0.01. (E) Schematic depicting mouse and human Apoer2 protein domains and corresponding coding exons along with RT-PCR strategy for F and G. (F) Gel depicting RT-PCR of mRNA from the murine cerebral cortex examining coordinated splicing of Apoer2 exons 15 and 16. Arrowheads indicate detected bands that were excised and sequenced. (G) Gel analysis of RT-PCR from human cerebral cortex mRNA examining splicing of exons 14 and 15 in APOER2. Arrowheads indicate detected bands excised for sequencing confirmation.

Similar articles

Cited by

References

    1. Alekseyenko AV, Kim N, Lee CJ, 2007. Global analysis of exon creation versus loss and the role of alternative splicing in 17 vertebrate genomes. RNA 13, 661–670. 10.1261/rna.325107 - DOI - PMC - PubMed
    1. Altschul SF, Gish W, Miller W, Myers EW, Lipman DJ, 1990. Basic local alignment search tool. Journal of Molecular Biology 215, 403–410. 10.1016/S0022-2836(05)80360-2 - DOI - PubMed
    1. Barbosa-Morais NL, 2005. Systematic genome-wide annotation of spliceosomal proteins reveals differential gene family expansion. Genome Research 16, 66–77. 10.1101/gr.3936206 - DOI - PMC - PubMed
    1. Beffert U, Nematollah Farsian F, Masiulis I, Hammer RE, Yoon SO, Giehl KM, Herz J, 2006. ApoE Receptor 2 Controls Neuronal Survival in the Adult Brain. Current Biology 16, 2446–2452. 10.1016/j.cub.2006.10.029 - DOI - PubMed
    1. Beffert U, Weeber EJ, Durudas A, Qiu S, Masiulis I, Sweatt JD, Li W-P, Adelmann G, Frotscher M, Hammer RE, Herz J, 2005. Modulation of synaptic plasticity and memory by Reelin involves differential splicing of the lipoprotein receptor Apoer2. Neuron 47, 567–579. 10.1016/j.neuron.2005.07.007 - DOI - PubMed

Publication types

Substances