

Exploring an algorithm to harmonize International Obesity Task Force and World Health Organization child overweight and obesity prevalence rates
- PMID: 35193166
- PMCID: PMC9285550
- DOI: 10.1111/ijpo.12905
Exploring an algorithm to harmonize International Obesity Task Force and World Health Organization child overweight and obesity prevalence rates
Abstract
Background: The International Obesity Task Force (IOTF) and World Health Organization (WHO) body mass index (BMI) cut-offs are widely used to assess child overweight, obesity and thinness prevalence, but the two references applied to the same children lead to different prevalence rates.
Objectives: To develop an algorithm to harmonize prevalence rates based on the IOTF and WHO cut-offs, to make them comparable.
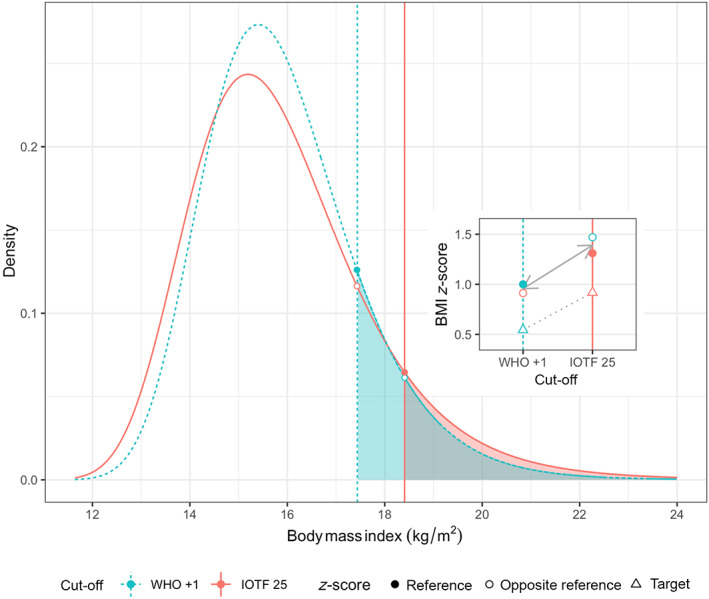
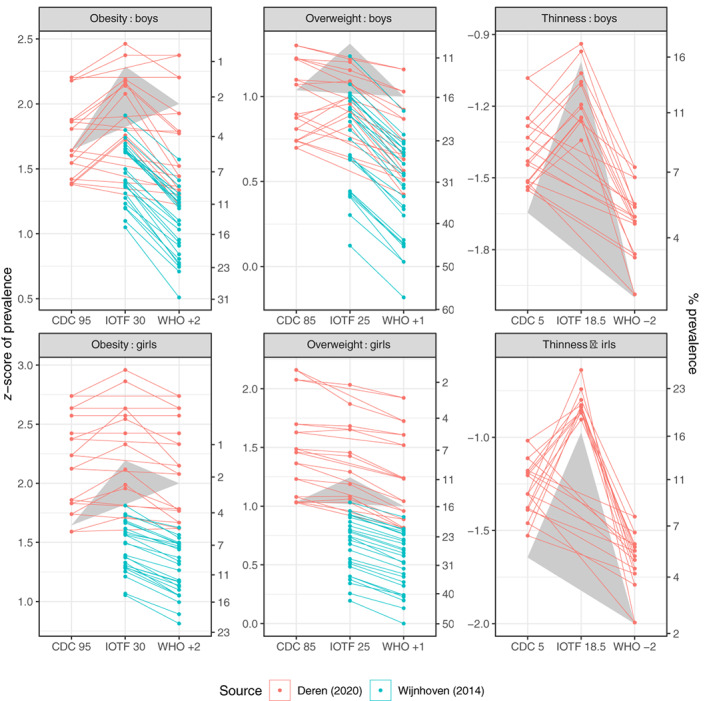
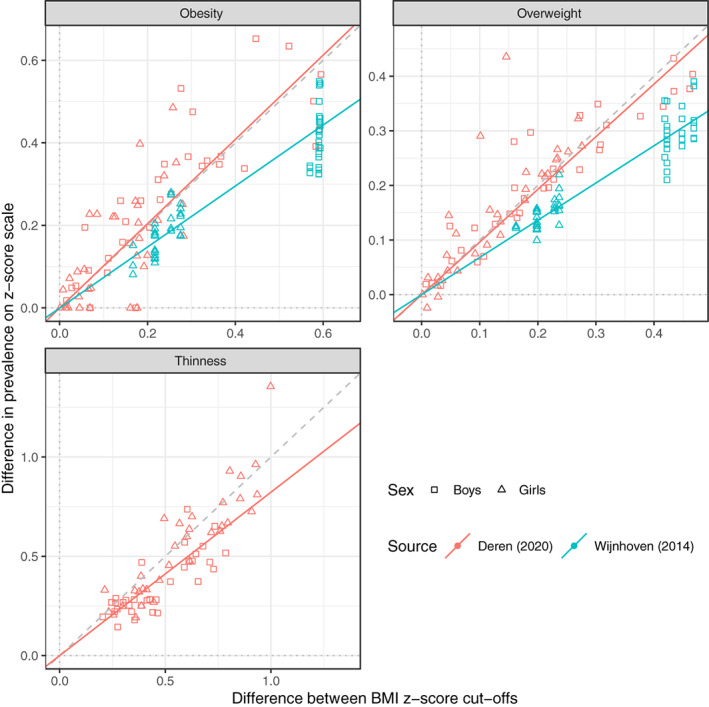
Methods: The cut-offs are defined as age-sex-specific BMI z-scores, for example, WHO +1 SD for overweight. To convert an age-sex-specific prevalence rate based on reference cut-off A to the corresponding prevalence based on reference cut-off B, first back-transform the z-score cut-offs and to age-sex-specific BMI cut-offs, then transform the BMIs to z-scores and using the opposite reference. These z-scores together define the distance between the two cut-offs as the z-score difference . Prevalence in the target group based on cut-off A is then transformed to a z-score, adjusted up or down according to and back-transformed, and this predicts prevalence based on cut-off B. The algorithm's performance was tested on 74 groups of children from 14 European countries.
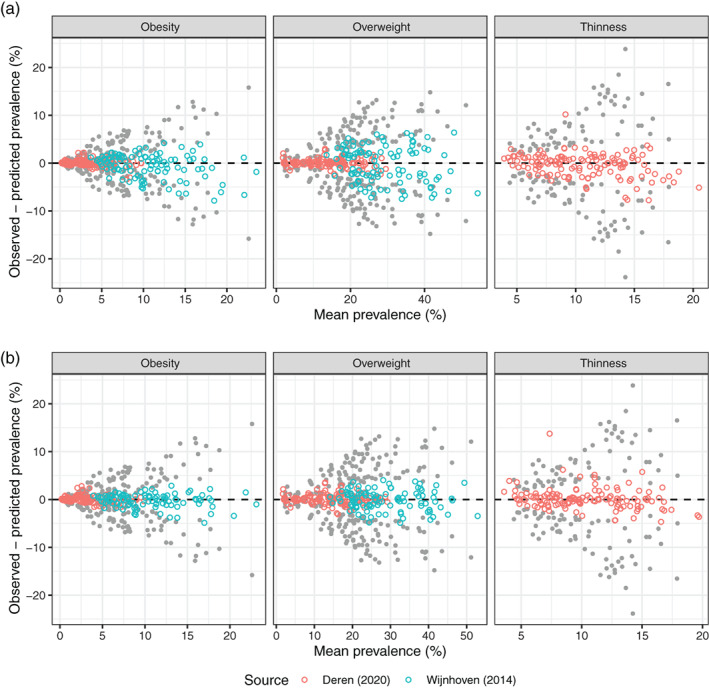
Results: The algorithm performed well. The standard deviation (SD) of the difference between pairs of prevalence rates was 6.6% (n = 604), while the residual SD, the difference between observed and predicted prevalence, was 2.3%, meaning that the algorithm explained 88% of the baseline variance.
Conclusions: The algorithm goes some way to addressing the problem of harmonizing overweight and obesity prevalence rates for children aged 2-18.
Keywords: IOTF; WHO; harmonization; obesity; overweight; prevalence.
© 2022 The Authors. Pediatric Obesity published by John Wiley & Sons Ltd on behalf of World Obesity Federation.
Conflict of interest statement
Tim J. Cole declares the following conflicts of interest: he developed the LMS method with Peter Green and was first author on papers describing the IOTF cut‐offs., , Tim Lobstein was also an author on the latter paper.
Figures
References
-
- WHO . Obesity: preventing and managing the global epidemic. Report of a WHO Consultation Geneva, 3–5 June 1997. WHO/NUT/98.1. WHO; 1998. - PubMed
-
- Garrow JS, Webster J. Quetelet's index (W/H2) as a measure of fatness. Int J Obes (Lond). 1985;9:147‐153. - PubMed
-
- Cole TJ. Method for assessing age‐standardized weight‐for‐height in children seen cross‐sectionally. Ann Hum Biol. 1979;6:249‐268. - PubMed
MeSH terms
LinkOut - more resources
Full Text Sources
Medical
