

Identification of bovine respiratory disease through the nasal microbiome
- PMID: 35193707
- PMCID: PMC8862248
- DOI: 10.1186/s42523-022-00167-y
Identification of bovine respiratory disease through the nasal microbiome
Abstract
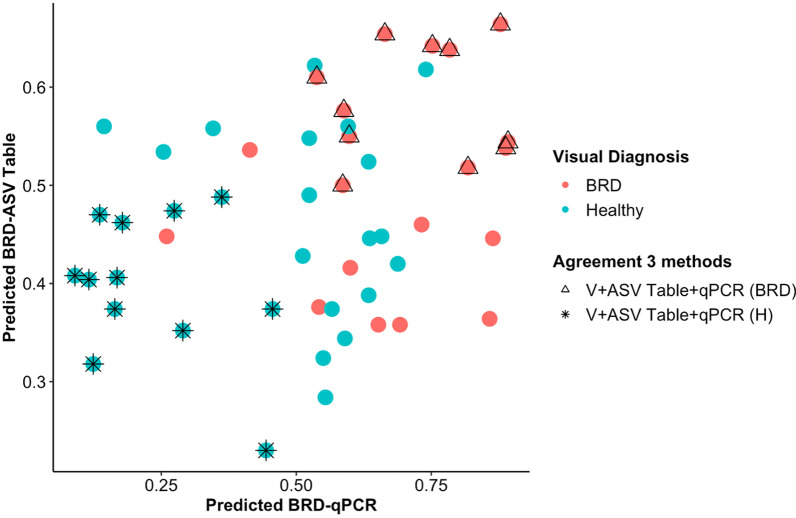
Background: Bovine respiratory disease (BRD) is an ongoing health and economic challenge in the dairy and beef cattle industries. Multiple risk factors make an animal susceptible to BRD. The presence of Mannheimia haemolytica, Pasteurella multocida, Histophilus somni, and Mycoplasma bovis in lung tissues have been associated with BRD mortalities, but they are also commonly present in the upper respiratory tract of healthy animals. This study aims to compare the cattle nasal microbiome (diversity, composition and community interaction) and the abundance of BRD pathogens (by qPCR) in the nasal microbiome of Holstein steers that are apparently healthy (Healthy group, n = 75) or with BRD clinical signs (BRD group, n = 58). We then used random forest models based on nasal microbial community and qPCR results to classify healthy and BRD-affected animals and determined the agreement with the visual clinical signs. Additionally, co-occurring species pairs were identified in visually BRD or healthy animal groups.
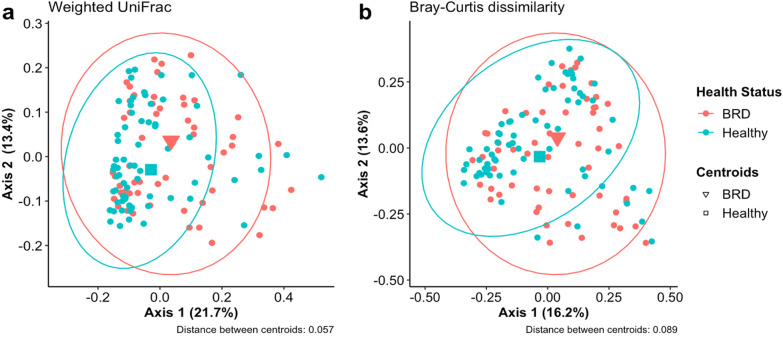
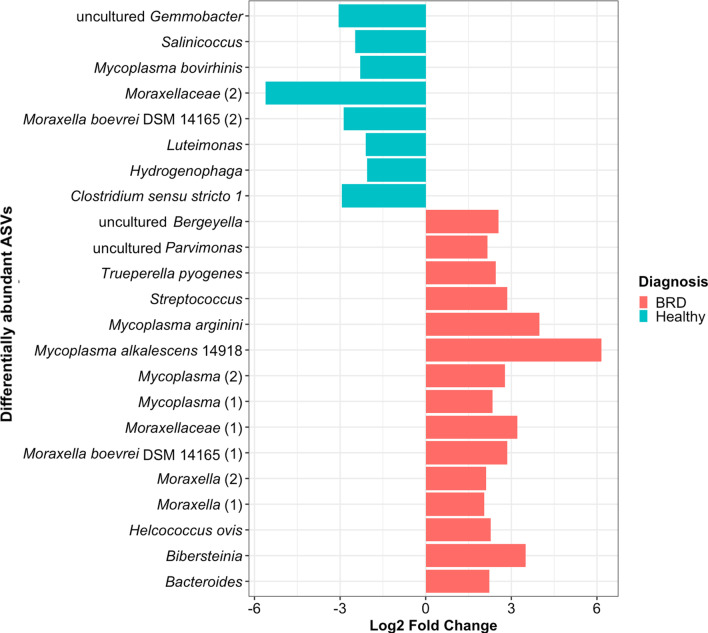
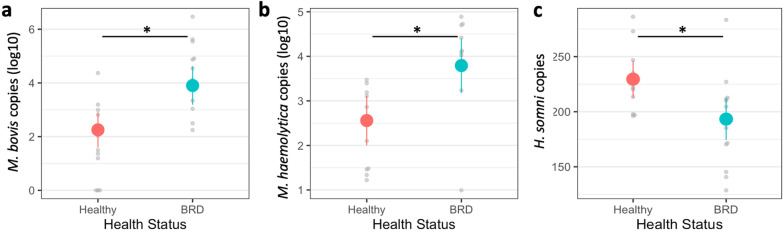
Results: Cattle in the BRD group had lower alpha diversity than pen-mates in the healthy group. Amplicon sequence variants (ASVs) from Trueperella pyogenes, Bibersteinia and Mycoplasma spp. were increased in relative abundance in the BRD group, while ASVs from Mycoplasma bovirhinis and Clostridium sensu stricto were increased in the healthy group. Prevalence of H. somni (98%) and P. multocida (97%) was high regardless of BRD clinical signs whereas M. haemolytica (81 and 61%, respectively) and M. bovis (74 and 51%, respectively) were more prevalent in the BRD group than the healthy group. In the BRD group, the abundance of M. haemolytica and M. bovis was increased, while H. somni abundance was decreased. Visual observation of clinical signs agreed with classification by the nasal microbial community (misclassification rate of 32%) and qPCR results (misclassification rate 34%). Co-occurrence analysis demonstrated that the nasal microbiome of BRD-affected cattle presented fewer bacterial associations than healthy cattle.
Conclusions: This study offers insight into the prevalence and abundance of BRD pathogens and the differences in the nasal microbiome between healthy and BRD animals. This suggests that nasal bacterial communities provide a potential platform for future studies and potential pen-side diagnostic testing.
Keywords: 16S rRNA gene; Bovine respiratory disease; Cattle nasal microbiome; qPCR.
© 2022. The Author(s).
Conflict of interest statement
The authors declare the following competing financial interest(s): M.S.V. has interests in Krishi LLC, a company interested in licensing on-farm diagnostics technology. The work performed here was not funded by Krishi LLC.
Figures


References
-
- Chirase NK, Greene LW. Influence of oral natural interferon-alpha on performance and rectal temperature of newly received beef steers. American Society of Animal Science; 2000.
-
- Vogel GJ, Bokenkroger CD, Rutten-Ramos SC, Bargen JL. A retrospective evaluation of animal mortality in US feedlots: rate, timing, and cause of death. Bov Pract. 2015;49:113–123. doi: 10.21423/bovine-vol49no2p113-123. - DOI
-
- Edward AJ. Respiratory disease in feedlot cattle in the central USA. Bov Pract. 1996;30:5–7.
Grants and funding
LinkOut - more resources
Full Text Sources
Miscellaneous