. 2022 Feb;10(2):e003663.
doi: 10.1136/jitc-2021-003663.

Loss of YTHDF1 in gastric tumors restores sensitivity to antitumor immunity by recruiting mature dendritic cells

Affiliations

Loss of YTHDF1 in gastric tumors restores sensitivity to antitumor immunity by recruiting mature dendritic cells

Xiaowu Bai et al. J Immunother Cancer. 2022 Feb.

Abstract

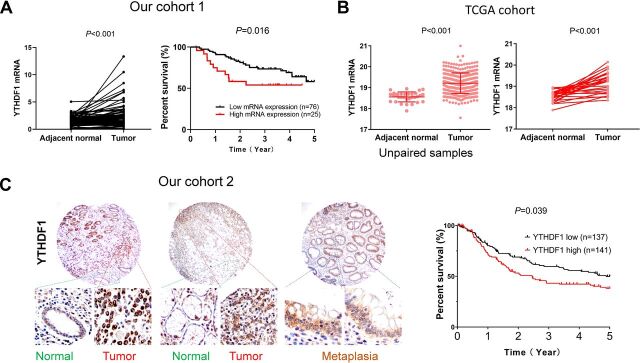
Background: Gastric cancer (GC) is one of the most common cancer worldwide. We analyzed the expression of m6A regulatory genes in GC cohorts and revealed that YTHDF1 was uniquely upregulated in GC as compared with adjacent normal tissues. In this study, we analyzed the role of YTHDF1 in GC cells and modulation of the tumor immune microenvironment.

Methods: Three GC cohorts (cohort 1, n=101; cohort 2, n=278, and the Cancer Genome Atlas cohort, n=375) were analyzed for YTHDF1 expression. Function of YTHDF1 in GC was determined in GC cell lines. Role of YTHDF1 in antitumor immunity was investigated in allograft models.

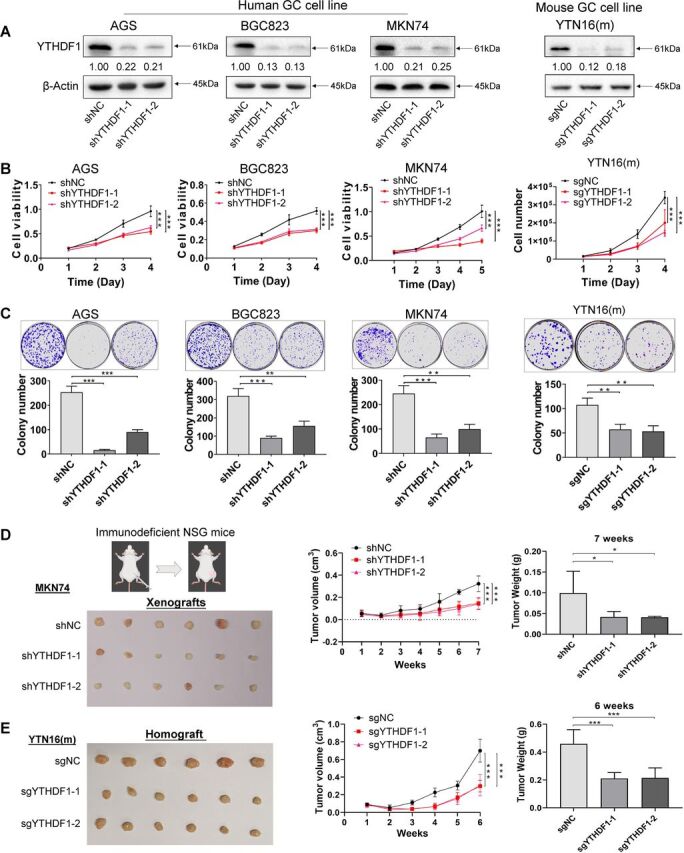
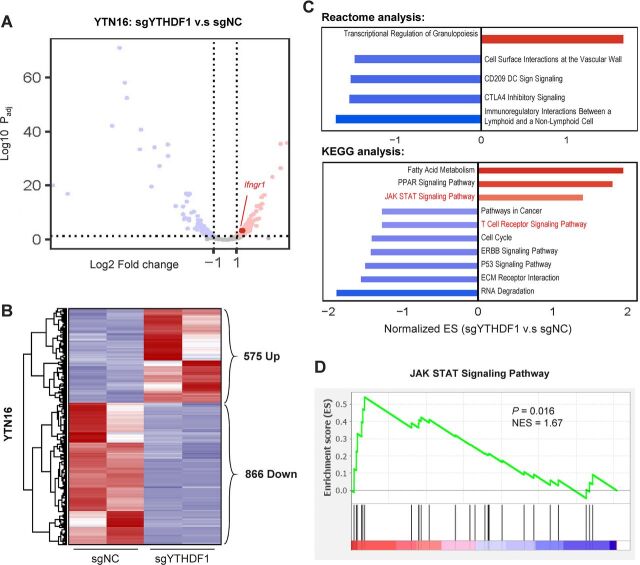
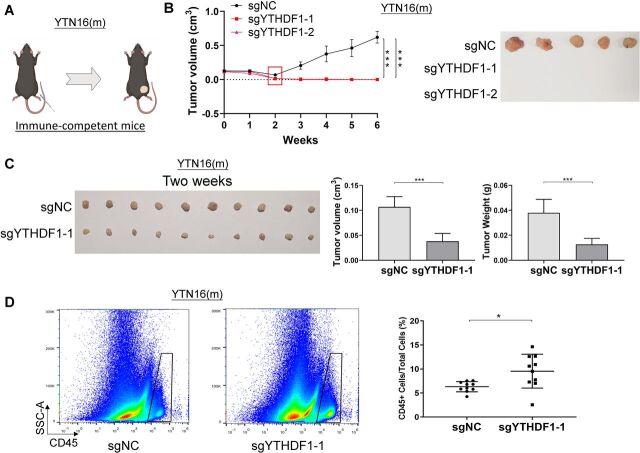
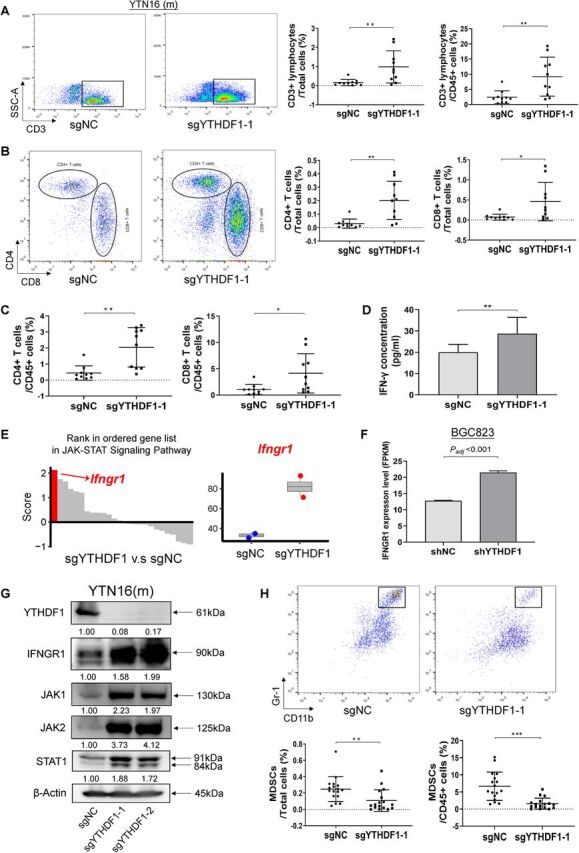
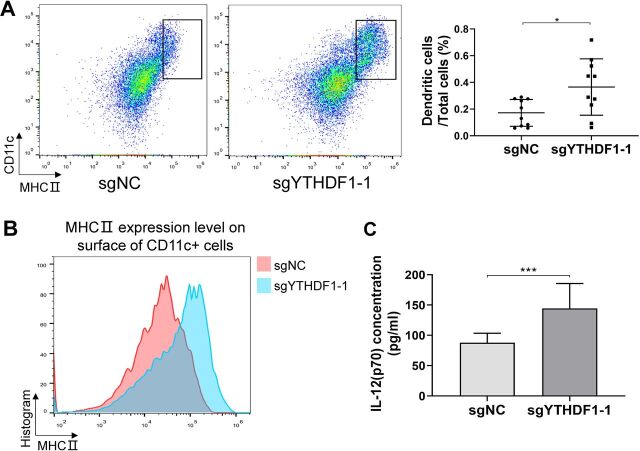
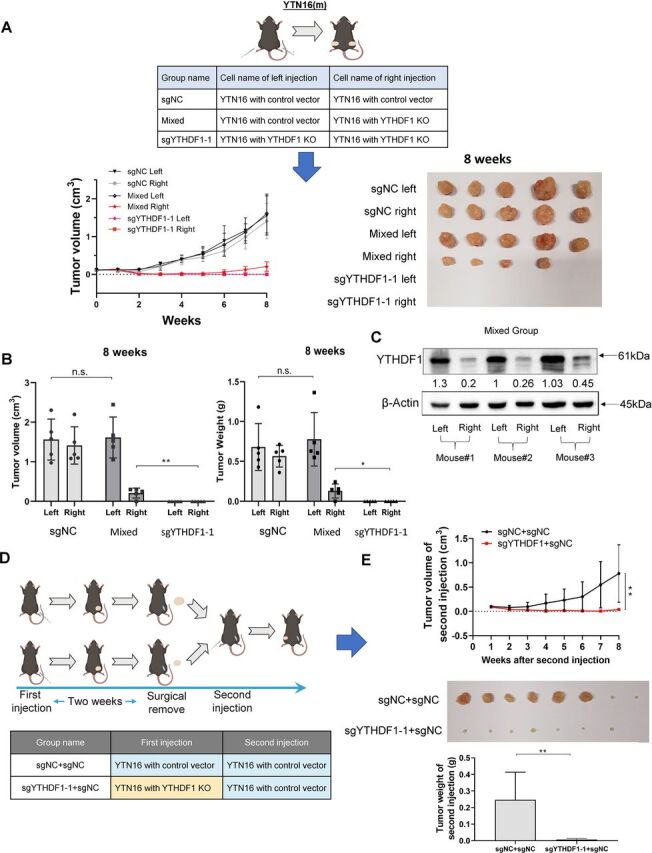
Results: YTHDF1 is upregulated in GC compared with adjacent normal tissues, and high YTHDF1 expression was correlated with poor survival of patients with GC at mRNA (p=0.016) and protein levels (p=0.039). Loss of YTHDF1 in human (AGS, BGC823, MKN74) or mouse (YTN16) GC cell lines inhibited cell growth and colony formation in vitro. Strikingly, syngeneic YTN16 tumors with loss of YTHDF1 underwent complete remission in immunocompetent mice, while a lesser effect was found in immunodeficient mice. Consistently, YTHDF1 loss in GC tumors led to recruitment of mature dendritic cells (DCs) with increased MHCII expression and interleukin-12 (IL-12) secretion, which in turn, promoted CD4+ and CD8+ T cells infiltration with increased interferon-γ (IFN-γ) secretion. Loss of YTHDF1 mediated the overexpression of IFN-γ receptor 1 and JAK/STAT1 signaling pathway in tumor cells, which might contribute to restored sensitivity to antitumor immunity. In addition, pre-emptive exposure of YTN16 tumors with YTHDF1 loss triggered a potent antitumor immune response on rechallenge with wild-type YTN16 cells, implying that YTHDF1 loss induced a lasting systemic antitumor immunity.

Conclusions: YTHDF1 is overexpressed in GC and promotes GC by inducing cell proliferation and repression of DCs-mediated antitumor immune response. YTHDF1 is a promising therapeutic target for GC treatment.

Keywords: dendritic cells; immunotherapy.


Conflict of interest statement

Competing interests: None declared.

Figures

Figure 1
Figure 1
YTHDF1 is overexpressed in GC and its expression is associated with poor survival of patients with GC. (A) Comparison of YTHDF1 mRNA levels between paired GC tumor tissues and adjacent normal tissues from our GC cohort 1 (n=101) and YTHDF1 mRNA expression predicts worse survival using Gehan-Breslow-Wilcoxon test. (B) Comparison of YTHDF1 mRNA levels in TCGA GC cohort (overall cohort: adjacent normal: n=32, tumor: n=375; paired samples: n=27). (C) YTHDF1 protein expression predicts worse survival in patients with GC using Gehan-Breslow-Wilcoxon test. Representative images of TMA in our cohort 2. GC, gastric cancer; TMA, tissue microarray.
Figure 2
Figure 2
Loss of YTHDF1 in GC cell lines suppresses growth in vitro and tumor growth in immunodeficient mice. (A) Knockdown or knockout of YTHDF1 protein in AGS, BGC823, MKN74, and YTN16 cell lines were confirmed by western blot. (B) Cell viability was determined in GC cell lines with YTHDF1 knockdown or knockout by MTT assay or cell counting. (C) Colony formation assay of GC cells with YTHDF1 knockdown or knockout. (D) MKN74 cells (5×10⁶ cells per tumor) expressing control vector or YTHDF1-shRNA were injected into the right dorsal flanks of NSG mice (n=6 for each group). Mice were sacrificed 7 weeks after injection. Representative tumor images, tumor volume, and tumor weight were shown. (E) YTN16 cells (5×10⁶ cells per tumor) with control vector or knockout of YTHDF1 were injected into the right dorsal flanks of NSG mice (n=6 for each group). Mice were sacrificed 6 weeks after injection. Representative tumor images, tumor volume, and tumor weight were shown. *P<0.05; **p<0.01; ***p<0.001. GC, gastric cancer; NSG, NOD.Cg-Prkdcscid Il2rgtm1Wjl/SzJ.
Figure 3
Figure 3
RNA-sequencing of YTN16 cells with loss of YTHDF1 reveals differential regulation of immune-related pathways. (A) Volcano plot and (B) heatmap analysis showing differentially regulated genes in YTHDF1 knockout YTN16 cells. (C) Gene set enrichment analysis of YTN16 (sgYTHDF1 vs sgNC) cells using Reactome and KEGG databases. (D) JAK-STAT signaling pathway was enriched after YTHDF1 knockout in YTN16 cells.
Figure 4
Figure 4
Loss of YTHDF1 induces tumor elimination in syngeneic GC tumors in immunocompetent mice with increased immune cell infiltration. (A) YTN16 cells (5×10⁶ cells per tumor) with control vector or YTHDF1 knockout were injected into the right dorsal flanks of C57BL/6 mice (n=5 for each group). (B) Tumors were measured weekly prior to sacrifice at 6 weeks after injection. Tumor volume and representative tumor images were shown. (C) Control and YTHDF1 knockout YTN16 tumors were harvested at 2 weeks after injection (n=10 for each group). Representative tumor images, tumor volume, and tumor weight were shown. (C) Flow cytometry analysis of infiltrating CD45 positive cells in YTN16 tumors by flow cytometry. The proportion of infiltrating immune cells (CD45+ cells) in the tumors was significantly higher in YTHDF1 knockout group than that in the control group. *P<0.05; ***p<0.001.
Figure 5
Figure 5
Loss of YTHDF1 in tumor cells activates the adaptive antitumor immunity. (A) Representative images of CD3+ lymphocytes infiltration in the YTN16 tumor by flow cytometry, expressed as the percentage of whole tumor or infiltrating immune cell (CD45+) population. (B) Representative images of infiltrating CD4+ T cells and CD8+ T cells by flow cytometry, expressed as the percentage of whole tumor. (C) CD4+ T cells and CD8+ T cells expressed as the percentage of infiltrating immune cell (CD45+) population. (D) Levels of IFNγ in tumors from control and YTHDF1 knockout YTN16 groups. (E) Rank in ordered gene list in JAK-STAT signaling pathway enriched in YTN16 cells with YTHDF1 knockout. The top induced gene in this pathway was Ifngr1. (F) IFNGR1 mRNA expression of BGC823 cell in RNA-sequencing data between two groups. (G) Western blot of IFNGR1 and JAK/STAT1 signaling molecules in GC cells. (H) Representative images of infiltrating MDSCs by flow cytometry, expressed as the percentage of whole tumor or infiltrating immune cell (CD45+) population. *P<0.05; **p<0.01, ***p<0.001. IFN, interferon.
Figure 6
Figure 6
Loss of YTHDF1 in tumor cells recruited more mature DCs in tumors. (A) Representative images of infiltrating DCs as determined by flow cytometry, expressed as the percentage of whole tumor cells. (B) The intensity of surface MHCII molecules in CD11c+ cells by flow cytometry. (C) Levels of IL-12(p70) concentration in tumors between two groups. *P<0.05; ***p<0.001. DC, dendritic cell.
Figure 7
Figure 7
YTHDF1 expression in GC tumor cells exert systemic effects on host antitumor immunity. (A) YTN16 cells (5×10⁶ cells per tumor) with control vector or YTHDF1 knockout were injected into dorsal flanks of C57BL/6 mice (n=5 for each group) as indicated. Tumors were measured weekly prior to sacrifice at 8 weeks after cell injection. Tumor images were shown. (B) Tumor volume and tumor weight measurements suggested that the growth of YTHDF1 knockout tumors in the mixed group was significantly increased compared with that in sgYTHDF1-1 only group (right tumor in mixed group vs right tumor in sgYTHDF1-1 group). (C) Protein expression of YTHDF1 of the left-side and right-side tumors in the mixed group. (D) Mice were divided into two groups and injected the YTN16 cells with or without YTHDF1 into the right dorsal flanks of mice (n=8 for each group). After 2 weeks, tumors were surgically completely removed and YTN16 cells with control vector were injected into left dorsal flanks of both groups of mice. (E) Tumor growth on the left dorsal flank was monitored weekly. YTN16 tumor growth with control vector on the left dorsal flank was impaired in mice previously injected with YTN16 knockout tumors (sgYTHDF1−1+sgNC) as compared with those injected with control tumors (sgNC +sgNC). *P<0.05; **p<0.01.

References

    1. Yue B, Song C, Yang L, et al. . METTL3-mediated N6-methyladenosine modification is critical for epithelial-mesenchymal transition and metastasis of gastric cancer. Mol Cancer 2019;18:142. 10.1186/s12943-019-1065-4 - DOI - PMC - PubMed
    1. Pi J, Wang W, Ji M, et al. . YTHDF1 promotes gastric carcinogenesis by controlling translation of FZD7. Cancer Res 2021;81:2651–65. 10.1158/0008-5472.CAN-20-0066 - DOI - PubMed
    1. Chen X-Y, Liang R, Yi Y-C. The M6a reader YTHDF1 facilitates the tumorigenesis and metastasis of gastric cancer via USP14 translation in an m6A-dependent manner. Front Cell Dev Biol 2021;9:647702. 10.3389/fcell.2021.647702 - DOI - PMC - PubMed
    1. Yamamoto M, Nomura S, Hosoi A, et al. . Established gastric cancer cell lines transplantable into C57BL/6 mice show fibroblast growth factor receptor 4 promotion of tumor growth. Cancer Sci 2018;109:1480–92. 10.1111/cas.13569 - DOI - PMC - PubMed
    1. Kang W, Tong JHM, Chan AWH, et al. . Yes-associated protein 1 exhibits oncogenic property in gastric cancer and its nuclear accumulation associates with poor prognosis. Clin Cancer Res 2011;17:2130–9. 10.1158/1078-0432.CCR-10-2467 - DOI - PubMed

Publication types