. 2022 Mar 8;119(10):e2114069119.
doi: 10.1073/pnas.2114069119.

Growing impact of wildfire on western US water supply

Affiliations

Growing impact of wildfire on western US water supply

A Park Williams et al. Proc Natl Acad Sci U S A. .

Abstract

Streamflow often increases after fire, but the persistence of this effect and its importance to present and future regional water resources are unclear. This paper addresses these knowledge gaps for the western United States (WUS), where annual forest fire area increased by more than 1,100% during 1984 to 2020. Among 72 forested basins across the WUS that burned between 1984 and 2019, the multibasin mean streamflow was significantly elevated by 0.19 SDs (P < 0.01) for an average of 6 water years postfire, compared to the range of results expected from climate alone. Significance is assessed by comparing prefire and postfire streamflow responses to climate and also to streamflow among 107 control basins that experienced little to no wildfire during the study period. The streamflow response scales with fire extent: among the 29 basins where >20% of forest area burned in a year, streamflow over the first 6 water years postfire increased by a multibasin average of 0.38 SDs, or 30%. Postfire streamflow increases were significant in all four seasons. Historical fire-climate relationships combined with climate model projections suggest that 2021 to 2050 will see repeated years when climate is more fire-conducive than in 2020, the year currently holding the modern record for WUS forest area burned. These findings center on relatively small, minimally managed basins, but our results suggest that burned areas will grow enough over the next 3 decades to enhance streamflow at regional scales. Wildfire is an emerging driver of runoff change that will increasingly alter climate impacts on water supplies and runoff-related risks.

Keywords: climate change; streamflow; wildfire.


Conflict of interest statement

The authors declare no competing interest.

Figures

Fig. 1.
Fig. 1.
Effect of forest fire on water year streamflow. (A) Map of 72 burned (orange) and 107 unburned (green) basins (basins <1,000 km2 are indicated with a dot at the gauge location). Red arrow indicates Johnson Creek, ID (B and C). (B) Observed versus estimated water year runoff ratio for Johnson Creek, ID (blue line indicates prefire regression line). (C) Water year streamflow offset (ΔQ) at Johnson Creek. (D) Average ΔQ among burned basins in years prior to (blue bars), during (clear bar), and after (orange bars) each basin’s fire year. (E) Same as D but for multiyear means leading up to and following each basin’s fire year (e.g., year 6 is the mean of years 1 to 6 postfire). Black vertical lines indicate 90% bounds on means. Blue dashed lines indicate inner 90% when each basin’s ΔQ is replaced with 10,000 synthetic time series with prefire variance. Green area indicates inner 90% of 10,000 repetitions with unburned basins.
Fig. 2.
Fig. 2.
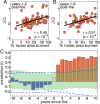
Proportion of forest area burned affects postfire runoff boost. Interbasin regression of the streamflow offset (ΔQ) averaged over the first (A) 2 and (B) 6 y postfire against the logarithm of the percentage of each basin’s forest area that burned in the fire year. (C) Interbasin correlation when repeating the analysis for other multiyear periods leading up to (blue bars) and after (orange bars) the fire year (clear bar). Blue dashed lines bound the inner 90% of correlation values when each basin’s ΔQ is replaced with 10,000 synthetic time series of ΔQ with prefire variance. Green area bounds the inner 90% of 10,000 repetitions with unburned basins. In A and B, years 1 to 2 and years 1 to 6 are shown because years 1 to 2 are when the all-basin mean streamflow enhancement is first significantly positive (Fig. 1E), and years 1 to 6 represent the full postfire period when all-basin mean streamflow was positive in all years (Fig. 1D).
Fig. 3.
Fig. 3.
Multiyear mean water year and seasonal streamflow offsets in heavily burned basins. Streamflow offsets (ΔQ) averaged across only basins where >20% of forest area burned for (A) the water year and (BE) the four seasons. Bars indicate multiyear means leading up to (blue) and after (dark red) the fire year (clear). Black vertical lines indicate 90% bounds on means. (F) Dark red bars indicate multibasin median streamflow offset averaged across years 1 to 6 postfire, expressed as percent of estimated total water year (WY) streamflow for the WY and each season: OND, JFM, AMJ, and JAS. Black vertical lines indicate 90% bounds on medians. Blue dashed lines in AE and blue vertical areas in F bound the inner 90% when each basin’s ΔQ is replaced with 10,000 synthetic time series with prefire variance. Green background in AE and green vertical areas in F bound the inner 90% of 10,000 repetitions with unburned basins.
Fig. 4.
Fig. 4.
Effect of forest fire on multidecade streamflow in heavily burned basins. (A) The 10-y running mean of observed (dark red) and estimated (blue) standardized water year streamflow (Q) anomalies (σ) averaged across 29 heavily burned basins. (B) Mean 2000 to 2021 streamflow offset (ΔQ) in heavily burned basins (dark red bar) and 90% confidence interval (vertical black line). Blue areas in A and B bound the inner 90% of 10,000 repetitions with synthetic time series with prefire variance. Green area in B bound the inner 90% of 10,000 repetitions with random unburned basins. Green horizontal line in B indicates unburned basin mean.
Fig. 5.
Fig. 5.
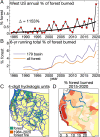
Recent forest fire increases. (A) Percentage of WUS forest area burned annually: 1984 to 2020. Trend line calculated by applying the Theil Sen linear trend estimator to the logarithm of percent area burned (Delta is relative trend line change). (B) The 6-y running percentage of forest burned in the 179 basins considered in this study (purple) and across the whole WUS (brown). (C) Map of boundaries of the WUS four-digit hydrologic units where ≥10% of precipitation falls in forested area overlaid on map of forest (green), 1984 to 2020 burned areas (orange), and nonforest (yellow). (D) Map of % forest area burned during 2015 to 2020 within the hydrologic units shown in B. Boundaries of three major river basins are overlaid: Sacramento/San Joaquin/Tulare (light blue), Columbia (dark blue), and upper Colorado (green).
Fig. 6.
Fig. 6.
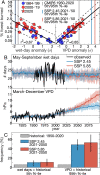
Potential for rapid growth of forest fire area. (A) Scatterplot of annual WUS percent forest area burned (log-scale y axis) versus standardized anomalies of (Left) frequency of May to September wet days and (Right) mean March to December VPD overlaid on vertical lines indicating CMIP6 multimodel mean (Left) 5th and (Right) 95th percentiles calculated over 1950 to 2020 (gray) and 2021 to 2050 (blue and red) for the Shared Socioeconomic Pathway (SSP) 2.45 and SSP 5.85 scenarios, respectively. Black solid and dashed lines indicate observed regression line and 95% prediction interval, respectively (r2 values are squared Person’s correlation between each climate variable and the logarithm of annual forest area burned). (B) Time series of observed (black) and CMIP6 (blue and red) (Top) May to September wet day frequency and (Bottom) March to December VPD. (C) Frequency of years during 1950 to 2020 (gray) and 2021 to 2050 (blue and red) when models project (Left) May to September wet day frequency to be lower than and (Right) March to December VPD to be higher than the 5th and 95th percentiles, respectively, of historical (1950 to 2020) variability. In B and C, CMIP6 values represent multimodel means (bold lines) and interquartiles (shading) for the SSP 2.45 (blue) and SSP 5.85 (red) scenarios.

References

    1. Overpeck J., Udall B., Dry times ahead. Science 328, 1642–1643 (2010). - PubMed
    1. Lund J., Medellin-Azuara J., Durand J., Stone K., Lessons from California’s 2012–2016 drought. J. Water Resour. Plan. Manag. 144, 04018067 (2018).
    1. Barnett T. P., et al. , Human-induced changes in the hydrology of the western United States. Science 319, 1080–1083 (2008). - PubMed
    1. Cook B. I., et al. , Uncertainties, limits, and benefits of climate change mitigation for soil moisture drought in southwestern North America. Earth’s Future 9, e2021EF002014 (2021).
    1. Andréassian V., Waters and forests: From historical controversy to scientific debate. J. Hydrol. (Amst.) 291, 1–27 (2004).