. 2022 Feb 22;119(8):e2114186119.
doi: 10.1073/pnas.2114186119.

Biocompatible surface functionalization architecture for a diamond quantum sensor

Affiliations

Biocompatible surface functionalization architecture for a diamond quantum sensor

Mouzhe Xie et al. Proc Natl Acad Sci U S A. .

Abstract

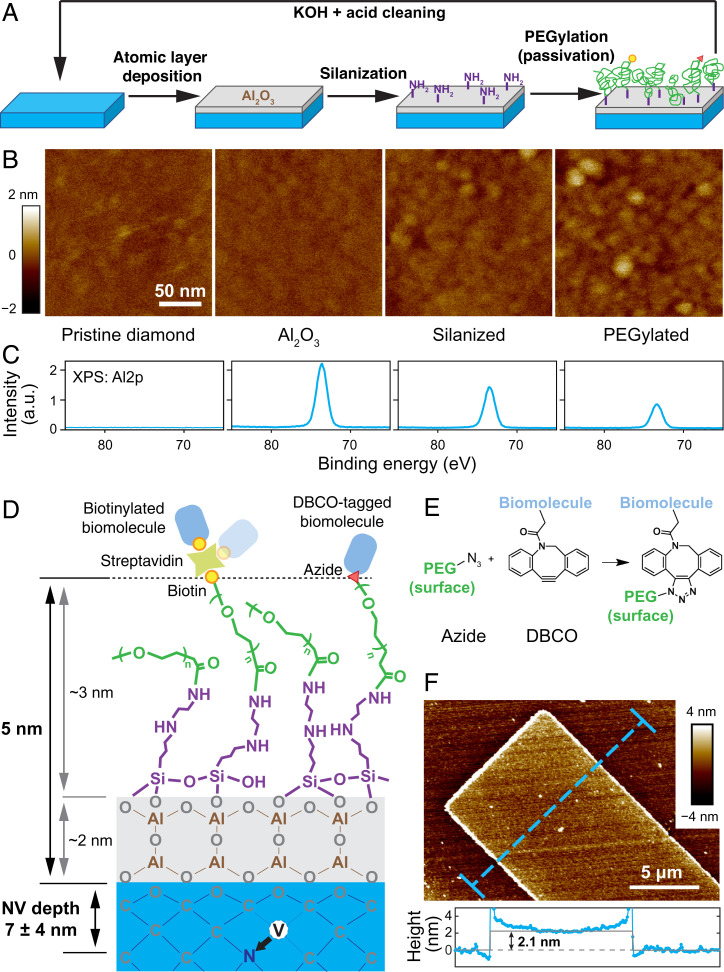
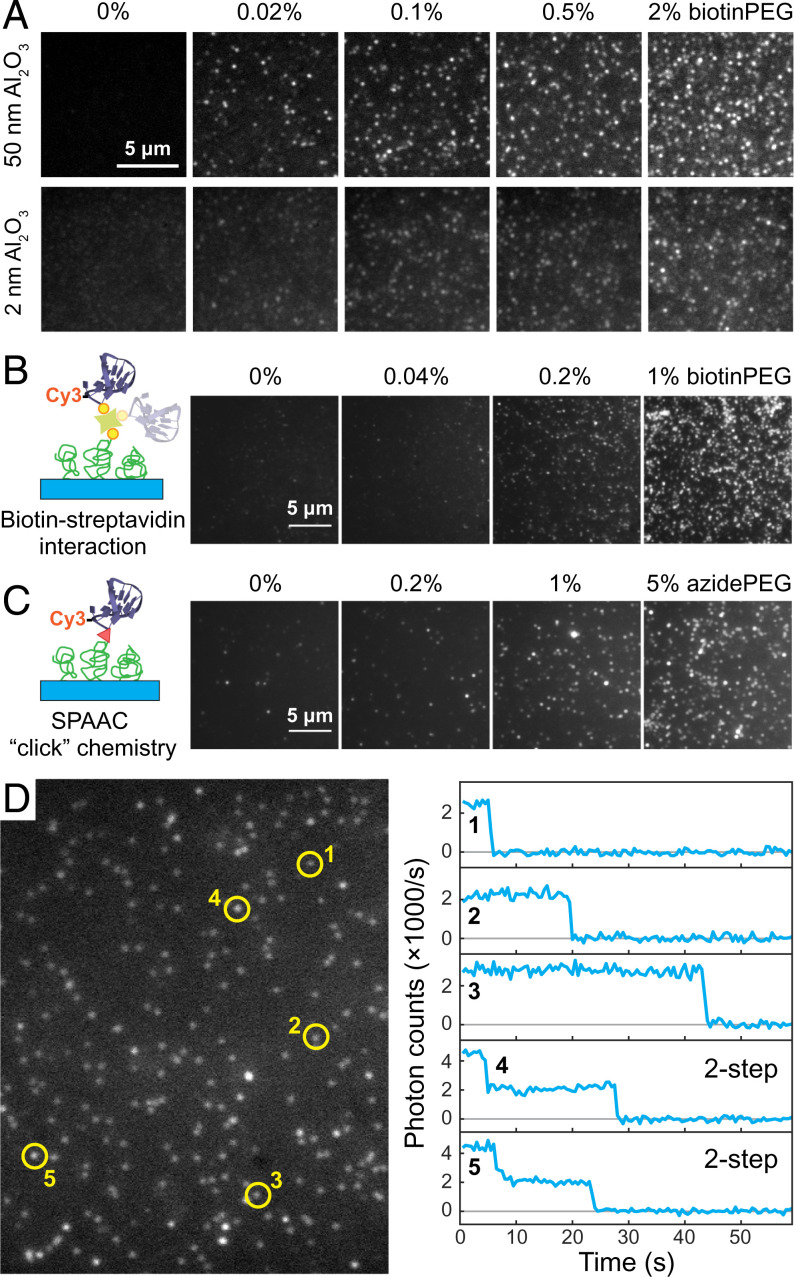
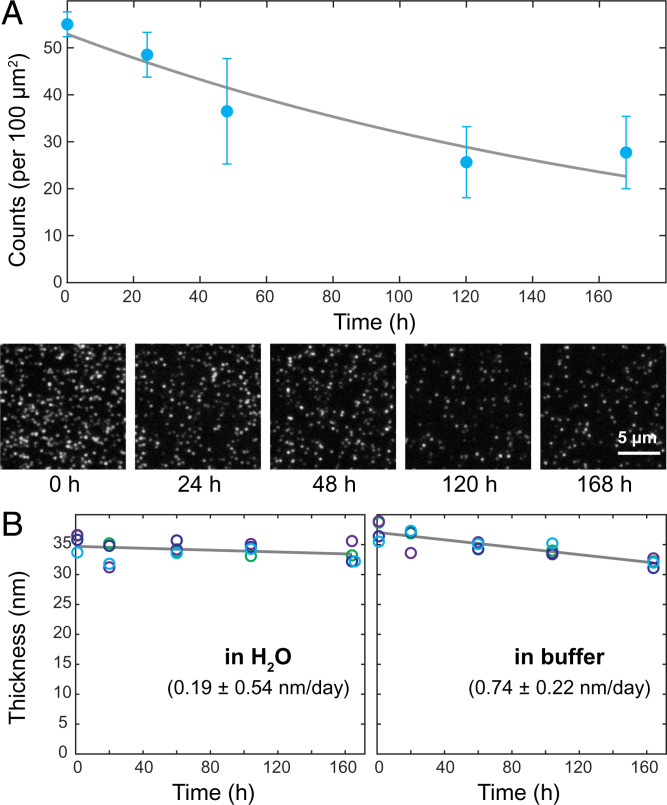
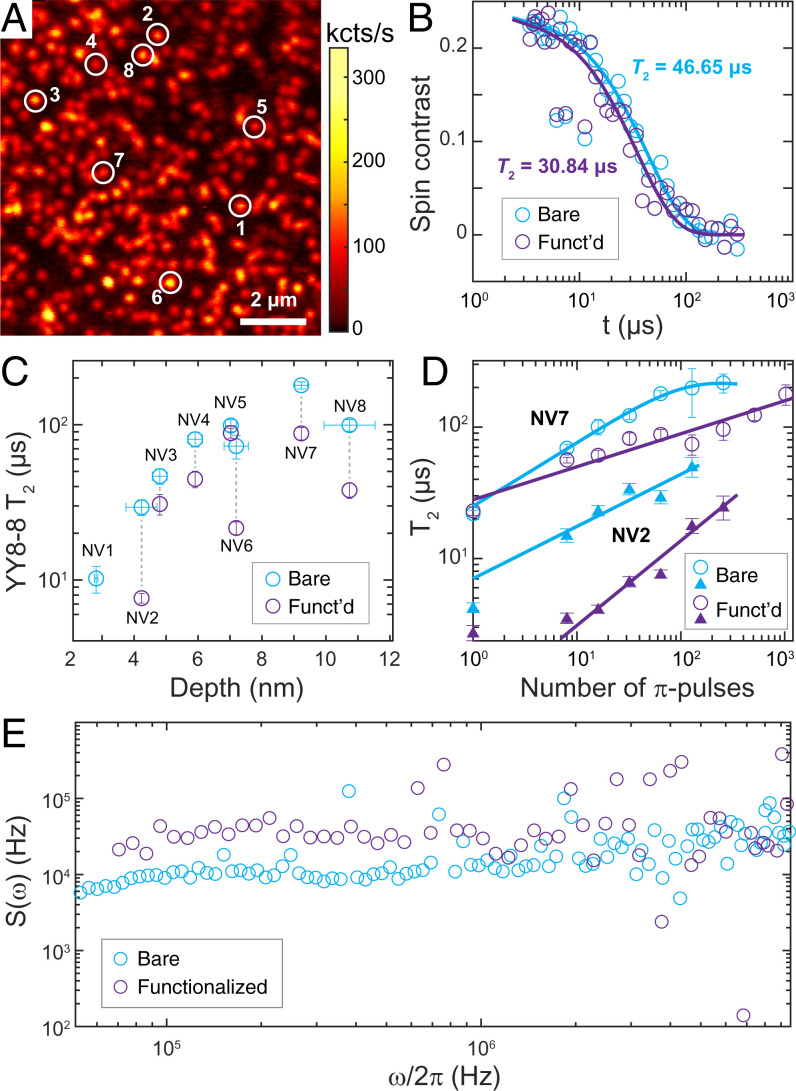
Quantum metrology enables some of the most precise measurements. In the life sciences, diamond-based quantum sensing has led to a new class of biophysical sensors and diagnostic devices that are being investigated as a platform for cancer screening and ultrasensitive immunoassays. However, a broader application in the life sciences based on nanoscale NMR spectroscopy has been hampered by the need to interface highly sensitive quantum bit (qubit) sensors with their biological targets. Here, we demonstrate an approach that combines quantum engineering with single-molecule biophysics to immobilize individual proteins and DNA molecules on the surface of a bulk diamond crystal that hosts coherent nitrogen vacancy qubit sensors. Our thin (sub-5 nm) functionalization architecture provides precise control over the biomolecule adsorption density and results in near-surface qubit coherence approaching 100 μs. The developed architecture remains chemically stable under physiological conditions for over 5 d, making our technique compatible with most biophysical and biomedical applications.

Keywords: NV center; biocompatible functionalization; diamond surface modification; quantum sensing.


Conflict of interest statement

Competing interest statement: The authors have filed a provisional patent application for the diamond functionalization process described in this manuscript.

Figures

Fig. 1.
Fig. 1.
Architecture and characterization of the diamond functionalization approach. (A) Schematic illustration of the functionalization process. A thin layer of Al2O3 (gray) was deposited to the pristine, oxygen-terminated diamond surfaces (blue), followed by silanization (purple) and PEGylation (green). Functional groups (biotin, yellow circle; azide, red triangle) allow for cross-linking with target biomolecules. AFM characterization of the surfaces (B) and XPS Al2p signal after each step of the functionalization (C). (D) Illustration of the overall chemical functionalization architecture (not to scale), with corresponding thicknesses. (E) Illustration of SPAAC reaction. (F) A lithographically fabricated Al2O3 pattern on the diamond surface by lift-off, with a thickness of ∼2.1 nm. The Al2O3 layer is uniform without the presence of pin holes. The elevated edges originate from lift-off combined with ALD deposition.
Fig. 2.
Fig. 2.
Single-molecule characterization of fluorescently labeled biomolecules immobilized on diamond surfaces. (A) Fluorescence images of the immobilized SA-488 molecules for various biotinPEG percentages (0, 0.02, 0.1, 0.5, and 2%) and two different Al2O3 thickness (50 nm, imaged in buffer, and 2 nm, imaged in a refraction index = 1.42 Invitrogen Antifade medium). (B and C) Immobilization of a Cy3-ssDNA on diamond surfaces. This is achieved via either biotin–streptavidin interaction (B) or SPAAC (C). (D) A representative area of single-molecule fluorescence images of in B and the time traces of five selected fluorescence spots.
Fig. 3.
Fig. 3.
Time stability of the functionalization architecture in a physiological relevant environment. (A) Number of SA-488 molecules per 100-μm2 area (blue circles) detected by single-molecule fluorescence microscopy as a function of storage time in sodium phosphate buffer (pH 7.4, [NaH2PO4 + Na2HPO4] = 50 mM, [NaCl] = 100 mM) over a course of 1 wk. Each data point is based on three 2,800-μm2 field-of-view areas; error bars indicate one SD. Fit is an exponential decay. Representative single-molecule microscopy images on a 50-nm-thick Al2O3 layer are displayed at the bottom. (B) The overall thicknesses of the functional layer prepared on a 35-nm-thick, lithographically patterned Al2O3 structure in H2O (Left) and sodium phosphate buffer (Right) were tracked by AFM over a course of 1 wk at room temperature. Four unique sites (circles of the same color) were monitored for each sample, and the mean values were fitted to a linear model (gray), which allowed us to estimate the dissolution rates.
Fig. 4.
Fig. 4.
Impact of functionalization on NV electron spin coherence. (A) Confocal scan of near-surface NV centers (implantation energy 3 keV). The eight NV centers studied for their coherence times are marked by circles. (B) Typical time trace of coherence measured by a (YY-8)N=8 sequence before (blue) and after (purple) functionalization for NV center number 3 (depth 4.8 nm). T2 times are based on the fitted, stretched exponential decays (solid lines). (C) T2 measured by (YY-8)N=8 pulse sequence (total of 64 π-pulses) plotted against NV depth before (blue) and after (purple) functionalization. Depth calibration was performed following ref . (D) T2 times as a function of number of π-pulses for NV number 2 (depth 4.2 nm, triangles) and NV number 7 (depth 9.2 nm, open circles) before (blue) and after (purple) functionalization. Solid lines are fits based on Eqs. 1 and 2. (E) Spectral decomposition manifests a broadband noise spectrum across the frequency range of 0.05 to 10 MHz for NV number 7. All measurements were carried out at 1,750-G magnetic field strength.

References

    1. Lovchinsky I., et al. , Nuclear magnetic resonance detection and spectroscopy of single proteins using quantum logic. Science 351, 836–841 (2016). - PubMed
    1. Shi F., et al. , Protein imaging. Single-protein spin resonance spectroscopy under ambient conditions. Science 347, 1135–1138 (2015). - PubMed
    1. Shi F., et al. , Single-DNA electron spin resonance spectroscopy in aqueous solutions. Nat. Methods 15, 697–699 (2018). Correction in: Nat. Methods 15, 749 (2018). - PubMed
    1. Schmitt S., et al. , Submillihertz magnetic spectroscopy performed with a nanoscale quantum sensor. Science 356, 832–837 (2017). - PubMed
    1. Boss J. M., Cujia K. S., Zopes J., Degen C. L., Quantum sensing with arbitrary frequency resolution. Science 356, 837–840 (2017). - PubMed

MeSH terms

LinkOut - more resources