. 2022 Feb 22;13(1):863.
doi: 10.1038/s41467-022-28426-1.

High-throughput identification and quantification of single bacterial cells in the microbiota

Affiliations

High-throughput identification and quantification of single bacterial cells in the microbiota

Jianshi Jin et al. Nat Commun. .

Abstract

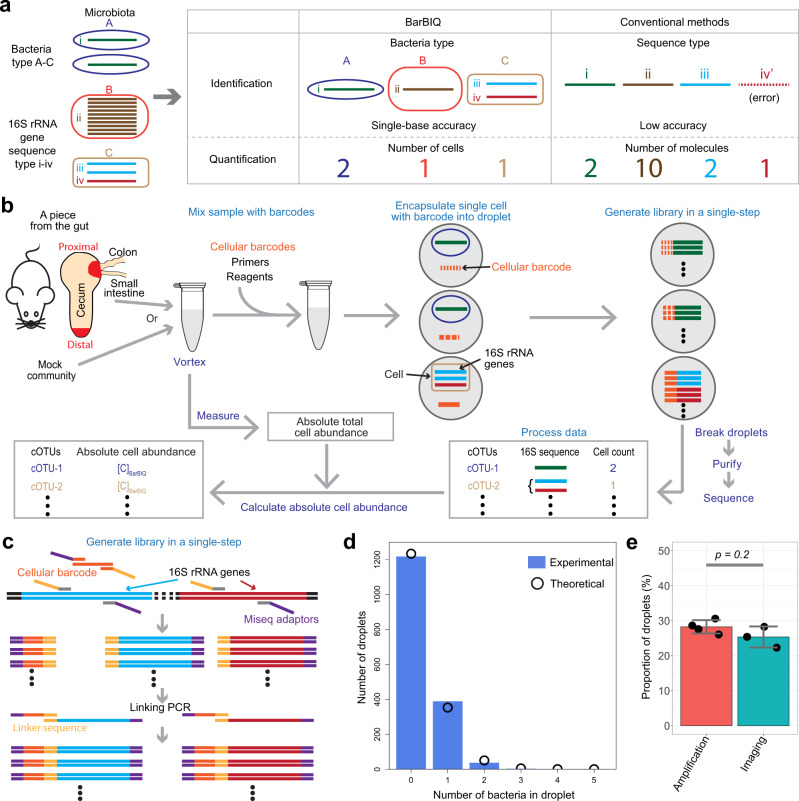
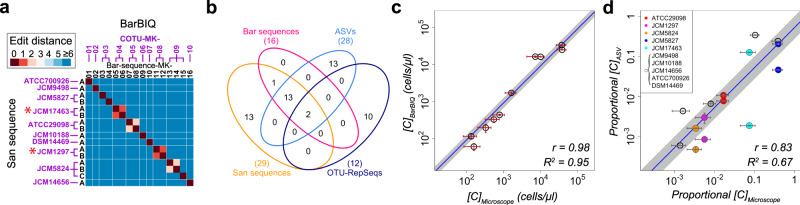
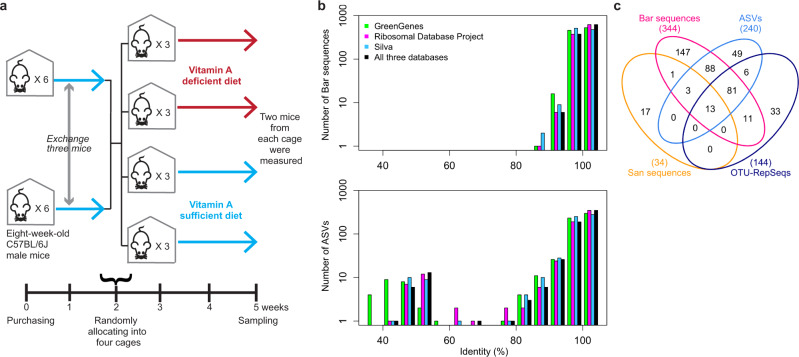
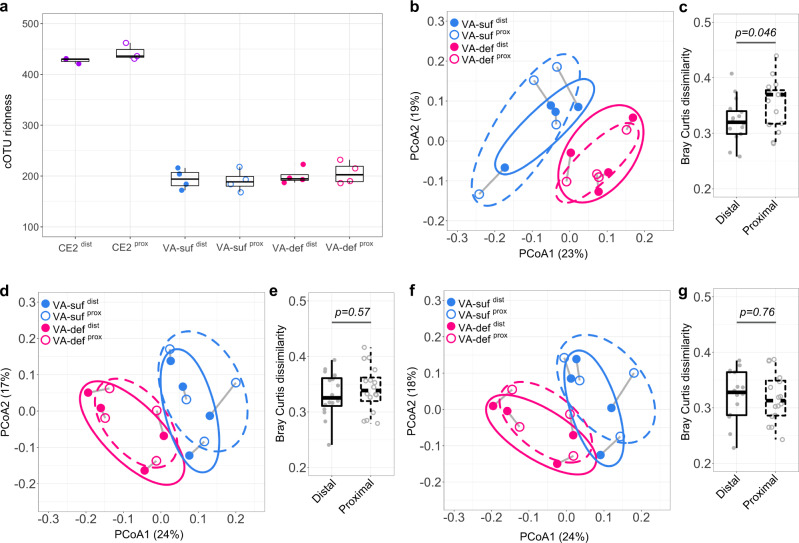
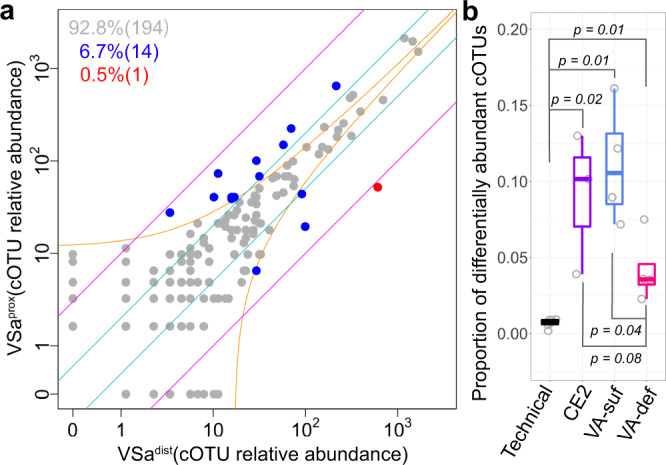
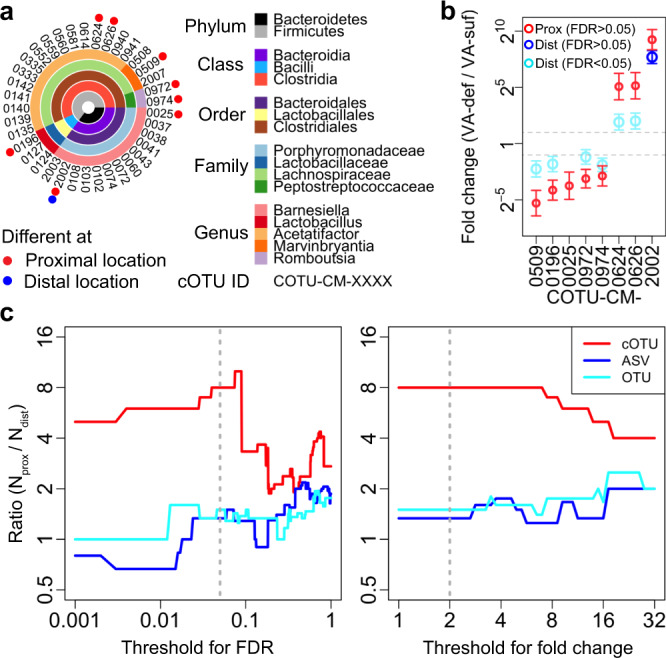
The bacterial microbiota works as a community that consists of many individual organisms, i.e., cells. To fully understand the function of bacterial microbiota, individual cells must be identified; however, it is difficult with current techniques. Here, we develop a method, Barcoding Bacteria for Identification and Quantification (BarBIQ), which classifies single bacterial cells into taxa-named herein cell-based operational taxonomy units (cOTUs)-based on cellularly barcoded 16S rRNA sequences with single-base accuracy, and quantifies the cell number for each cOTU in the microbiota in a high-throughput manner. We apply BarBIQ to murine cecal microbiotas and quantify in total 3.4 × 10⁵ bacterial cells containing 810 cOTUs. Interestingly, we find location-dependent global differences in the cecal microbiota depending on the dietary vitamin A deficiency, and more differentially abundant cOTUs at the proximal location than the distal location. Importantly, these location differences are not clearly shown by conventional 16S rRNA gene-amplicon sequencing methods, which quantify the 16S rRNA genes, not the cells. Thus, BarBIQ enables microbiota characterization with the identification and quantification of individual constituent bacteria, which is a cornerstone for microbiota studies.


Conflict of interest statement

K.S., J.J., and R.Y. are co-inventors on a patent application based on this work filed by RIKEN. The other authors declare no competing interests.

Figures

Fig. 1
Fig. 1. BarBIQ and its quality controls.
a Main concept of BarBIQ and its comparison with conventional 16S rRNA gene-amplicon sequencing methods. b Schematic of BarBIQ. After the sample was suspended in a solution, vortexing was performed to break the clumps of bacteria. Cellular barcodes, DNA molecules containing random bases and primed sites for amplification; primers, DNA primers for amplification of both 16S rRNA genes and cellular barcodes, for linking both amplified products, and for attaching sequencing adapters; reagents, reagents for DNA amplification. Details for the schematics for library generation, purification, and sequencing are shown in Supplementary Fig. 4, and details for the data processing are shown in Supplementary Fig. 5. c Schematic of the library generation in a droplet. Both a cellular barcode and 16S rRNA genes (V3–V4 region, ~450 bases) in a bacterial genome in a drop were initially amplified by primers containing sequencing adapters and a linker sequence. Subsequently, the amplified barcodes were linked with the amplified 16S rRNA genes via the linker sequence. The DNA length is not to scale. d Comparison between the distribution of the number of bacteria in droplets (bars) observed by microscopic imaging (Supplementary Fig. 2) and the theoretical distribution (dots) calculated based on Poisson distribution. e Comparison between the proportion of droplets in which the 16S rRNA gene(s) in bacteria were amplified by ddPCR (Supplementary Note 1) and the proportion of droplets in which bacteria were observed by microscopic imaging (Supplementary Fig. 2); the droplets for both experiments were generated with the same cecal sample and with the same dilution factor. Data are presented as mean values ± SD (n = 4 for amplification, n = 3 for imaging). P value was calculated by the Kruskal-Wallis rank-sum test. Source data for (d) and (e) are provided as a Source Data file.
Fig. 2
Fig. 2. Efficacy of BarBIQ for the mock community and comparison with the conventional methods.
a Comparison of the 16S rRNA sequences identified by Sanger sequencing and by BarBIQ. Edit distance, Levenshtein distance, defined as the minimum number of substitutions, insertions, and deletions; San sequence, Sanger sequencing-identified 16S rRNA sequence; ATCC/JCM/DSM <number>, strain ID; A, B, or C, San sequences for each strain; Bar-sequence-MK-<number>, BarBIQ-identified sequences (Bar sequences); COTU-MK-<number>, cell-based operational taxonomy units (cOTUs); red star, Bar sequences that had one base difference. Source data are provided as a Source Data file. b Comparison (Venn diagram) among San sequences identified from each of the ten strains, Bar sequences, amplicon sequence variants (ASVs), and the representative sequences of operational taxonomy units (OTU-RepSeqs) identified from the mock community. Circle, total sequences from each method; numbers in circles, number of unique or identical sequences detected by the given method(s); numbers in the parentheses, total number of sequences detected by the given method. c Comparison of the absolute cell abundance per unit volume of 10 strains in the mock community measured by BarBIQ ([C]BarBIQ) (Supplementary Data 6) and by microscopic imaging ([C]Microscope) (Supplementary Table 1). Data are presented as mean values ± SD (n = 3 for [C]BarBIQ, n = 5 for [C]Microscope). Blue thin line, a fitting line with a fixed slope of one in log scale (intercept: -0.035) by considering the standard errors of both [C]BarBIQ and [C]Microscope, indicating the averaged ratio [C]BarBIQ/[C]Microscope as 0.92;  gray thick line, 95% confidence interval of the fitted line, indicating the 95% confidence interval of the ratio [C]BarBIQ/[C]Microscope as 0.68~1.25; r, Pearson coefficient; R2, coefficient of determination. d Comparison of the proportional abundances of 15 ASVs in the mock community measured by Conv_ASV (proportional [C]ASV) (Supplementary Data 5) with the proportional [C]Microscope measured by microscopic imaging. Data are presented as mean values ± SD (n = 2 for proportional [C]ASV, n = 5 for proportional [C]Microscope). Strains that had commonly detected sequence(s) are shown. The strains that were compared with multiple identical ASVs are shown in colors. By the same fitting as c (intercept: −0.28), the averaged ratio of proportional [C]ASV and proportional [C]Microscope was 0.52, and its 95% confidence interval was 0.28–0.99.
Fig. 3
Fig. 3. Dietary vitamin A experimental design and identified 16S rRNA sequences of the murine cecal microbiotas.
a Schematic of the experimental design of the dietary vitamin A experiments (Methods). b Sequence identity profile of Bar sequences and ASVs; identity, the identity between each Bar sequence or ASV and its closest 16S rRNA sequence in three public databases: GreenGenes, Ribosomal Database Project, and Silva. Source data are provided in Supplementary Data 1 and 3. c Comparison (Venn diagram) among San sequences, Bar sequences, ASVs, and OTU-RepSeqs identified from the cell-sample at the proximal location of the mouse VDd. Numbers, same as Fig. 2b.
Fig. 4
Fig. 4. Highly reproducible quantification of BarBIQ and comparison with conventional methods.
a Comparison (dots) of the relative abundances of cOTUs between a pair of technical replicates (other pairs in Supplementary Fig. 12). Orange lines, theoretical confidential interval (99.9%) for sampling noise based on the Poisson distribution and normalization to the relative abundance (to the proportional abundance for b and c); cyan lines, 2-fold change; magenta lines, 10-fold change; blue dots, cOTUs that showed larger difference than that of the sampling noise and 2-fold change and was smaller than the 10-fold change; proportions and numbers in the parentheses, proportions and the numbers of dots in corresponding colors, respectively; CEa, mouse; dist and prox, locations; 1 and 2, technical replicates (see text). b Comparison between the proportional abundances of the common pairs of cOTUs and ASVs with all 16 cell-samples shown in the same format as a. Red dots, common pairs of cOTUs and ASVs that showed larger difference than the sampling noise and 10-fold change. c Comparison between the proportional abundances of the common pairs of cOTUs and OTUs with all 16 cell-samples shown in the same format as a and b. Source data are provided as a Source Data file.
Fig. 5
Fig. 5. cOTU richness and Bray-Curtis dissimilarity of the murine cecal microbiotas.
a The cOTU richness of each cell-sample determined by subsampling 6608 cells using the function rarefy in the R package Vegan. CE2, CE2 nutriment group; VA-suf, VA-sufficient group; VA-def, VA-deficient group; dist and prox, locations. b, d, and f, Principal coordinate analysis (PCoA) of Bray-Curtis dissimilarities calculated based on the relative cell abundances of cOTUs (b), ASVs (d), and OTUs (f) between each pair of cell-samples in the VA group. Labels, same as (a); gray line, linkage from the same mouse; circles, 95% confidence ellipses for each group. c, e, and g, Quantitative comparison of Bray-Curtis dissimilarities in b, d, and f, respectively. Distal, all possible pairs from VA-sufdist and VA-defdist, respectively; Proximal, all possible pairs from VA-sufprox and VA-defprox, respectively. Boxes in a, c, e, and g represent 25th to 75th percentiles (the interquartile range), horizontal black lines indicate medians, and whiskers show 1.5 times the interquartile range (n = 3 for CE2dist and CE2prox; n = 4 for VA-sufdist, VA-sufprox, VA-defdist, and VA-defprox; n = 16 for Distal and Proximal). P values were calculated by the Kruskal–Wallis rank-sum test. Source data are provided as a Source Data file.
Fig. 6
Fig. 6. Comparison of location-dependent relative cell abundance in each mouse.
a Comparison between the relative cell abundances of cOTUs detected from the distal location and proximal location of the mouse VSa, shown in Fig. 4a (other mice in Supplementary Fig. 16a). b Proportion of location-dependent differentially abundant cOTUs (differences were larger than the sampling noise and 2-fold) in each mouse. Technical, all pairs from three technical replicates within the distal and proximal locations for the mouse CEa; CE2, the mice in the CE2 nutriment group; VA-suf, the mice in the VA-sufficient group; VA-def, the mice in the VA-deficient group. Boxes represent 25th to 75th percentiles (the interquartile range), horizontal black lines indicate medians, and whiskers show 1.5 times the interquartile range (n = 6 for Technical, n = 3 for CE2, n = 4 for VA-suf and VA-def). P values were calculated by the Kruskal–Wallis rank-sum test. Source data are provided as a Source Data file.
Fig. 7
Fig. 7. Differential cell abundance of cOTUs depending on dietary vitamin A deficiency.
a The detected cOTUs and taxonomies (predicted by the RDP classifier, see Methods section). The genera that included at least one differentially abundant cOTU between the VA-sufficient and VA-deficient groups at either the distal or proximal location are shown (other in Supplementary Data 8). Different, FDR < 0.05 and fold change > 2. b The estimated fold changes (dots) and standard errors (error bars, n = 4) by DESeq2 between the VA-sufficient group (VA-suf) and VA-deficient group (VA-def) of the differentially abundant cOTUs (FDR < 0.05, fold change > 2) at either distal (Dist) or proximal (Prox) location. The differential analysis of COTU-CM-0025 at the distal location was not performed since its abundances were too low (Methods section). c The ratio between the number of differentially abundant cOTUs, ASVs, or OTUs at the proximal location (Nprox) and at the distal location (Ndist) as a function of threshold for FDR (left) and for fold change (right). FDR < 0.05 and a fold change > 2 (gray dotted lines) were considered “significant differences” in other analyses. Source data for (b) and (c) are provided as a Source Data file.

References

    1. Whitman WB, Coleman DC, Wiebe WJ. Prokaryotes: the unseen majority. Proc. Natl Acad. Sci. USA. 1998;95:6578–6583. - PMC - PubMed
    1. Sender R, Fuchs S, Milo R. Are we really vastly outnumbered? revisiting the ratio of bacterial to host cells in humans. Cell. 2016;164:337–340. - PubMed
    1. Hooper LV, Macpherson AJ. Immune adaptations that maintain homeostasis with the intestinal microbiota. Nat. Rev. Immunol. 2010;10:159–169. - PubMed
    1. Vandeputte D, et al. Quantitative microbiome profiling links gut community variation to microbial load. Nature. 2017;551:507–511. - PubMed
    1. Tolonen AC, Xavier RJ. Dissecting the human microbiome with single-cell genomics. Genome Med. 2017;9:56. - PMC - PubMed

Publication types