. 2022 Feb 22;13(1):1000.
doi: 10.1038/s41467-022-28632-x.

Multi-parameter photon-by-photon hidden Markov modeling

Affiliations

Multi-parameter photon-by-photon hidden Markov modeling

Paul David Harris et al. Nat Commun. .

Abstract

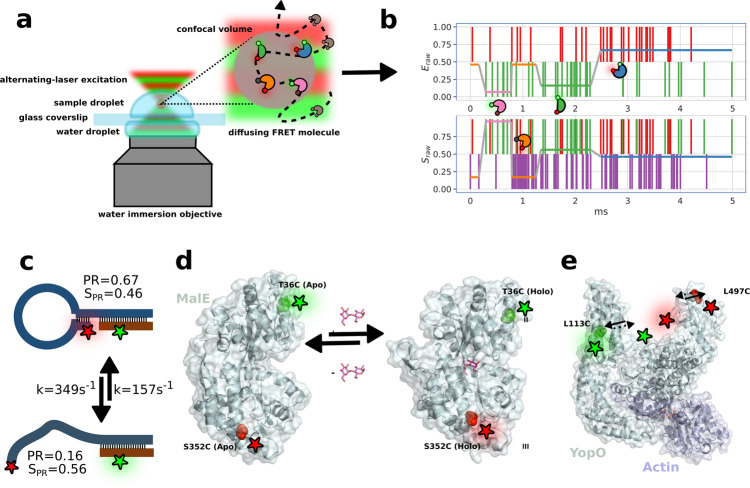
Single molecule Förster resonance energy transfer (smFRET) is a unique biophysical approach for studying conformational dynamics in biomacromolecules. Photon-by-photon hidden Markov modeling (H2MM) is an analysis tool that can quantify FRET dynamics of single biomolecules, even if they occur on the sub-millisecond timescale. However, dye photophysical transitions intertwined with FRET dynamics may cause artifacts. Here, we introduce multi-parameter H2MM (mpH2MM), which assists in identifying FRET dynamics based on simultaneous observation of multiple experimentally-derived parameters. We show the importance of using mpH2MM to decouple FRET dynamics caused by conformational changes from photophysical transitions in confocal-based smFRET measurements of a DNA hairpin, the maltose binding protein, MalE, and the type-III secretion system effector, YopO, from Yersinia species, all exhibiting conformational dynamics ranging from the sub-second to microsecond timescales. Overall, we show that using mpH2MM facilitates the identification and quantification of biomolecular sub-populations and their origin.


Conflict of interest statement

The authors declare no competing interests.

Figures

Fig. 1
Fig. 1. Cartoon representations of data acquisition, and biological systems examined in this work.
a Confocal microscope setup with inset illustrating the diffusive trajectory of a single molecule in and out of the confocal volume, undergoing conformational and photophysical changes, producing, b a photon time trace; photons represented by vertical bars, and the most likely state path according to the Viterbi algorithm overlayed as horizontal colored line. ce Biological systems studied: c DNA hairpin, d maltose binding protein MalE with structure-guided conformational changes, and e type III secretion effector YopO. See Supplementary Fig. 1 for a version of this figure with transition rates, Eraw and Sraw values included for the biological systems.
Fig. 2
Fig. 2. mpH2MM results for DNA hairpin at 300 mM NaCl.
a Burst variance analysis (BVA), the Eraw standard deviation of Eraw values of bursts is displayed versus their Eraw values. Bursts with Eraw standard deviations higher than expected solely from shot noise (semi-circle), indicate dynamic heterogeneity, such as within-burst FRET dynamics. Triangles indicate the average of standard deviation values per Eraw bin. b 2D histogram of Eraw and Sraw (E-S plots, colloquially) of bursts. The Eraw and Sraw values of sub-populations derived from mpH2MM are marked by red circles, and the Eraw and Sraw standard deviation of these values, derived from the Viterbi dwell time analysis, are marked by black crosses. c Comparison of values of the integrated complete likelihood (ICL) of spH2MM (top panel) and mpH2MM (bottom panel) of optimized models with different state models. The most likely state model is marked as a red star. d A sample burst trajectory, with photons represented as colored vertical bars, with donor excitation photons colored green and red for donor and acceptor, respectively. Acceptor excitation photons are colored purple. Eraw (top panel) and Sraw (bottom panel) of sub-populations determined from dwells using the Viterbi algorithm, are overlayed on the photon bars, and colored to indicate the state of the dwell. The border color also represents the type of burst. e, f E-S scatter plots of data processed by the Viterbi algorithm. Consecutive photons with the same state are considered as a single dwell, Eraw and Sraw values are then calculated as in Supplementary Eqs. 8 and 9, respectively. MpH2MM-derived sub-populations and Viterbi-derived Eraw and Sraw standard deviations (SD) are overlayed as red circles and black crosses, respectively. e, f E-S scatter plot of bursts e or dwells within bursts f, color coded by which states are present in the bursts (e) or according to the state of the dwell (dwell based Eraw and Sraw defined in Supplementary Eqs. 8 and 9, respectively) f, according to Viterbi algorithm. Color coding is the same throughout d, e, and f. Error bars (s.d.) in b, e, and f are the same, with n = 1232, 466, 3033, and 1493 dwells for the closed, dark donor, open, and dark acceptor states, respectively. See E-τD analysis in Supplementary Fig. 5, and more examples of bursts classified by the Viterbi algorithm in Supplementary Fig. 6.
Fig. 3
Fig. 3. Results for MalE.
Top row: BVA of concatenated dataset. Upper middle row: Eraw histogram of bursts. Lower middle row: E-S plot of bursts, with ICL-based selected results overlayed, red circles indicating the values derived from the ICL-based selected mpH2MM state model, and the black crosses the standard deviation of the Viterbi-derived dwell Eraw and Sraw values. Vertical blue lines represent the Eraw values of the states from the ICL-based selected spH2MM state model. Bottom row: Dwell based E-S plots as in Fig. 2, with transition rates (in units of s−1) between selected states indicated by arrows added. a apo MalE, b 1 μM maltose, c 1 m M maltose. Error bars (s.d.) for a: n = 1556, 3925, 3042, 8665 dwells for dark donor, dark acceptor, low FRET, and mid FRET states, respectively, for b n = 2505, 7753, 4793, 9083, 4010 dwells for dark donor, dark acceptor, low FRET, mid FRET, and high states FRET, respectively, for (c) n = 1586, 5539, 4196, 7550 dwells for dark donor, dark acceptor, low FRET, and high FRET states, respectively.
Fig. 4
Fig. 4. Results for YopO.
a, b Top row: BVA analysis. Upper middle row: Eraw histogram of bursts, lower middle row: E-S plot of bursts. Red dots indicate mpH2MM states. Bottom row: Dwell based E-S plots as in Fig. 2, with transition rates (in units of s−1) between selected states indicated by arrows added. Vertical bars indicate the Eraw values of the states for the BIC'-based spHEraw model. a apo YopO exhibiting sub-millisecond dynamics. b YopO with 60 μM actin exhibiting slower within-burst dynamics, and a shift toward the lower FRET conformation. Error bars (s.d.) for a n = 40,723, 89,613, 108,641, and 89,613 dwells for dark donor, dark acceptor, low FRET, and high FRET states respectively, for b n = 11,518, 9279, 31,100, and 3105 dwells for dark donor, dark acceptor, low FRET, and high FRET states, respectively.

References

    1. Lerner E, et al. Toward dynamic structural biology: Two decades of single-molecule Förster resonance energy transfer. Science. 2018;359:eaan1133. - PMC - PubMed
    1. Lerner E, et al. FRET-based dynamic structural biology: Challenges, perspectives and an appeal for open-science practices. eLife. 2021;10:e60416. - PMC - PubMed
    1. Schuler B, Hofmann H. Single-molecule spectroscopy of protein folding dynamics-expanding scope and timescales. Curr. Opin. Struct. Biol. 2013;23:36–47. - PubMed
    1. Aviram HY, et al. Direct observation of ultrafast large-scale dynamics of an enzyme under turnover conditions. Proc. Natl. Acad. Sci. 2018;115:3243–3248. - PMC - PubMed
    1. Mazal H, Haran G. Single-molecule FRET methods to study the dynamics of proteins at work. Curr. Opin. Biomed. Eng. 2019;12:8–17. - PMC - PubMed

Publication types

MeSH terms