Randomized Controlled Trial
. 2022 Feb 22;13(1):1003.
doi: 10.1038/s41467-022-28662-5.

Randomized controlled trial for time-restricted eating in healthy volunteers without obesity

Affiliations
Randomized Controlled Trial

Randomized controlled trial for time-restricted eating in healthy volunteers without obesity

Zhibo Xie et al. Nat Commun. .

Abstract

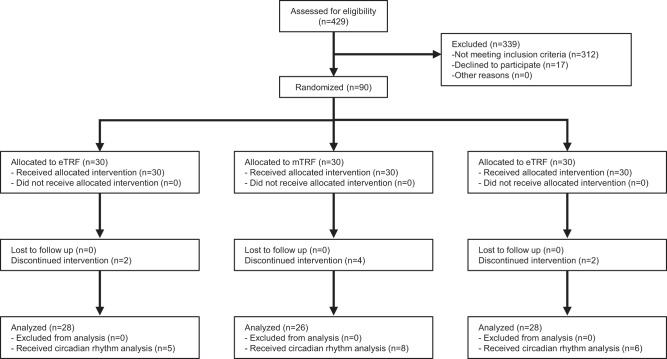
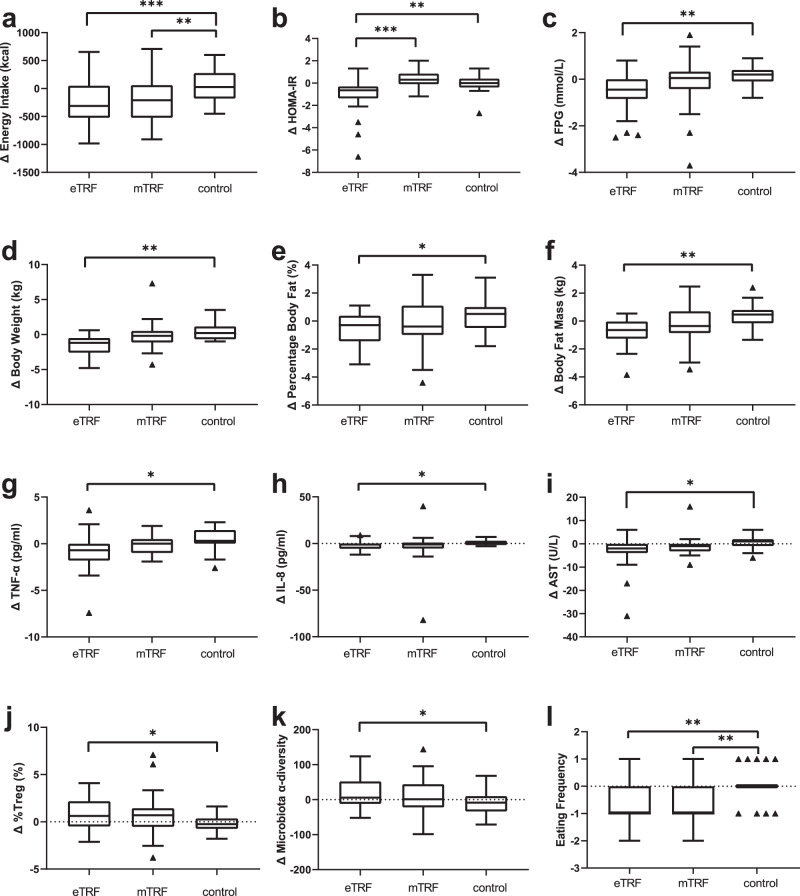
Time-restricted feeding (TRF) improves metabolic health. Both early TRF (eTRF, food intake restricted to the early part of the day) and mid-day TRF (mTRF, food intake restricted to the middle of the day) have been shown to have metabolic benefits. However, the two regimens have yet to be thoroughly compared. We conducted a five-week randomized trial to compare the effects of the two TRF regimens in healthy individuals without obesity (ChiCTR2000029797). The trial has completed. Ninety participants were randomized to eTRF (n=30), mTRF (n=30), or control groups (n=30) using a computer-based random-number generator. Eighty-two participants completed the entire five-week trial and were analyzed (28 in eTRF, 26 in mTRF, 28 in control groups). The primary outcome was the change in insulin resistance. Researchers who assessed the outcomes were blinded to group assignment, but participants and care givers were not. Here we show that eTRF was more effective than mTRF at improving insulin sensitivity. Furthermore, eTRF, but not mTRF, improved fasting glucose, reduced total body mass and adiposity, ameliorated inflammation, and increased gut microbial diversity. No serious adverse events were reported during the trial. In conclusion, eTRF showed greater benefits for insulin resistance and related metabolic parameters compared with mTRF. Clinical Trial Registration URL: http://www.chictr.org.cn/showproj.aspx?proj=49406 .


Conflict of interest statement

The authors declare no competing interests.

Figures

Fig. 1
Fig. 1. CONSORT Flow Diagram.
A total of 429 individuals were assessed for eligibility and 312 were excluded as they did not meet inclusion criteria, and 17 were excluded as they declined to participate. Ninety participants were randomized into one of three groups: eTRF, mTRF, or control, and baseline measures were assessed after randomization. During the 5-week intervention, eight participants (eTRF: n = 2; mTRF: n = 4; control: n = 2) dropped out due to dissatisfaction with the randomization result or for personal scheduling conflicts. Remaining 82 participants completed the trial and were included in the present analysis.
Fig. 2
Fig. 2. Energy intake and metabolic health-related parameters.
a Change in daily energy intake after 5 weeks of intervention, ***p < 0.001, **p = 0.009. b Change in insulin resistance index (measured with HOMA-IR) after 5 weeks of intervention, ***p < 0.001, **p = 0.002. c Change in fast plasma glucose (FPG) after 5 weeks of intervention, **p = 0.005; d Change in body mass after 5 weeks of intervention, **p = 0.009. e Change in percentage body fat after 5 weeks of intervention, *p = 0.042. f Change in body fat mass after 5 weeks of intervention, **p = 0.001. g Change in TNF-α (tumor necrosis factor-α) after 5 weeks of intervention, *p = 0.024. h Change in IL-8 (interleukin-8) after 5 weeks of intervention, *p = 0.045. i Change in AST (aspartate transaminase) after 5 weeks of intervention, *p = 0.046. j Change in plasma Tregs (T regulatory cells) after 5 weeks of intervention, *p = 0.038. k Change in gut microbiota α-diversity after 5 weeks of intervention, *p = 0.048. l Change in eating frequency after 5 weeks of intervention, **p = 0.001. n = 28 participants in eTRF group, n = 26 participants in mTRF group, n = 28 participants in control group. Data is visualized as Tukey box plots (line at mean, top of the box at the 75th percentile, bottom of the box at the 25th percentile, whiskers at the highest and lowest values, outliers shown as triangles beyond the whiskers). *p < 0.05, **p < 0.01, ***p < 0.001. One-way repeated measures ANOVA followed by Holm-Sidak’s multiple comparisons test for between group comparisons.
Fig. 3
Fig. 3. Only eTRF, but not mTRF, influenced the daily rhythms of plasma adipokine concentrations.
At baseline and at the end of the study, samples were collected from 19 participants (eTRF, n = 5; mTRF, n = 8; and control, n = 6). Plasma adipokine concentrations (resistin, leptin, and ghrelin) were measured at four time points. Two-way ANOVA analysis showed that eTRF (a, d, g) caused significant changes in the resistin concentration at 12:00 (p = 0.048) and 17:00 (p = 0.03) (a), and in the ghrelin concentration at 23:00 (p = 0.037) (g), but mTRF (b, e, h), or control groups (c, f, i) had no significant effects on the rhythm of adipokines. The values at each time point are displayed as the percentage of the mean value across all the time points and are displayed as means ± SEMs. Two-way repeated-measures ANOVA with time of day and feeding regimens as the two independent variables. ξp < 0.05 between baseline and follow-up at that time point. BL baseline, FU follow up.
Fig. 4
Fig. 4. TRF influences the daily rhythm amplitude of clock genes expression in peripheral blood mononuclear cells.
After Cosinor analysis, the amplitudes of clock gene expression in each individual were calculated. a The change in amplitude of clock genes after analyzed with Cosinor analysis in eTRF group. All participants in eTRF group showed an increase in the amplitude of SIRT1 after the trial. b The change in amplitude of clock genes after analyzed with Cosinor analysis in mTRF group. All participants in mTRF group showed an increase in the amplitude of PER2, but a decrease in that of PER1 after the trial. c The change in amplitude of clock genes after analyzed with Cosinor analysis in control group.

References

    1. Seconda L, et al. Assessment of the sustainability of the mediterranean diet combined with organic food consumption: an individual behaviour approach. Nutrients. 2017;9:61. - PMC - PubMed
    1. Kobayashi T, et al. Development of a food frequency questionnaire to estimate habitual dietary intake in Japanese children. Nutr. J. 2010;9:17. - PMC - PubMed
    1. Sutton EF, et al. Early time-restricted feeding improves insulin sensitivity, blood pressure, and oxidative stress even without weight loss in men with prediabetes. Cell Metab. 2018;27:1212–1221. - PMC - PubMed
    1. Hatori M, et al. Time-restricted feeding without reducing caloric intake prevents metabolic diseases in mice fed a high-fat diet. Cell Metab. 2012;15:848–860. - PMC - PubMed
    1. Ren J, et al. Alteration in gut microbiota caused by time-restricted feeding alleviate hepatic ischaemia reperfusion injury in mice. J. Cell. Mol. Med. 2019;23:1714–1722. - PMC - PubMed

Publication types