. 2022 Apr;19(4):540-553.
doi: 10.1038/s41423-022-00841-w. Epub 2022 Feb 22.

MEF2C promotes M1 macrophage polarization and Th1 responses

Affiliations

MEF2C promotes M1 macrophage polarization and Th1 responses

Xibao Zhao et al. Cell Mol Immunol. 2022 Apr.

Abstract

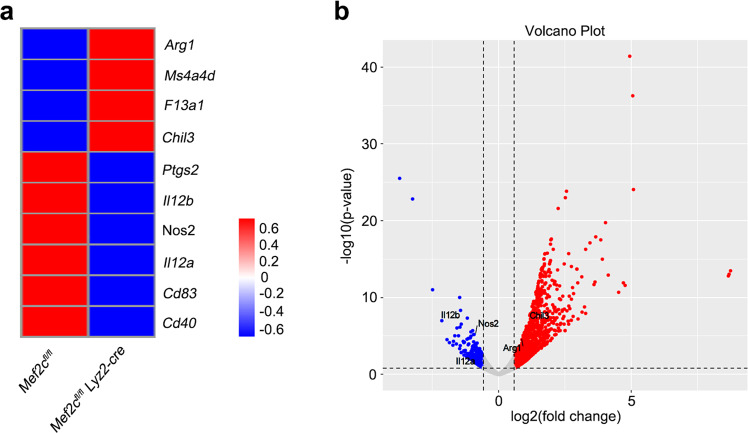
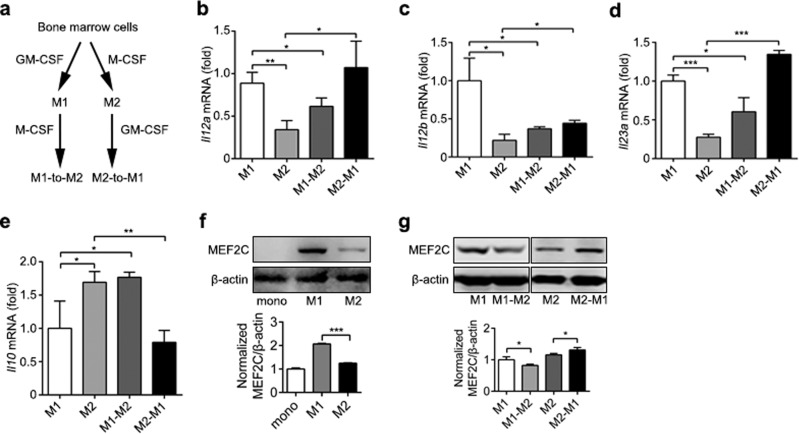
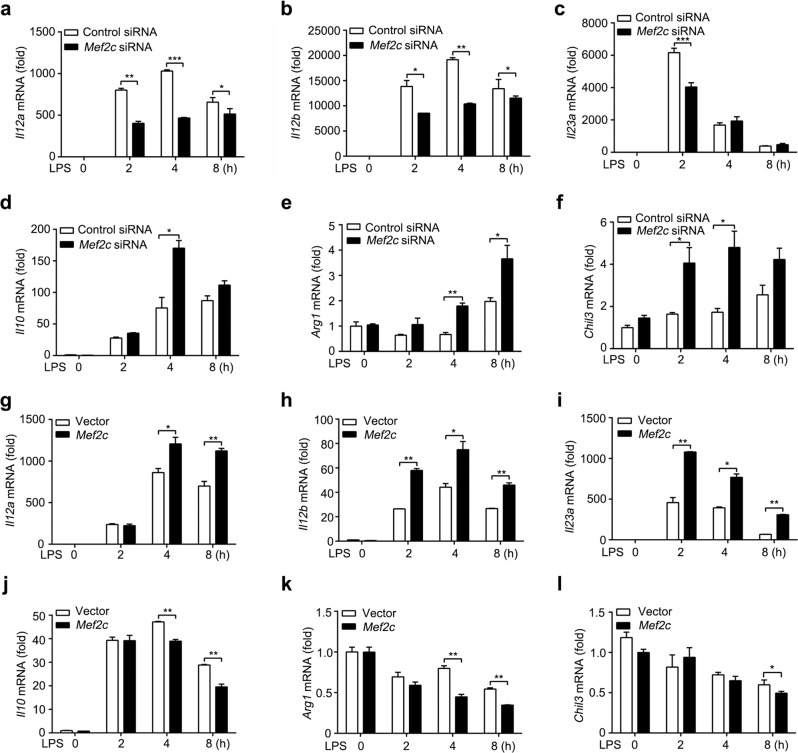
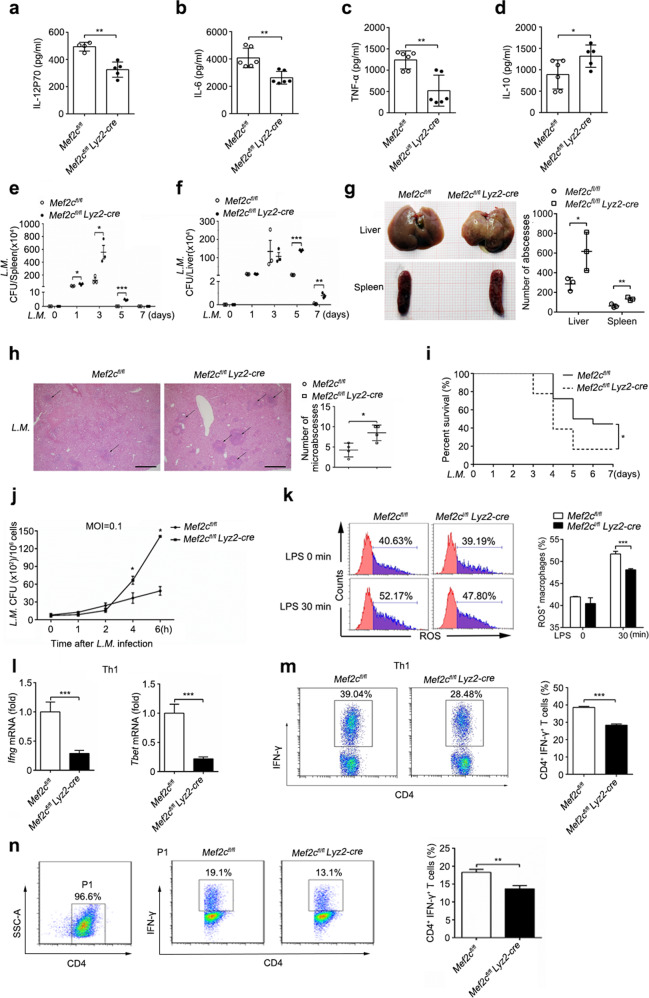
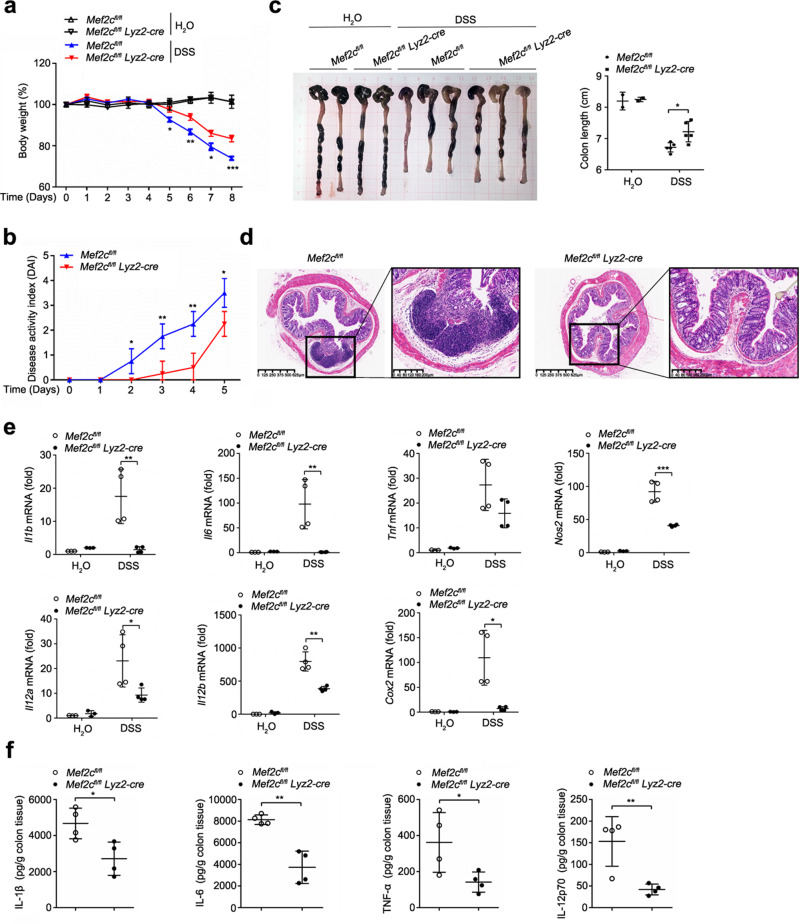
The polarization of macrophages to the M1 or M2 phenotype has a pivotal role in inflammation and host defense; however, the underlying molecular mechanism remains unclear. Here, we show that myocyte enhancer factor 2 C (MEF2C) is essential for regulating M1 macrophage polarization in response to infection and inflammation. Global gene expression analysis demonstrated that MEF2C deficiency in macrophages downregulated the expression of M1 phenotypic markers and upregulated the expression of M2 phenotypic markers. MEF2C significantly promoted the expression of interleukin-12 p35 subunit (Il12a) and interleukin-12 p40 subunit (Il12b). Myeloid-specific Mef2c-knockout mice showed reduced IL-12 production and impaired Th1 responses, which led to susceptibility to Listeria monocytogenes infection and protected against DSS-induced IBD in vivo. Mechanistically, we showed that MEF2C directly activated the transcription of Il12a and Il12b. These findings reveal a new function of MEF2C in macrophage polarization and Th1 responses and identify MEF2C as a potential target for therapeutic intervention in inflammatory and autoimmune diseases.

Keywords: Inflammation; Interleukin-12; Macrophage polarization; Myocyte enhancer factor 2C; T helper type 1 response.


Conflict of interest statement

The authors declare no competing interests.

Figures

Fig. 1
Fig. 1
Mef2c is involved in macrophage polarization. a Mef2cflox/flox and Mef2cflox/flox Lyz2-cre macrophages were stimulated with LPS (100 ng/ml) for 2 h. Total RNA was extracted, and RNA-seq analysis was performed. Heatmaps of the selected gene panels are shown. b Volcano plot of the differentially expressed genes (downregulated and upregulated genes are shown in blue and red, respectively)
Fig. 2
Fig. 2
High expression of MEF2C in M1 macrophages. a Schematic diagram of the strategy used to induce M1 or M2 and M1-to-M2 or M2-to-M1 polarization. Bone marrow-derived cells were differentiated for 5 days into M1 macrophages with GM-CSF (20 ng/ml) and into M2 macrophages with M-CSF (20 ng/ml). On Day 5, GM-CSF-induced M1 macrophages were induced with M-CSF (20 ng/ml)-containing medium for 24 h to undergo M1-to-M2 polarization, and on Day 5, M-CSF-induced M2 macrophages were induced with GM-CSF (20 ng/ml)-containing medium for 24 h to undergo M2-to-M1 polarization. be qPCR analysis of Il12a (b), Il12b (c), Il23a (d) and Il10 (e) expression in macrophages following M1, M2, M1-to-M2 or M2-to-M1 polarization. f Immunoblot analysis of MEF2C expression in monocytes collected on Day 0 (mono) or macrophages following M1 or M2 polarization. g Immunoblot analysis of MEF2C expression in macrophages following M1-to-M2 or M2-to-M1 polarization. The data are representative of three independent experiments. The data represent the mean ± SD. *P < 0.05, **P < 0.01, ***P < 0.001
Fig. 3
Fig. 3
Mef2c influences the expression of macrophage polarization-specific genes. af Bone marrow-derived cells were differentiated for 5 days into M1 macrophages by stimulation with GM-CSF (20 ng/ml). M1 macrophages were then transfected with control or Mef2c siRNA for 48 h and then stimulated with LPS (100 ng/ml) for the indicated times. qPCR analysis of Il12a (a), Il12b (b), Il23a (c), Il10 (d), Arg1 (e), and Chil3 (f) mRNA expression. gl Bone marrow-derived cells were differentiated for 5 days into M2 macrophages by stimulation with M-CSF (20 ng/ml). M2 macrophages were transfected with vector or Mef2c expression plasmid for 48 h and then stimulated with LPS (100 ng/ml) for the indicated times. qPCR analysis of Il12a (g), Il12b (h), Il23a (i), Il10 (j), Arg1 (k), and Chil3 (l) mRNA expression. The data are representative of three independent experiments. The data represent the mean ± SD. *P < 0.05, **P < 0.01, ***P < 0.001
Fig. 4
Fig. 4
Mef2c deficiency impairs macrophage polarization. qPCR analysis of Il12a (a), Il12b (b), Il23a (c), Il10 (d), Arg1 (e), and Chil3 (f) mRNA expression in Mef2cflox/flox and Mef2cflox/flox Lyz2-cre peritoneal macrophages stimulated with LPS (100 ng/ml) for the indicated times. g Immunoblot analysis of iNOS expression in Mef2cflox/flox and Mef2cflox/flox Lyz2-cre peritoneal macrophages stimulated with LPS (100 ng/ml) for the indicated times. h Immunoblot analysis of ARG1 expression in Mef2cflox/flox and Mef2cflox/flox Lyz2-cre peritoneal macrophages stimulated with IL-4 (10 ng/ml) for the indicated times. i Flow cytometric analysis of CD11c and CD206 expression by Mef2cflox/flox and Mef2cflox/flox Lyz2-cre peritoneal macrophages stimulated with LPS (100 ng/ml) or IL-4 (10 ng/ml) for 16 h. j qPCR analysis of Il12a, Il12b, Il10, and Arg1 mRNA expression by peritoneal macrophages collected from Mef2cflox/flox and Mef2cflox/flox Lyz2-cre mice 2 h after intraperitoneal injection of LPS (5 mg/kg). The data are representative of three independent experiments. The data represent the mean ± SD. *P < 0.05, **P < 0.01, ***P < 0.001
Fig. 5
Fig. 5
Mef2c deficiency reduces the host response to Listeria monocytogenes infection. ELISA analysis of IL-12p70 (a), IL-6 (b), TNF-α (c), and IL-10 (d) concentrations in the serum of Mef2cflox/flox and Mef2cflox/flox Lyz2-cre mice 3 days after intravenous injection of Listeria monocytogenes (2 × 105 CFU/mouse). Listeria monocytogenes burdens in the spleens (e) and livers (f) of Mef2cflox/flox and Mef2cflox/flox Lyz2-cre mice on Days 0, 1, 3 5, and 7 after intravenous injection of Listeria monocytogenes (2 × 105 CFU/mouse). Liver abscesses in Mef2cflox/flox and Mef2cflox/flox Lyz2-cre mice were evaluated 3 days after intravenous injection of Listeria monocytogenes (2 × 105 CFU/mouse) by light microscopy (g) and HE staining (h); scale bar = 200 μm. i Survival of Mef2cflox/flox and Mef2cflox/flox Lyz2-cre mice administered Listeria monocytogenes (5 × 105 CFU/mouse) by intravenous injection (n = 20 per group). j Pathogen burden in peritoneal macrophages isolated from Mef2cflox/flox and Mef2cflox/flox Lyz2-cre mice infected with Listeria monocytogenes (MOI = 0.1) for the indicated times. k Flow cytometric analysis of ROS production by peritoneal macrophages isolated from Mef2cflox/flox and Mef2cflox/flox Lyz2-cre mice and stimulated with LPS (100 ng/ml) for the indicated times. l qPCR analysis of Ifng and Tbet expression in spleen cells obtained from Mef2cflox/flox and Mef2cflox/flox Lyz2-cre mice 3 days after intravenous injection of Listeria monocytogenes (2 × 105 CFU/mouse) and cultured for 48 h with gentamicin in the presence of anti-CD3 and anti-CD28 antibodies. m Flow cytometric analysis of IFN-γ expression in CD4+ T cells obtained from the spleens of Mef2cflox/flox and Mef2cflox/flox Lyz2-cre mice 3 days after intravenous injection of Listeria monocytogenes (2 × 105 CFU/mouse). n Naïve CD4+ T cells were sorted from lymph nodes obtained from wild-type mice and cultured in the presence of anti-CD3, anti-CD28, and anti-IL-4 antibodies and supernatant from LPS-stimulated wild-type or Mef2c-deficient macrophages prior to the induction of Th1 cell differentiation in vitro. The proportion of CD4+ IFN-γ+ T cells was then analyzed by flow cytometry. The data are representative of three independent experiments. The data represent the mean ± SD. *P < 0.05, **P < 0.01, ***P < 0.001
Fig. 6
Fig. 6
Mef2cflox/flox Lyz2-cre mice show attenuated experimental colitis in vivo. Mef2cflox/flox and Mef2cflox/flox Lyz2-cre mice were administered drinking water with or without 3% DSS for 7 days to induce acute colitis, followed by a 2-day recovery period with normal drinking water. Body weight changes (a) and DAI scores (b) in DSS-induced experimental colitis mice. c Gross morphology of colons from Mef2cflox/flox and Mef2cflox/flox Lyz2-cre mice and colon lengths. d HE-stained images of colon sections. e qPCR analysis of Il1b, Il6, Tnf, Il12a, Il12b, and Cox2 mRNA expression in the colons of Mef2cflox/flox and Mef2cflox/flox Lyz2-cre mice. f ELISA analysis of IL-1β, IL-6, TNF-α, and IL-12p70 production in the colons of Mef2cflox/flox and Mef2cflox/flox Lyz2-cre mice. The data are representative of three independent experiments. The data represent the mean ± SD. *P < 0.05, **P < 0.01, ***P < 0.001
Fig. 7
Fig. 7
Mef2c deficiency decreases proinflammatory macrophages and Th1 responses in experimental colitis. Mef2cflox/flox and Mef2cflox/flox Lyz2-cre mice were administered drinking water with or without 3% DSS for 7 days to induce acute colitis, followed by a 2-day recovery period with normal drinking water. a Immunofluorescence analysis of F4/80 and CD86 expression in the colon tissue of DSS-induced experimental colitis mice. b Immunofluorescence analysis of F4/80 and CD206 expression in the colon tissue of DSS-induced experimental colitis mice. Flow cytometric analysis of CD11c (c), CD206 (d) and (e) IL12B expression in macrophages from the colon tissue of DSS-induced experimental colitis mice. f Flow cytometric analysis of IFN-γ expression in CD4 T cells from the colon tissue of DSS-induced experimental colitis mice. g Immunohistochemical analysis of IFN-γ expression in the colon tissue of DSS-induced experimental colitis mice. The data are representative of three independent experiments. The data represent the mean ± SD. *P < 0.05, ***P < 0.001
Fig. 8
Fig. 8
MEF2C directly regulates the transcription of Il12a and Il12b. Dual-luciferase reporter assays were performed 24 h after the cotransfection of HEK 293 T cells with Mef2c plasmids and Il12a (a) and Il12b (b) luciferase reporter plasmids. ChIP assays were used to analyze MEF2C recruitment to the Il12a (c) and Il12b (d) promoters in peritoneal macrophages stimulated with or without LPS. Schematic diagrams of Il12a (e) and Il12b (f) mutant luciferase reporter plasmids (left). Dual-luciferase reporter assays were performed 24 h after the cotransfection of HEK 293 T cells with Mef2c plasmids and Il12a (e) and Il12b (f) mutant luciferase reporter plasmids. Raw 264.7 cells were transfected with Mef2c plasmids or wild-type and mutant Il12a (g) and Il12b (h) luciferase reporter plasmids for 24 h and then stimulated with LPS (100 ng/ml). Dual-luciferase reporter assays were performed. The data are representative of three independent experiments and represent the mean ± SD. *P < 0.05, **P < 0.01, ***P < 0.001

References

    1. DeNardo DG, Ruffell B. Macrophages as regulators of tumour immunity and immunotherapy. Nat Rev Immunol. 2019;19:369–82. - PMC - PubMed
    1. Watanabe S, Alexander M, Misharin AV, Budinger GRS. The role of macrophages in the resolution of inflammation. J Clin Investig. 2019;129:2619–28. - PMC - PubMed
    1. Geissmann F, Manz MG, Jung S, Sieweke MH, Merad M, Ley K. Development of monocytes, macrophages, and dendritic cells. Science. 2010;327:656–61. - PMC - PubMed
    1. Diskin C, Ryan TAJ, O’Neill LAJ. Modification of proteins by metabolites in immunity. Immunity. 2021;54:19–31. - PubMed
    1. Phan AT, Goldrath AW, Glass CK. Metabolic and epigenetic coordination of T cell and macrophage immunity. Immunity. 2017;46:714–29. - PMC - PubMed

Publication types