. 2022;56(6):4729-4746.
doi: 10.1007/s11135-022-01340-w. Epub 2022 Feb 15.

COVID-19: average time from infection to death in Poland, USA, India and Germany

Affiliations

COVID-19: average time from infection to death in Poland, USA, India and Germany

Antoni Wiliński et al. Qual Quant. 2022.

Abstract

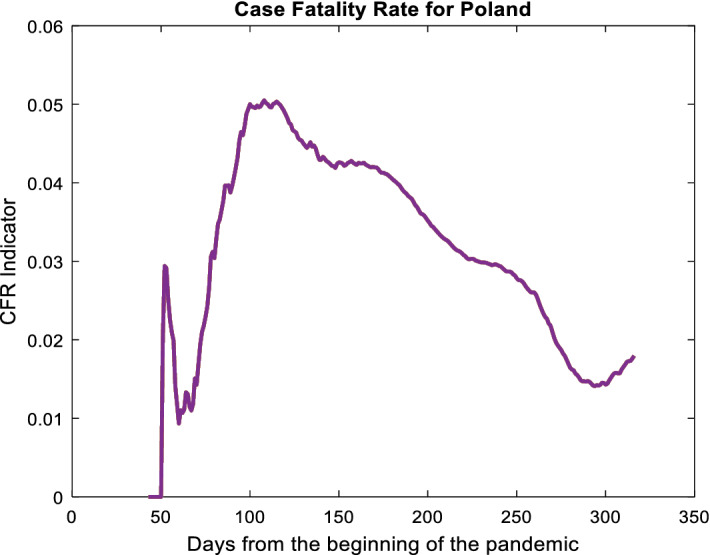
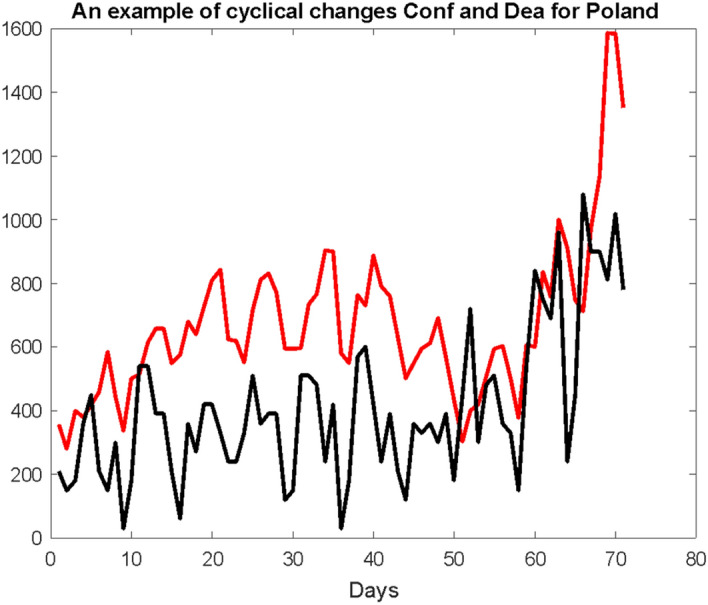
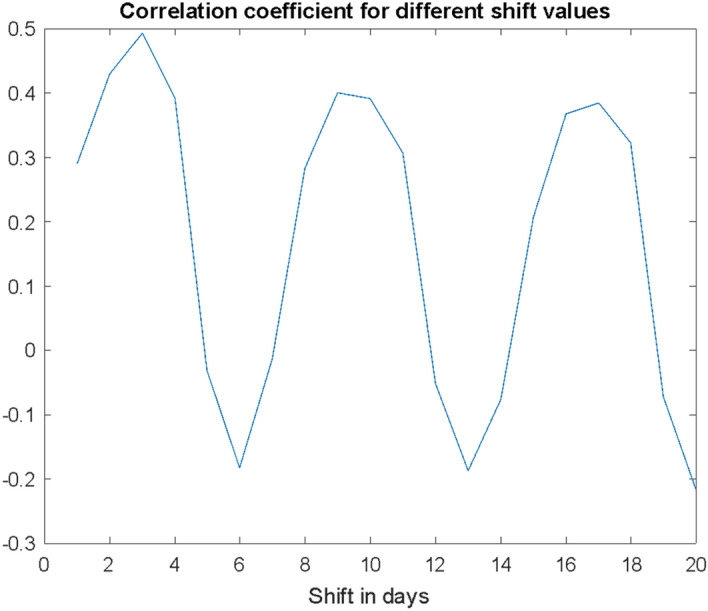
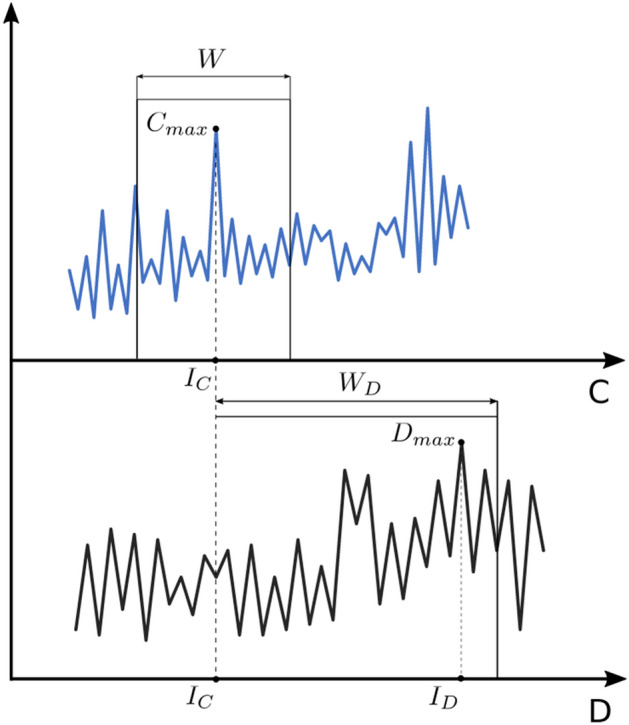
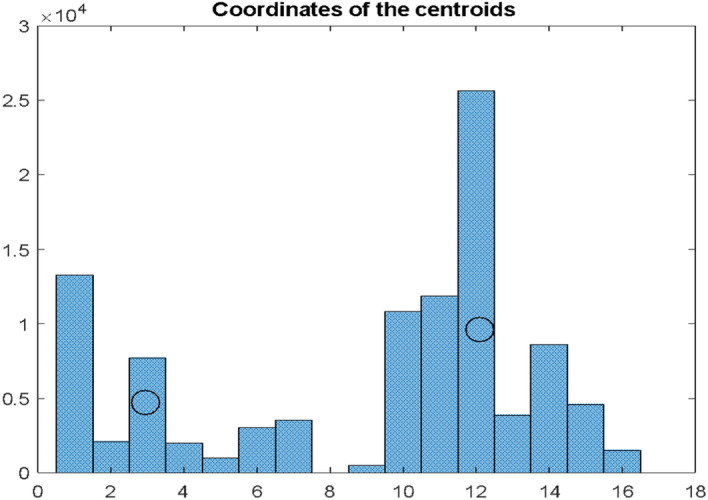
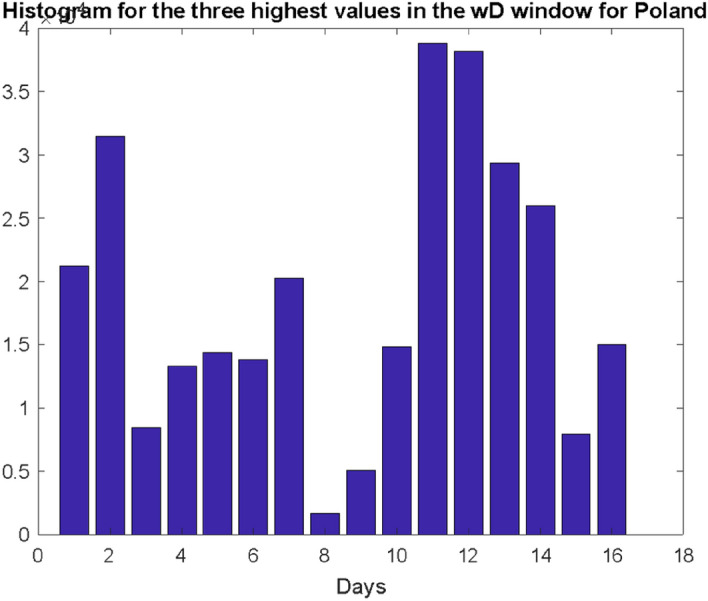
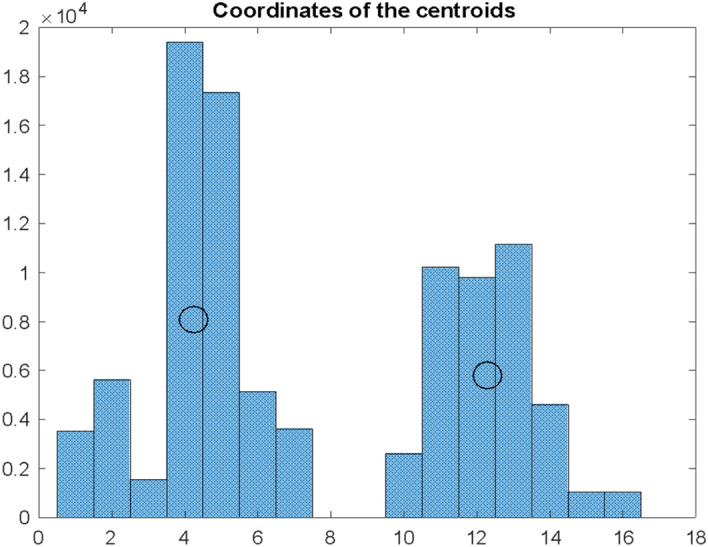
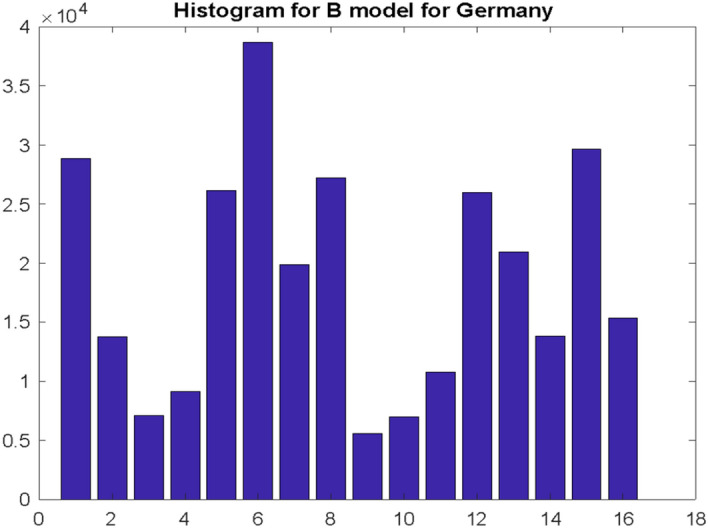
There are many discussions in the media about an interval (delay) from the time of the infections to deaths. Apart from the curiosity of the researchers, defining this time interval may, under certain circumstances, be of great organizational and economic importance. The study considers an attempt to determine this difference through the correlations of shifted time series and a specific bootstrapping that allows finding the distance between local maxima on the series under consideration. We consider data from Poland, the USA, India and Germany. The median of the difference's distribution is quite consistent for such diverse countries. The main conclusion of our research is that the searched interval has rather a multimodal form than unambiguously determined.

Keywords: Bootstrapping; Confirmed infection cases; Correlation; Covid-19; Time series.


Conflict of interest statement

Conflict of interestThe authors have not disclosed any competing interests.

Figures

Fig. 1
Fig. 1
CFR indicator for Poland
Fig. 2
Fig. 2
The probability of cumulative values runs: Conf (blue) and Dea increased k = 57 times (black)
Fig. 3
Fig. 3
An example of two considered time series Conf and Dea (Dea with symbolically k-times increased values of ordinates) with a shift of the Dea series to the left
Fig. 4
Fig. 4
Daily increments of the Conf variable (red curve) and the Dea variable (black curve) with the ordinates increased k times. The Dea curve is shifted 7 days to the left
Fig. 5
Fig. 5
The correlation coefficient for the two considered series in days Conf and Dea for different values of the variable shift—series Dea forwards to Conf [in days]—data for Poland
Fig. 6
Fig. 6
Time windows in the Conf (top) and Dea (bottom) graphs
Fig. 7
Fig. 7
Histogram of differences dIs for S=1000 simulations according to the bootstrapping principle in Conf and Dea series for Poland. The histogram intervals were divided into two conventional clusters for which the coordinates of the centroids were determined
Fig. 8
Fig. 8
Histogram illustrating the distribution of the three highest values of the number of deaths recorded in the wD window for Poland. Research carried out according to the model B
Fig. 9
Fig. 9
Histogram of differences dIs for the USA. The histogram intervals were divided into two conventional clusters for which the coordinates of the centroids were determined
Fig. 10
Fig. 10
Histogram illustrating the distribution of the three highest values of the number of deaths recorded in the wD window for the USA. Research carried out according to the model B
Fig. 11
Fig. 11
Histogram of differences dIs for Germany. The histogram intervals were divided into three conventional clusters for which the coordinates of the centroids were determined
Fig. 12
Fig. 12
Histogram illustrating the distribution of the three highest values of the number of deaths recorded in the wD window for Germany. Research carried out according to the model B
Fig. 13
Fig. 13
Histogram of differences dIs for India. The histogram’s intervals were divided into two conventional clusters for which the coordinates of the centroids were determined
Fig. 14
Fig. 14
Histogram illustrating the distribution of the three highest values of the number of deaths recorded in the wD window for India. Research carried out according to the model B

References

    1. Ballı S. Data analysis of Covid-19 pandemic and short-term cumulative case forecasting using machine learning time series methods. Chaos, Solitons Fractals. 2020;142:110512. doi: 10.1016/j.chaos.2020.110512. - DOI - PMC - PubMed
    1. Berkowitz J, Kilian L. Recent developments in bootstrapping time series. Economet. Rev. 2000;19(1):1–48. doi: 10.1080/07474930008800457. - DOI
    1. Bollen KA, Stine RA. Bootstrapping goodness-of-fit measures in structural equation models. Sociol. Methods Res. 1992;21(2):205–229. doi: 10.1177/0049124192021002004. - DOI
    1. “The Center for Systems Science and Engineering (CSSE) at Johns Hopkins University”, https://gisanddata.maps.arcgis.com/apps/opsdashboard/
    1. Chruściel, P. T., & Szybka, S. J. (2020). Universal properties of the dynamics of the Covid-19 pandemics. medRxiv.

LinkOut - more resources